
Spending on the data center buildout is quoted in several different ways and often measures different inputs. This page helps us separate and understand what the numbers mean and how much impact the buildout actually has on the U.S. construction industry as well as the overall national economy and market.
Decoding Data Center Spending Metrics
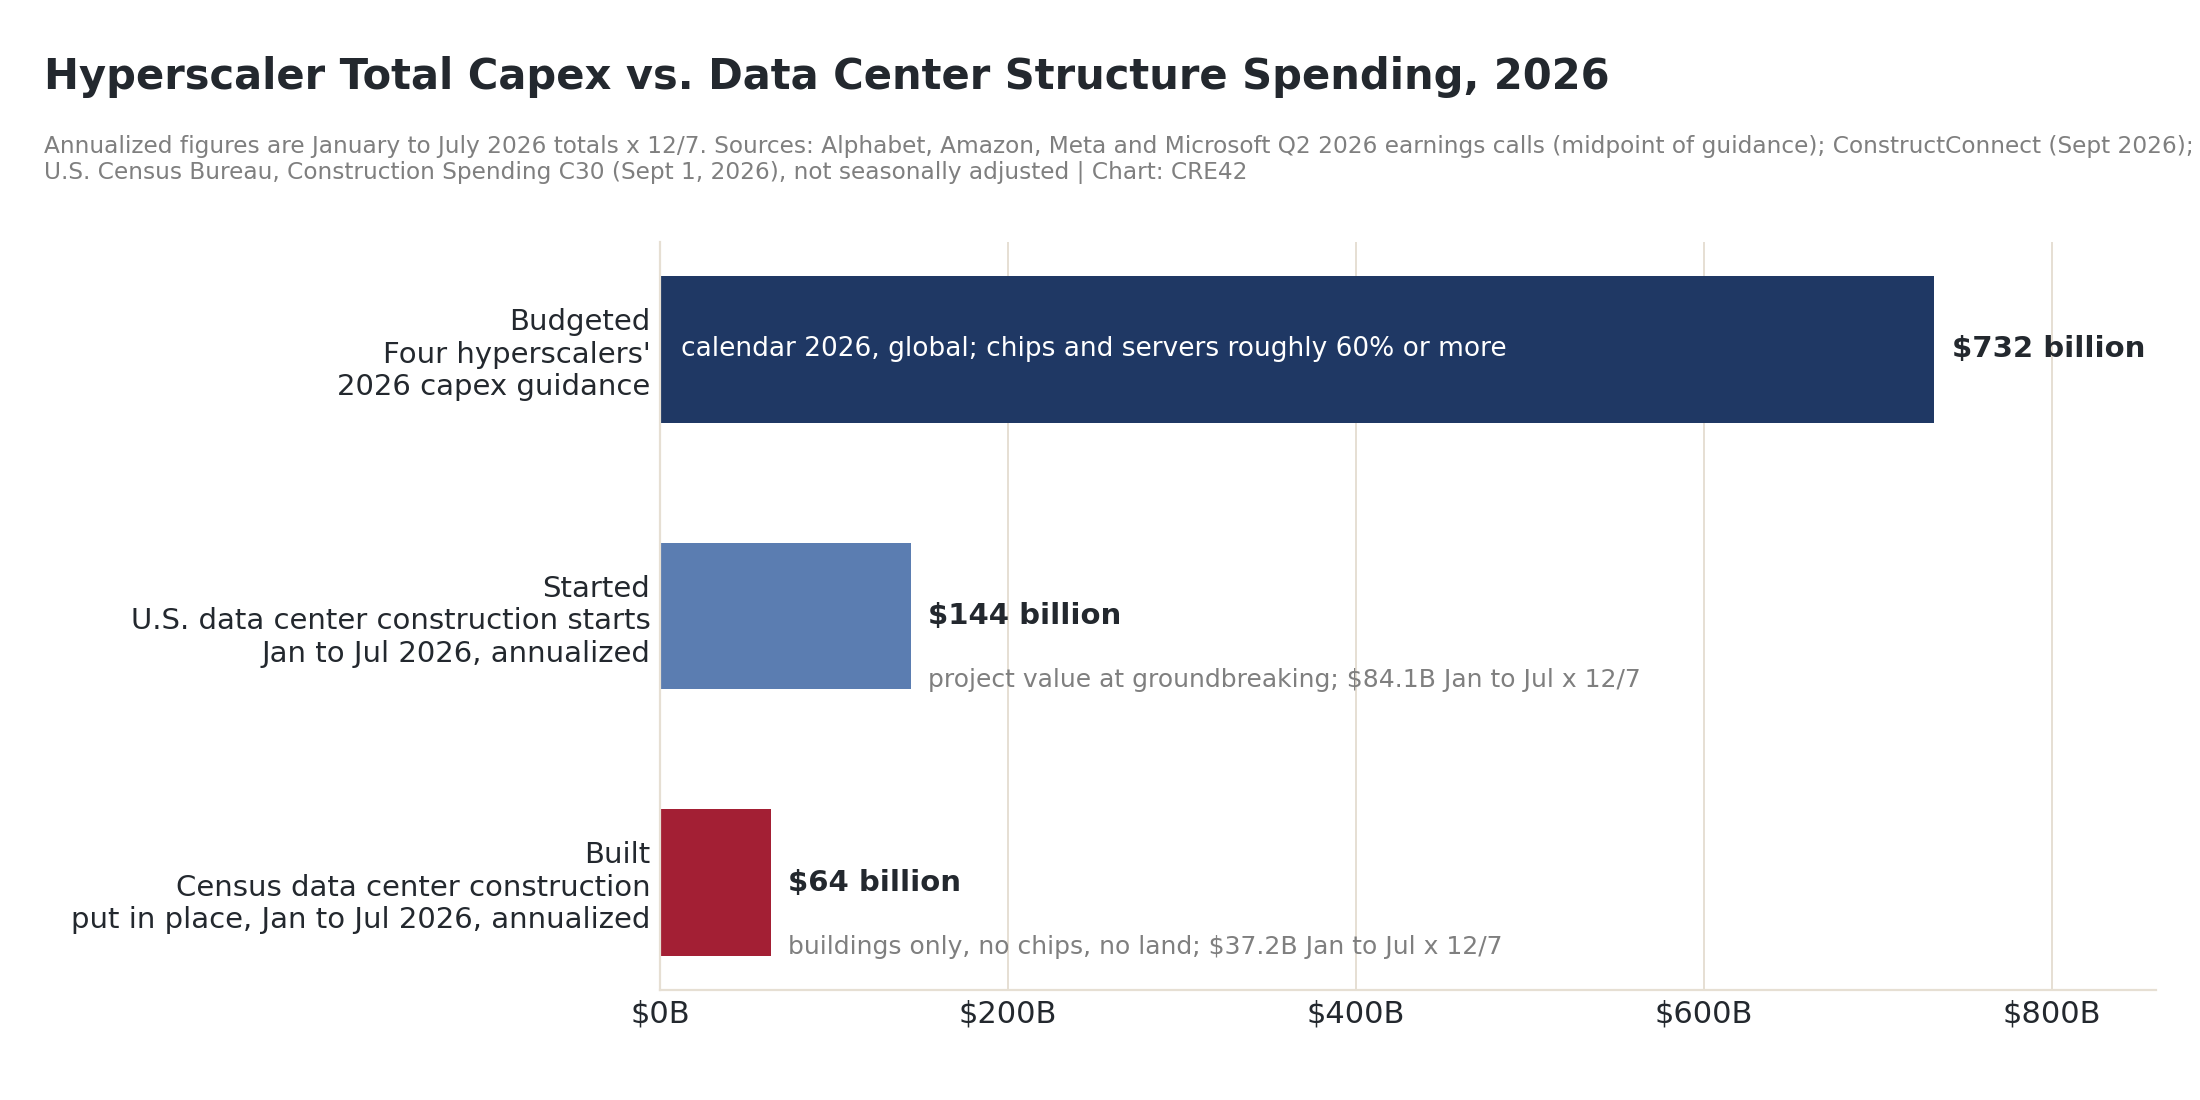
Hyperscaler Total Capex vs. Data Center Structure Spending, 2026 | Sources: Alphabet, Amazon, Meta, Microsoft Q2 2026 earnings calls; ConstructConnect; U.S. Census Bureau C30
- Budgeted is global capital expenditure, booked when paid. Alphabet, Amazon, Meta and Microsoft guided to roughly $720–745 billion for 2026 on their July earnings calls, and chips and servers are roughly 60% or more of it.[1]
- Started is the value of projects breaking ground: $84 billion in the first seven months of 2026, $144 billion annualized, against $29 billion for all of 2025.[2]
- Built is what the Census Bureau counts as construction put in place: on-site work on the buildings themselves, no chips and no land. It was $37 billion in the first seven months of 2026, $64 billion annualized; the July seasonally adjusted annual rate was $75 billion.[3]
- Annualized figures on this page are January to July 2026 totals multiplied by 12/7, not the seasonally adjusted annual rate for a single month. The two differ when the pace changes within the year: for data center construction the pro rata figure is $64 billion and the July rate is $75 billion.
Construction Is a Small and Shrinking Share of Capex
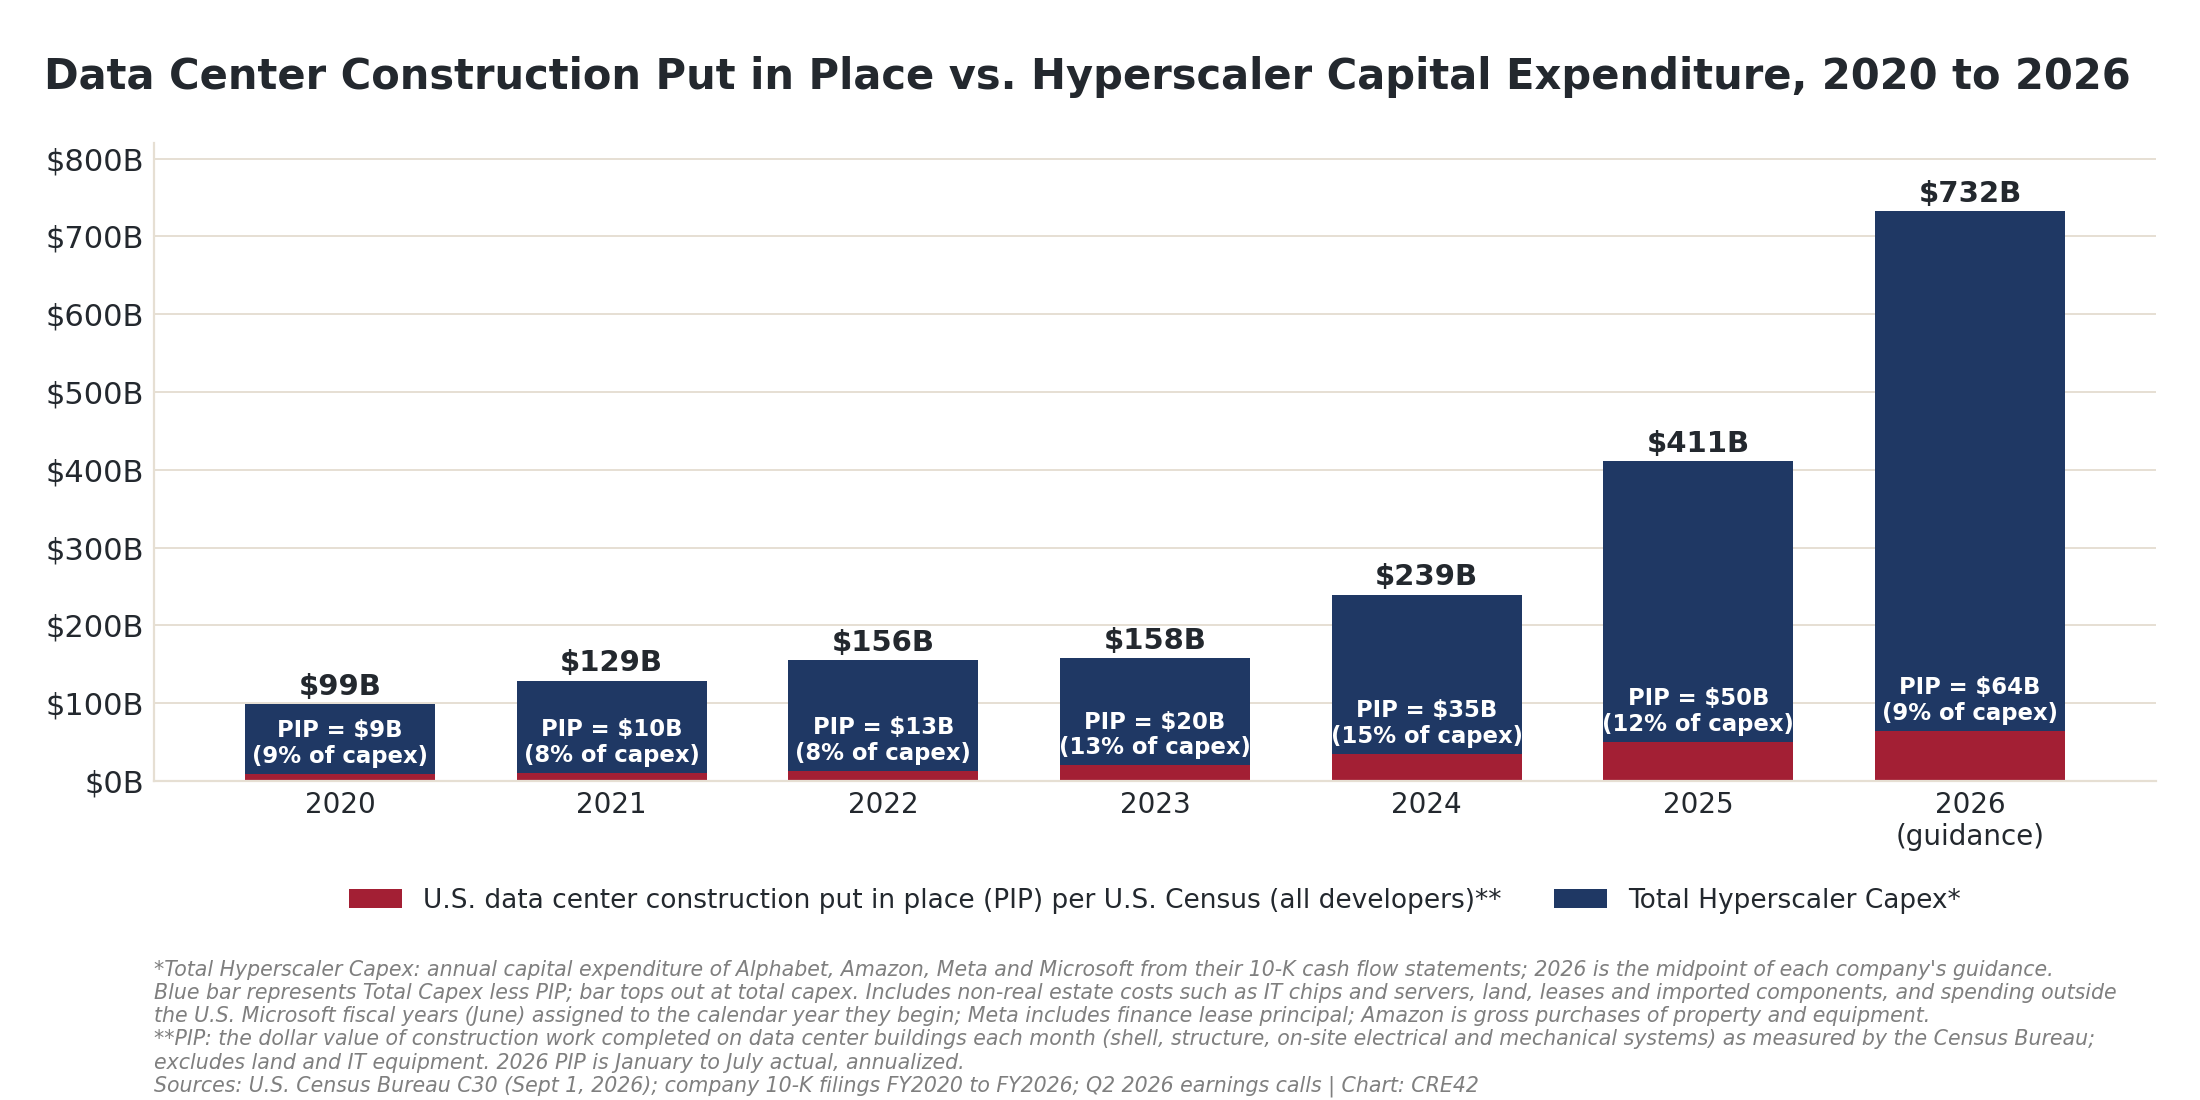
Data Center Construction Put in Place vs. Hyperscaler Capital Expenditure, 2020 to 2026 | Sources: U.S. Census Bureau C30; Alphabet, Amazon, Meta, Microsoft 10-K filings FY2020 to FY2026; Q2 2026 earnings calls
- Four-company capex rose from $99 billion in 2020 to $411 billion in 2025, and the companies have guided to about $732 billion for 2026.[4]
- U.S. data center construction put in place rose from $9 billion to $50 billion over the same period, and is running at about $64 billion annualized in 2026.[3]
- Construction was 8–9% of capex in 2020–2022, peaked at 15% in 2024 as the building wave started, and is falling back toward 9% as chip purchases outrun construction.
- Data center construction put in place and hyperscaler capex come from different sources (U.S. Census and company reports, respectively) and measure different but related things. The comparison is meant to be instructive rather than definitive.
Where the Money Goes
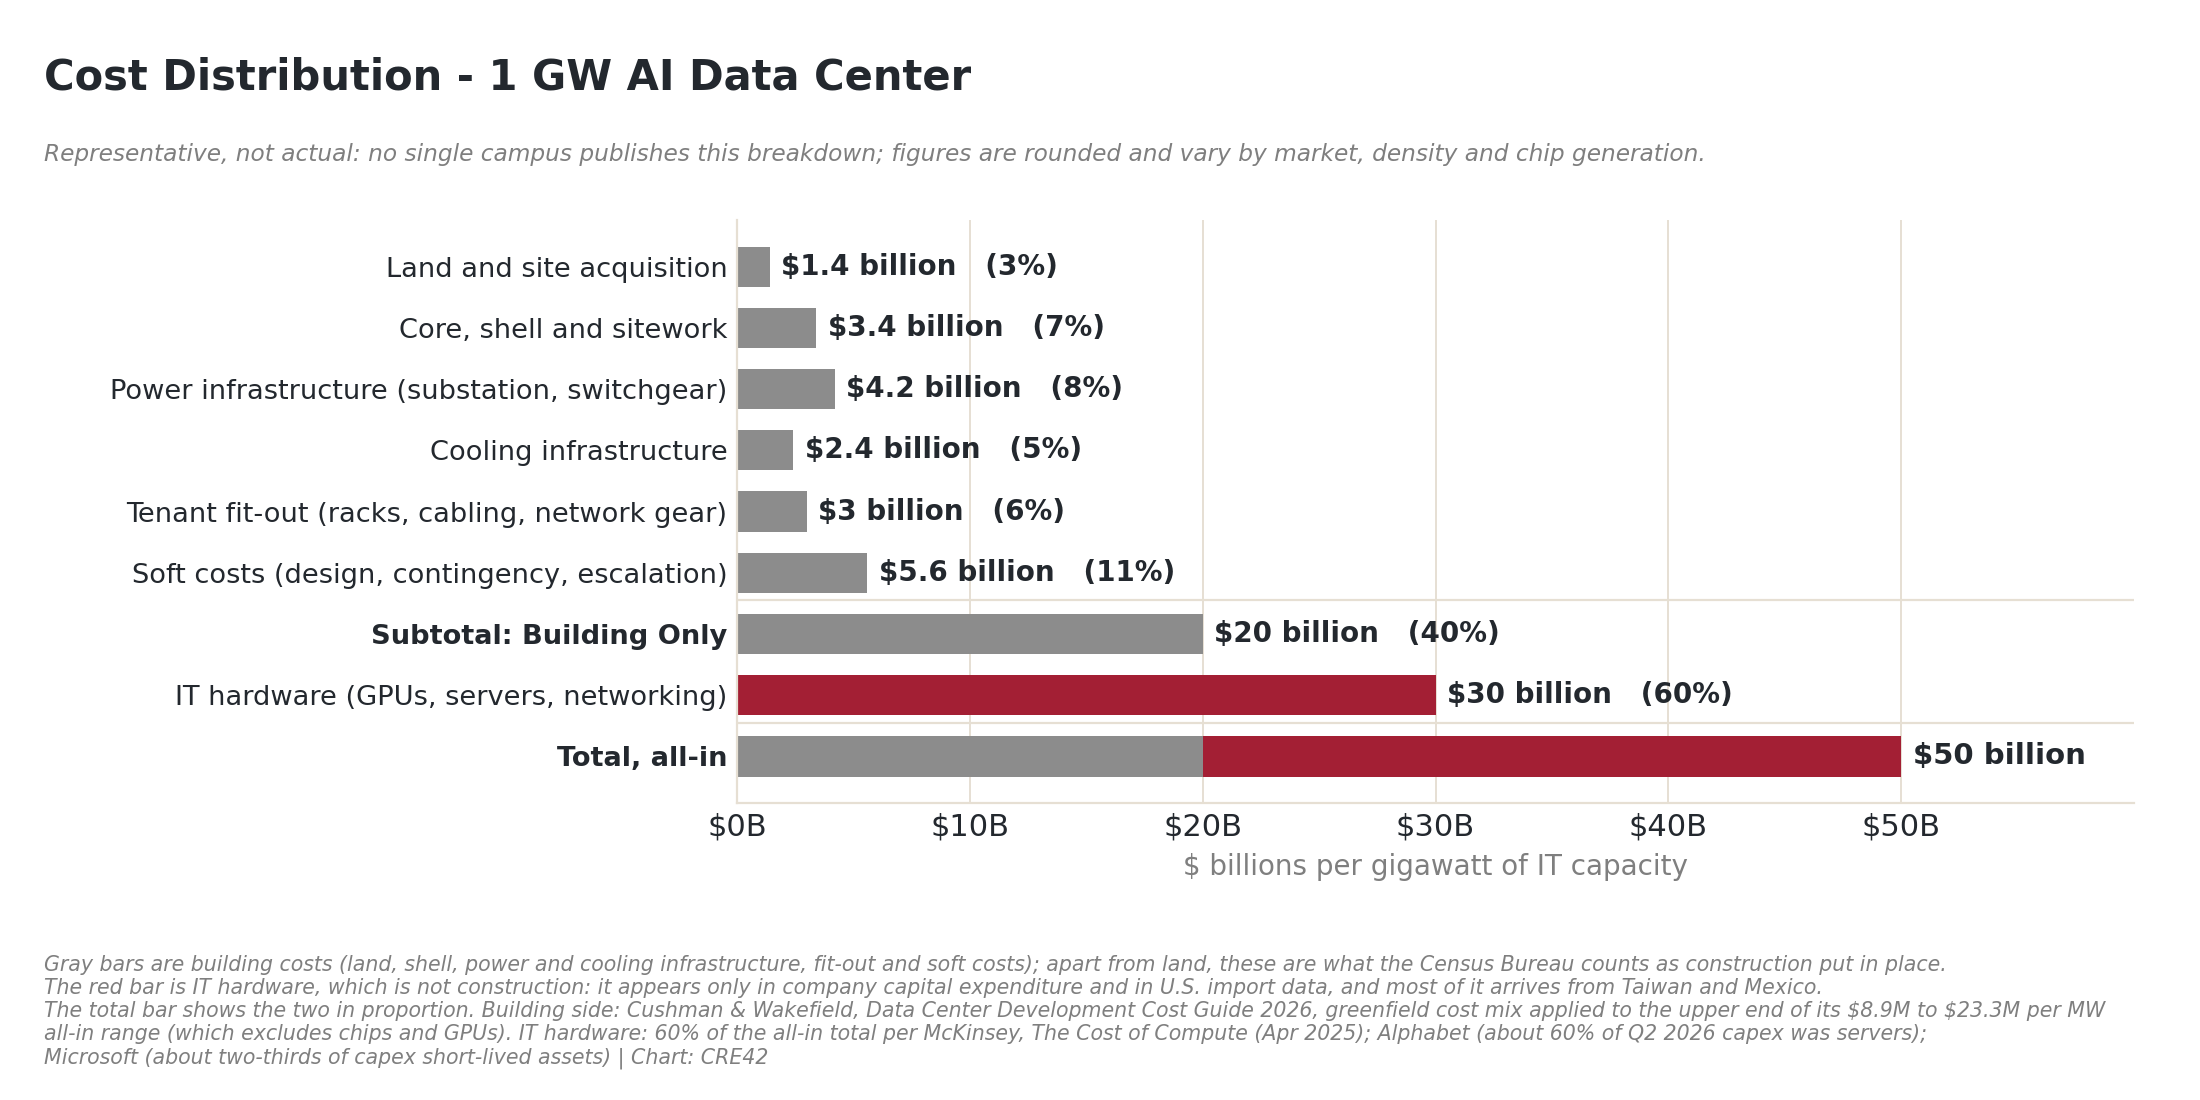
Cost Distribution - 1 GW AI Data Center (representative) | Sources: Cushman & Wakefield, Data Center Development Cost Guide 2026; McKinsey, The Cost of Compute (April 2025); Alphabet and Microsoft Q2 2026 earnings calls
- The building side of a 1 GW AI campus (land, shell, power and cooling infrastructure, fit-out, soft costs) runs about $20 billion at the upper end of Cushman & Wakefield’s 2026 range, which excludes chips and GPUs.[5]
- The chips and servers inside add roughly $30 billion more: hardware is about 60% of the all-in total in McKinsey’s framework and in the hyperscalers’ own descriptions of their spending.[6]
- Power infrastructure is the largest single building line (21% of the building side); land is the smallest (7%).
- Apart from land, the gray bars are what Census counts as construction. The red bar never appears in construction data; it shows up only in company capex and in U.S. imports.
Data Center Construction in Context
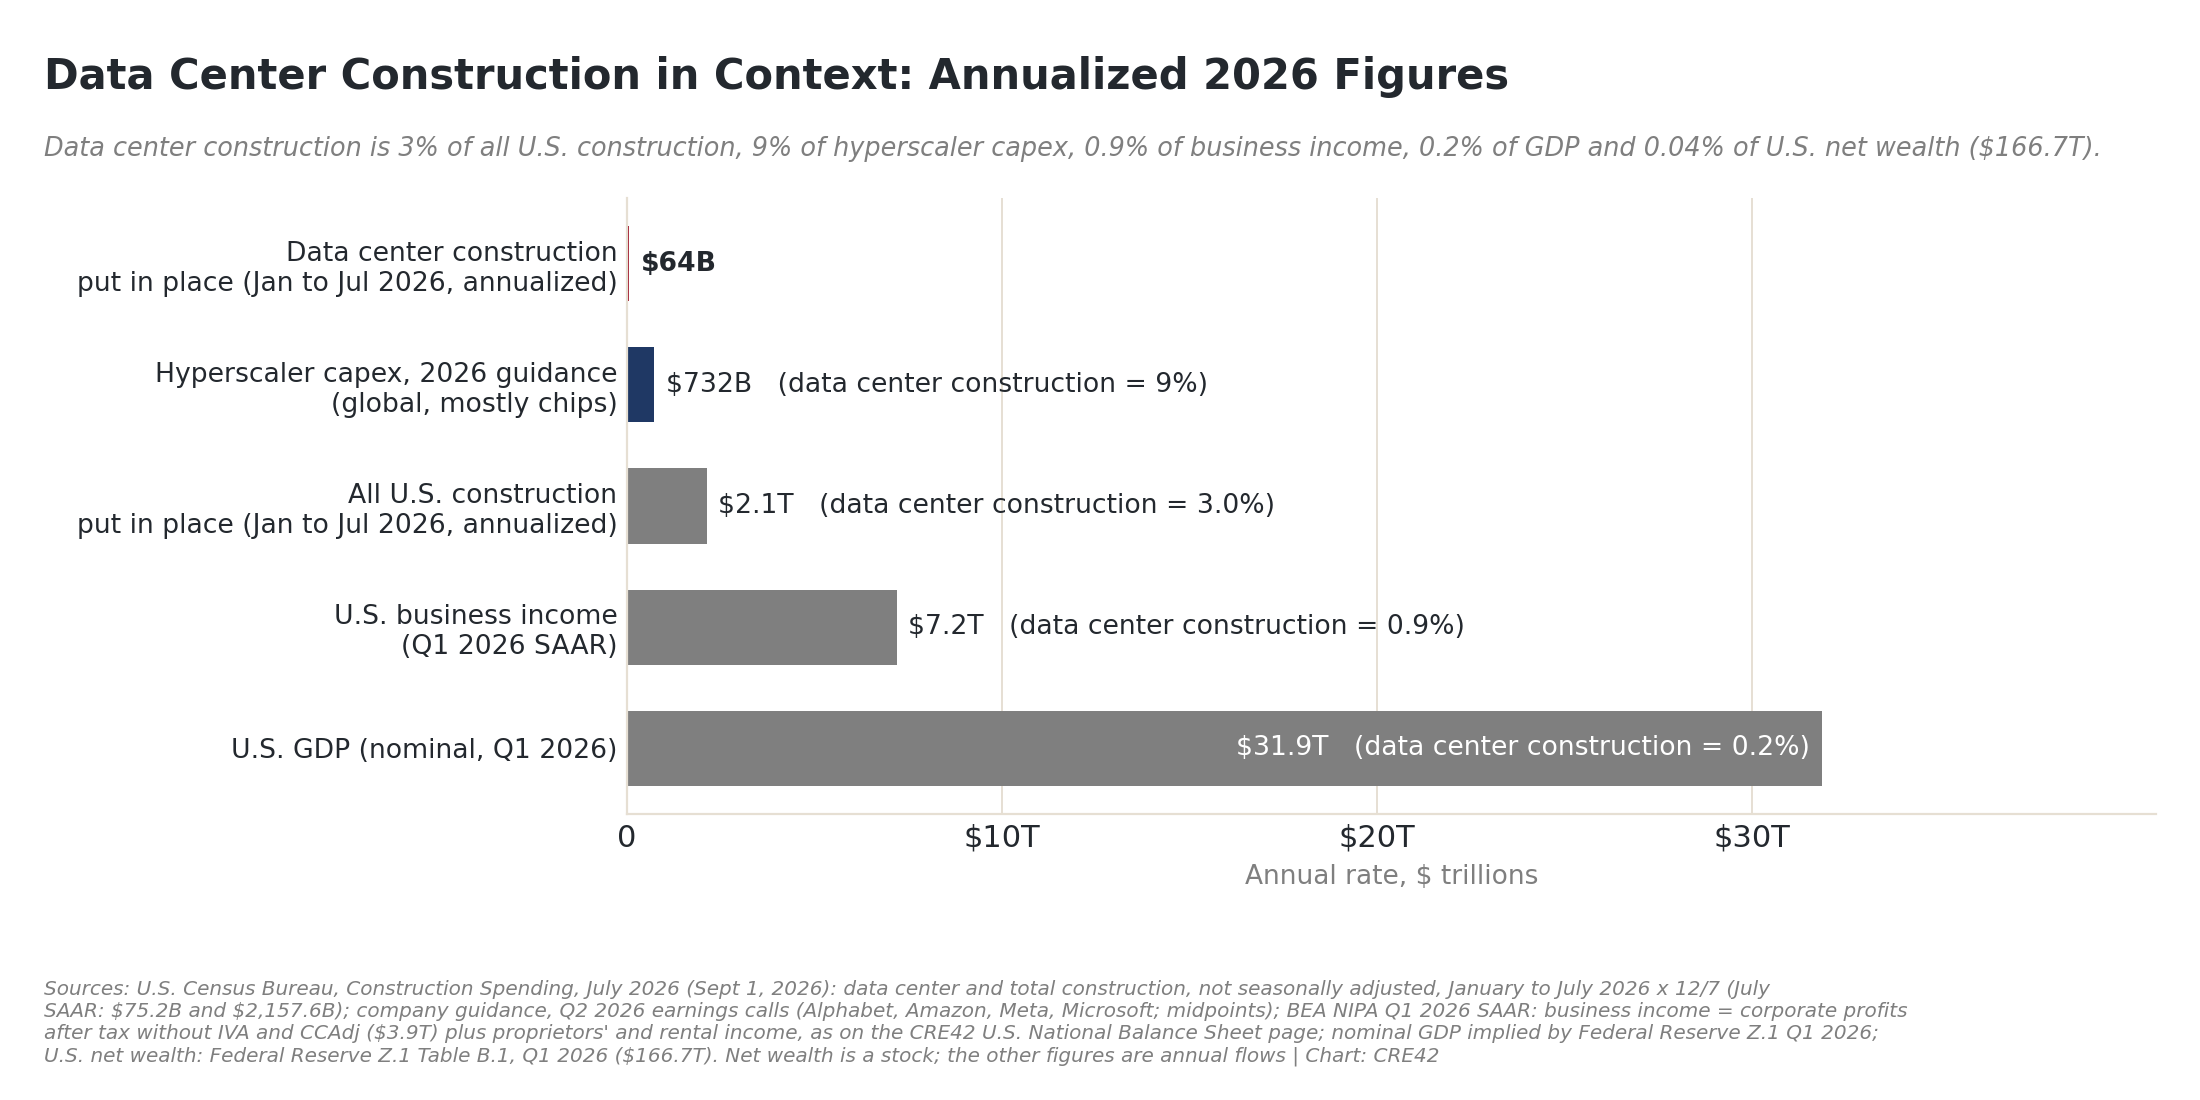
Data Center Construction in Context: Annualized 2026 Figures | Sources: U.S. Census Bureau C30; company guidance; BEA NIPA; Federal Reserve Z.1
- Data center construction put in place is running at about $64 billion a year (January to July 2026, annualized). That is 3% of all U.S. construction ($2.1 trillion, public and private, every sector, on the same basis), 9% of the four hyperscalers’ 2026 capex ($732 billion, global, mostly hardware), 0.9% of U.S. business income ($7.2 trillion), 0.2% of GDP ($31.9 trillion) and 0.04% of U.S. net wealth ($166.7 trillion, a stock rather than an annual flow).[7]
- If the AI build-out slowed sharply, the direct construction exposure is the $64 billion bar: about 0.2% of GDP, comparable to a single year’s decline in housing construction (see the sector chart below), and concentrated in a small number of markets and trades (electrical, mechanical, switchgear) rather than spread across the industry.
- The $700+ billion estimated hyperscaler capex figure is widely cited and dominates much of the data center “bubble” debate. This capex is comprised mostly of imported hardware, so its footprint in U.S. GDP is smaller than the headline, but it is potentially very consequential for markets due to its role in underpinning revenues, profits and valuations for a large part of the U.S. stock market, starting with NVIDIA, Oracle, Amazon, Alphabet (Google), Microsoft, Meta and now SpaceX, among others.
U.S. Share of Hyperscaler Capex
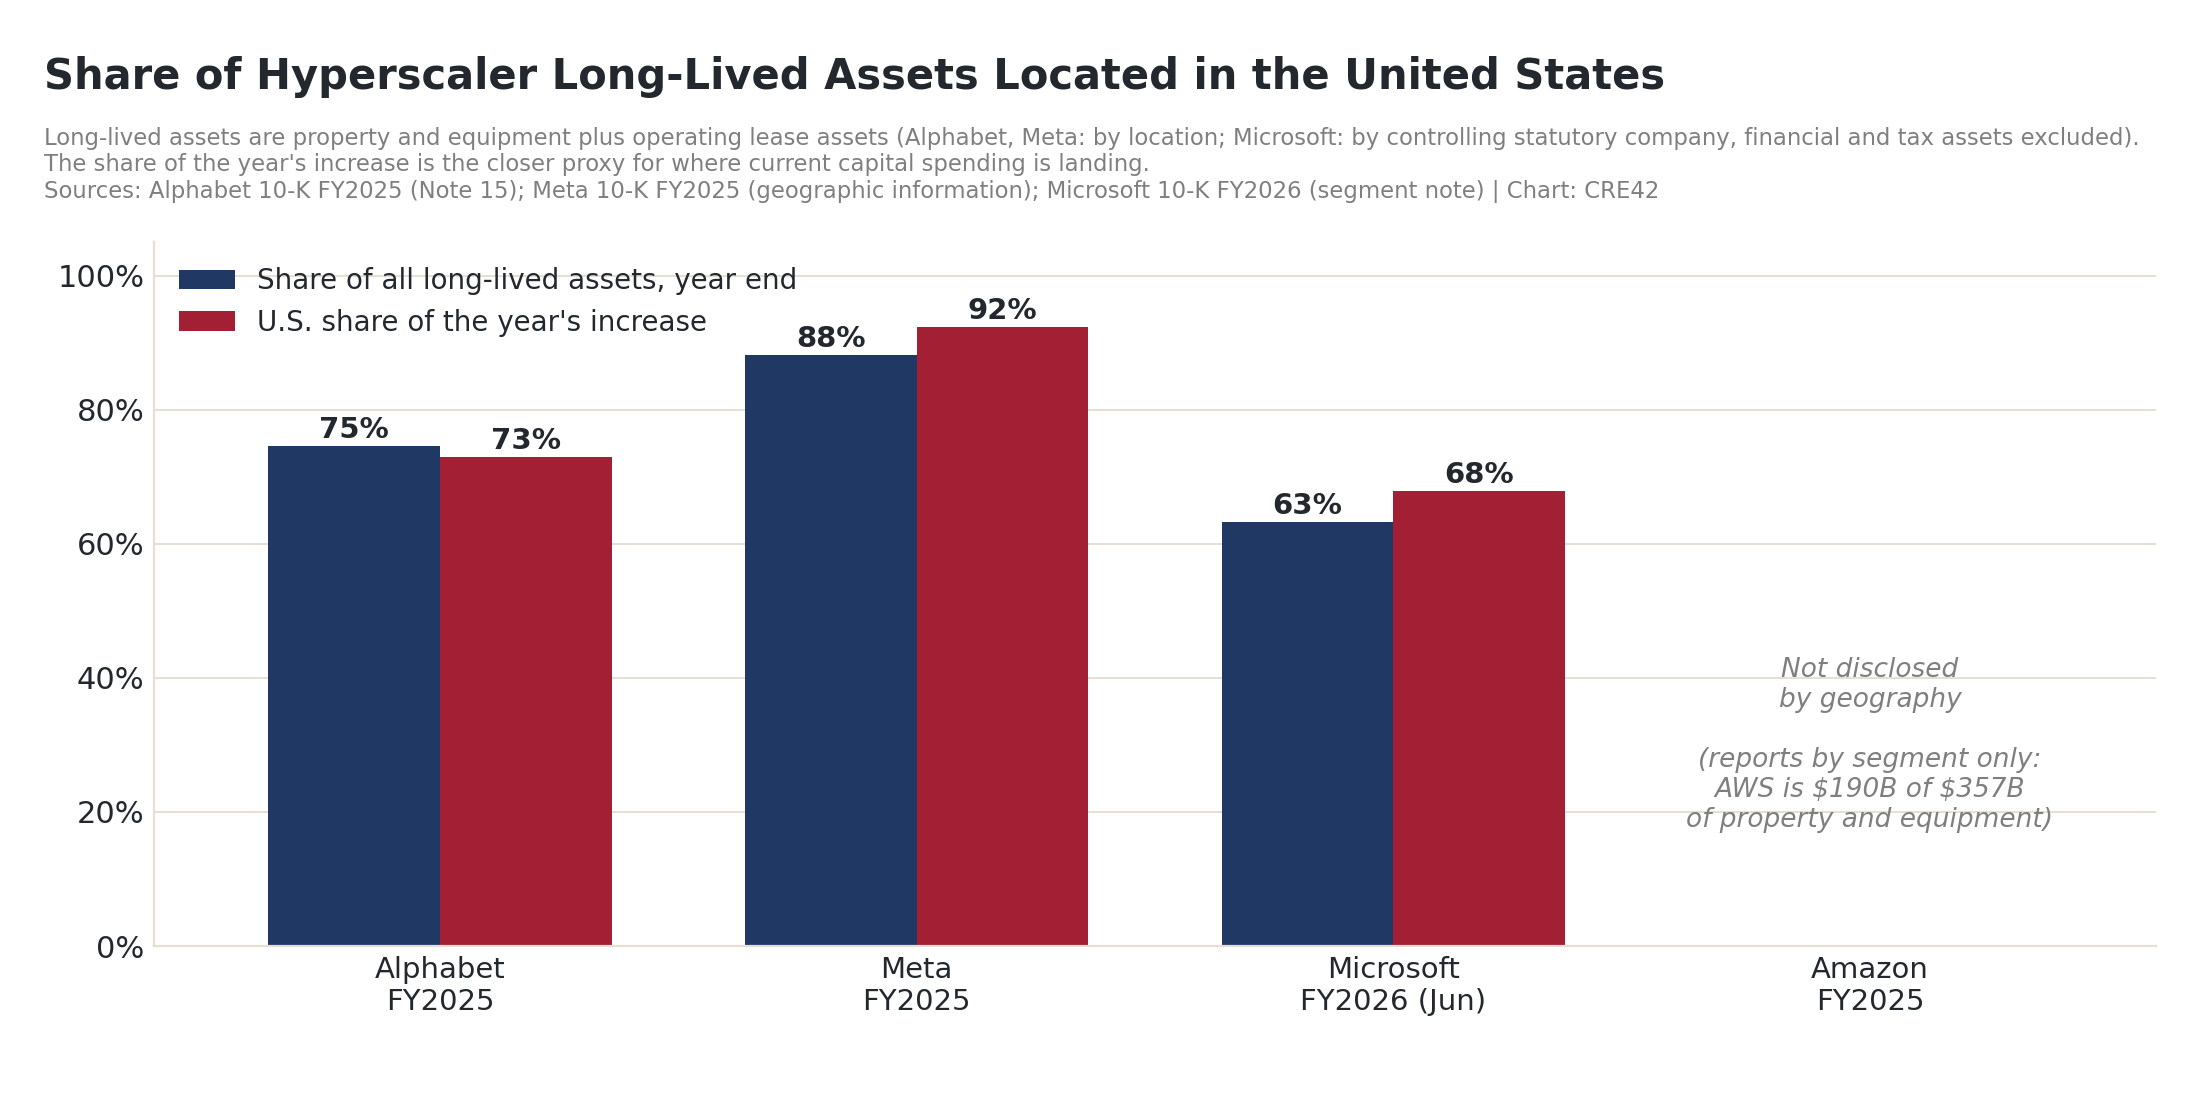
Share of Hyperscaler Long-Lived Assets Located in the United States | Sources: Alphabet 10-K FY2025; Meta 10-K FY2025; Microsoft 10-K FY2026
- The 10-K geographic note is the only primary disclosure of where the assets sit. Alphabet has 75% of its long-lived assets in the U.S., Meta 88%, Microsoft 63%; the U.S. share of each company’s latest annual increase was 73%, 92% and 68%.[8]
- Amazon reports property and equipment by segment only (AWS $190 billion of $357 billion) and does not disclose geography.
- Put together: roughly two-thirds to three-quarters of the buildings are in the United States, and most of the money inside them is imported.
U.S. Data Center Construction (Put in Place)
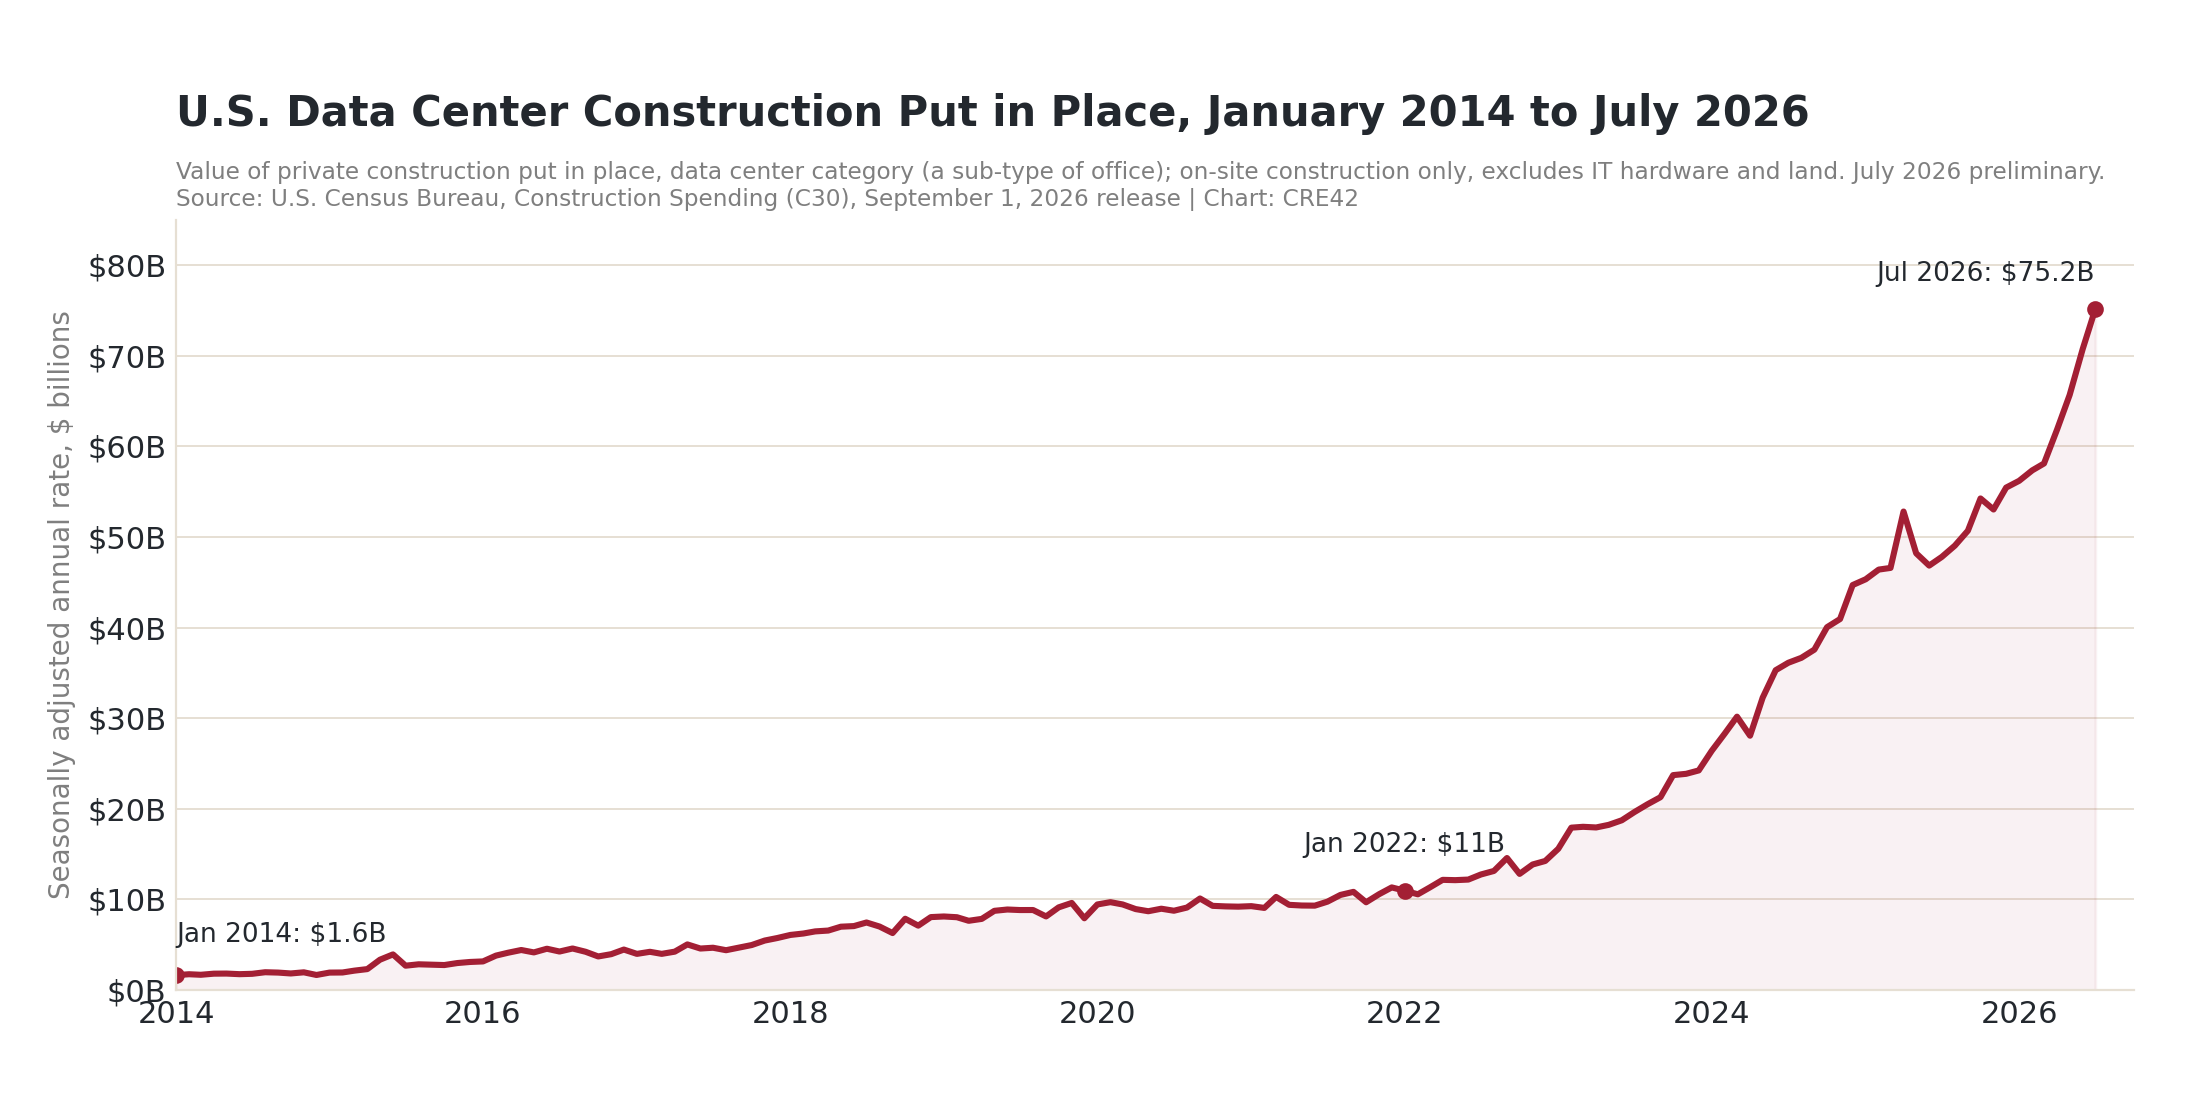
U.S. Data Center Construction Put in Place, January 2014 to July 2026 | Source: U.S. Census Bureau, Construction Spending (C30), September 1, 2026 release
- Data center construction was $1.6 billion at an annual rate in January 2014 and $11 billion in January 2022; it reached $75.2 billion in July 2026, up 57% in a year and roughly double two years earlier.[3]
- Calendar-year totals: $20 billion in 2023, $35 billion in 2024, $50 billion in 2025; January to July 2026 was $37 billion, up 35% on the same months of 2025, or $64 billion annualized.
- Cumulative construction from 2022 through July 2026 is about $154 billion; 2022 through 2024 alone sums to $67 billion.
- Census files data centers as a sub-type of office. In January to July 2026 they were 50% of all office construction (private and public) and 8.6% of all private nonresidential construction; at the July rate, 54% and 10%.
U.S. Construction by Sector (2026)
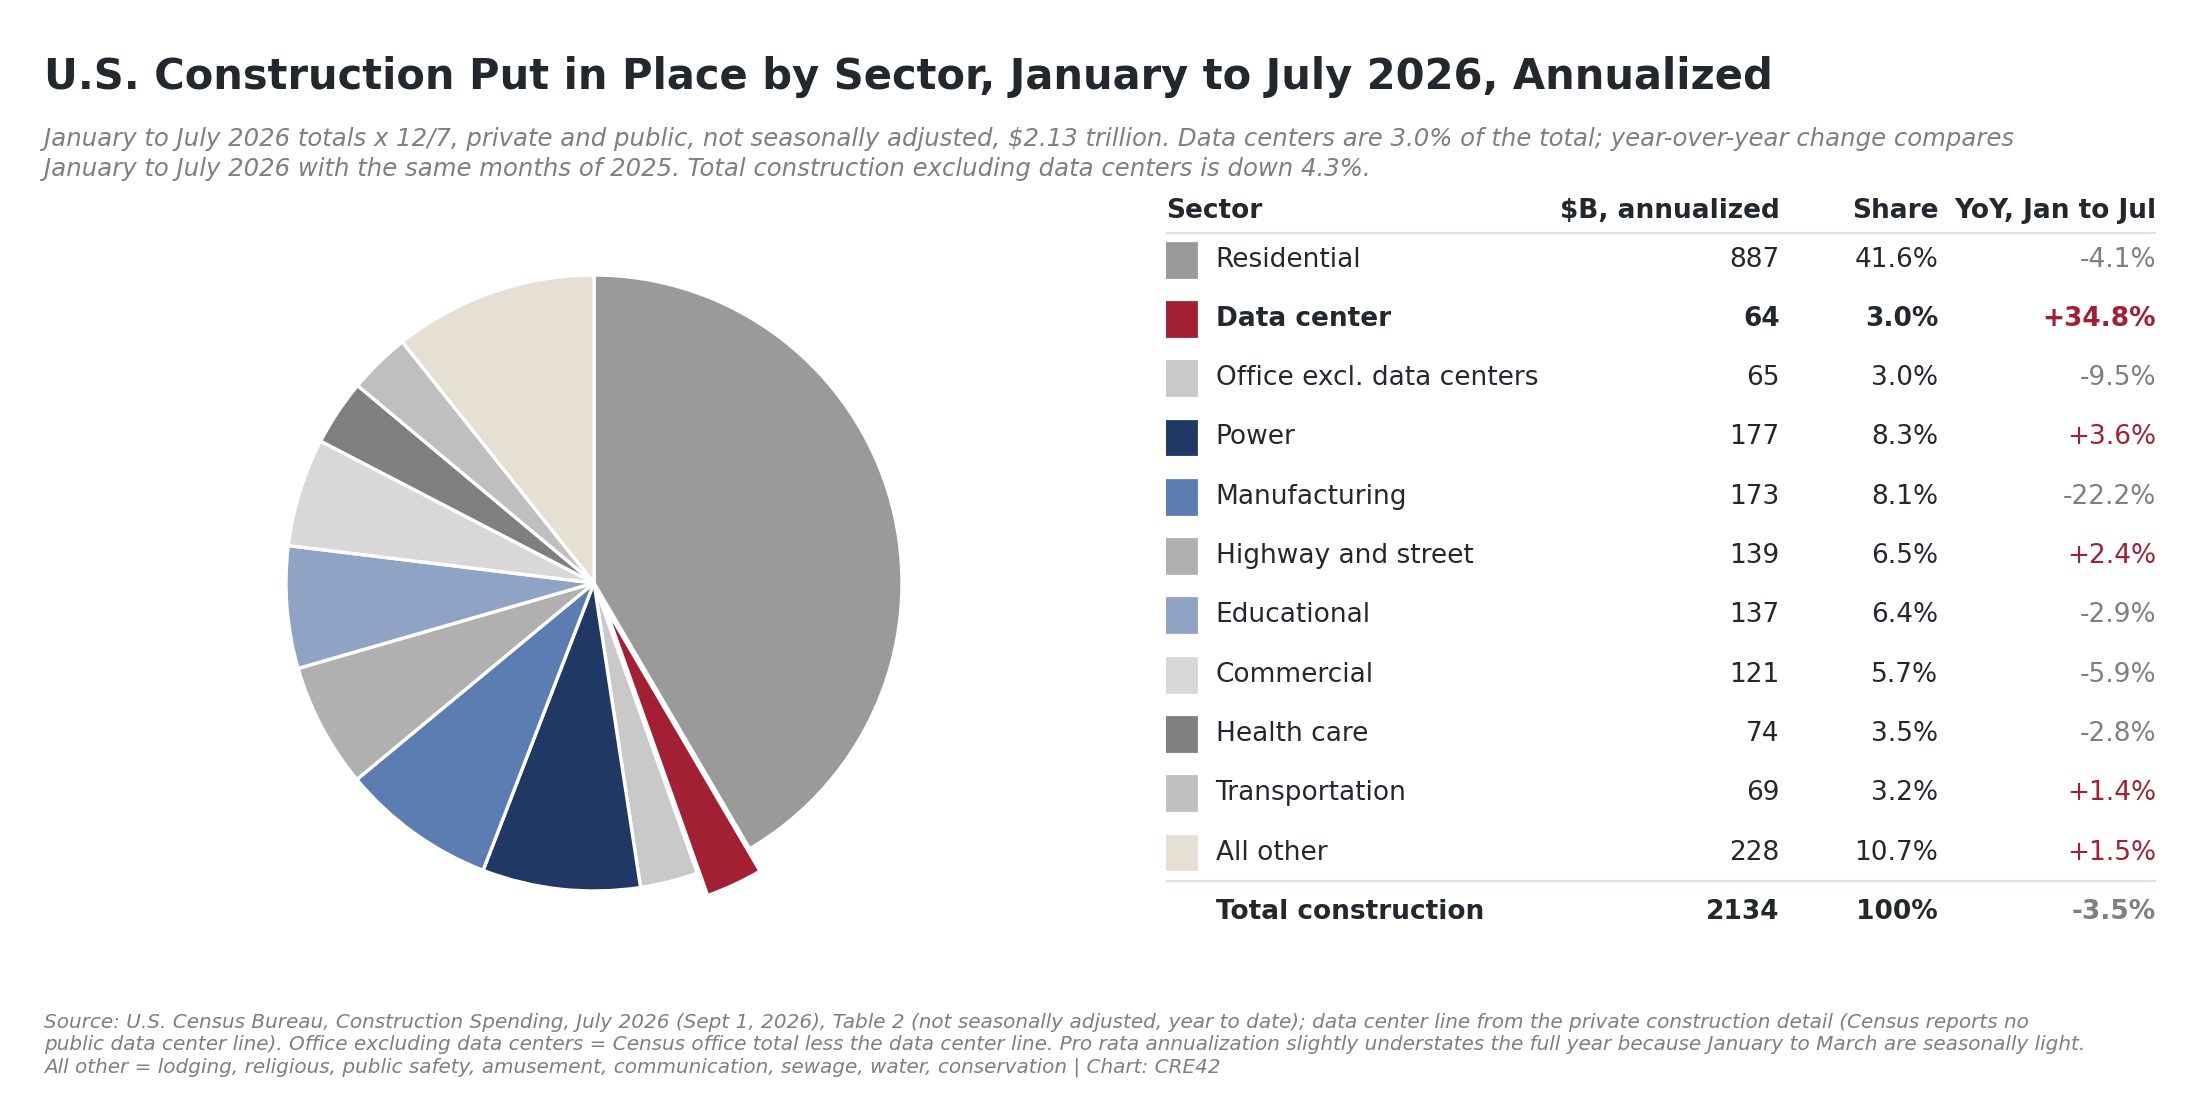
U.S. Construction Put in Place by Sector, January to July 2026, Annualized | Source: U.S. Census Bureau, Construction Spending, Table 2
- Total construction put in place, January to July 2026, is down 3.5% from the same months of 2025; excluding data centers it is down 4.3%. Residential, 42% of all construction, is down 4.1%, a decline of $22 billion over seven months ($38 billion annualized); at the July seasonally adjusted rate the residential decline is $69 billion, about the size of the entire data center line.
- Data centers are 3.0% of all construction, up from 2.1% in the same months of 2025, and the only category of size growing at a double-digit rate (+35%). The Census office total is up 8% on the year; office excluding data centers is down 9.5%.
- Manufacturing, the previous boom category, is down 22% from the same months of 2025 as the CHIPS Act plants complete. Power (+3.6%) and highway and street (+2.4%) are the other large categories growing.
What to Watch For in 2026 and Beyond
Sources to Track Data Center Construction and Capex in 2026:
| Source | Report / Series | Frequency | Notes |
|---|---|---|---|
| U.S. Census Bureau | Construction Spending (C30), data center line | Monthly, first business day | Two-month lag; latest month preliminary, prior two revised |
| Alphabet, Amazon, Meta, Microsoft | Quarterly earnings releases and calls; capex and guidance | Quarterly, late January, April, July, October | Bases differ by company; state the basis when summing |
| Alphabet, Amazon, Meta, Microsoft | 10-K geographic note on long-lived assets | Annual (February; Microsoft August) | Amazon reports by segment only |
| ConstructConnect | Data center construction starts report | Monthly | Project value at groundbreaking; industry data vendor |
| Cushman & Wakefield | Data Center Development Cost Guide | Annual | Cost per MW and cost mix, excluding chips |
[1] Alphabet ($195–205 billion), Amazon (about $220 billion cash capex), Meta ($130–145 billion including finance lease principal) and Microsoft (about $175 billion, calendar 2026) Q2 2026 earnings releases and calls, July 2026. Bases differ; the total is quoted as a range. Alphabet’s CFO: about 60% of Q2 capex was servers; Microsoft: about two-thirds of the quarter’s capex was short-lived assets. The Alphabet guidance figure is taken from a third-party transcript of the July 2026 call. ↩
[2] ConstructConnect, September 2026 Data Center Report: $84.1 billion of starts (136 projects) January to July 2026, $144 billion annualized (x 12/7); $29.2 billion in calendar 2025. The value attached to a start is ConstructConnect’s estimate of the total dollar value of the construction work (labor, materials, overhead, interest and taxes during construction, contractor’s profit), counted in full in the month the project reaches the start stage; it is not the amount spent that month. constructconnect-help.atlassian.net Starts are project value at groundbreaking. ConstructConnect is an industry data vendor, used here as the source of record for starts because no government series reports them. constructconnect.com ↩
[3] U.S. Census Bureau, Construction Spending (C30), value of private construction put in place, data center category, September 1, 2026 release. July 2026 is preliminary. Series backfilled to January 2014; broken out from office in mid-2024. census.gov ↩
[4] Purchases of property and equipment from the 10-K cash flow statements of Alphabet, Amazon and Meta (FY2020–FY2025; Meta includes finance lease principal; Amazon gross) and additions to property and equipment for Microsoft (FY2021–FY2026, June fiscal years assigned to the calendar year they begin). 2026 is the midpoint of each company’s guidance, and the 2026 bar is a forecast, not a reported figure. ↩
[5] Cushman & Wakefield, Data Center Development Cost Guide 2026: all-in greenfield development cost of $8.9 million to $23.3 million per MW excluding chips and GPUs; greenfield cost mix of power infrastructure 21%, core and shell 17%, contingency 16%, cooling 12%, owner-furnished items 8%, IT/network infrastructure 7%, land 7%, other 6%, design 3%, escalation 3%. cushmanwakefield.com ↩
[6] McKinsey & Company, “The cost of compute: A $7 trillion race to scale data centers” (April 2025): of $5.2 trillion in AI data center investment to 2030, about 15% to land, materials and site, 25% to power, cooling and electrical, 60% to chips and hardware. Company statements per note 1. mckinsey.com ↩
[7] Construction figures: U.S. Census Bureau, Construction Spending, July 2026 (September 1, 2026), Tables 1 and 2; annualized figures are January to July not seasonally adjusted totals multiplied by 12/7, which slightly understates the full year because the winter months are seasonally light. Hyperscaler capex is the midpoint of Alphabet, Amazon, Meta and Microsoft 2026 guidance. Business income ($7.2 trillion: corporate profits after tax without IVA and CCAdj plus proprietors’ and rental income, BEA NIPA, Q1 2026 SAAR), nominal GDP ($31.85 trillion, Federal Reserve Z.1 basis) and U.S. net wealth ($166.7 trillion, Z.1 Table B.1, Q1 2026) are as published on the CRE42 U.S. National Balance Sheet page. ↩
[8] Long-lived assets by geographic area: Alphabet 10-K FY2025 (Note 15; property and equipment plus operating lease assets); Meta 10-K FY2025 (geographic information); Microsoft 10-K FY2026 (segment note; by controlling statutory company, excluding financial and tax assets). Amazon 10-K FY2025 reports property and equipment by segment only. ↩
Companion workbook. data-centers-measuring-components.xlsx: Census put in place series, hyperscaler capex 2020–2026, cost distribution model, 10-K geographic asset tables, HS 8471 imports by country (workbook only), a Scale Context tab (construction against the economy and by sector), and a Sources tab.
Sources
- U.S. Census Bureau, Construction Spending (C30), Value of Private Construction Put in Place, September 1, 2026 release. census.gov
- U.S. Census Bureau, Construction Spending, July 2026 release (September 1, 2026), Tables 1 and 2: total, private and public construction by type. census.gov
- CRE42, U.S. National Balance Sheet (business income, GDP and net wealth denominators; BEA NIPA and Federal Reserve Z.1). inflation-debt-balance-sheet.html
- Alphabet, Amazon, Meta and Microsoft, Forms 10-K, fiscal 2020 through 2026, and Q2 2026 earnings releases and calls.
- ConstructConnect, September 2026 Data Center Report. constructconnect.com
- Cushman & Wakefield, Data Center Development Cost Guide 2026. cushmanwakefield.com
- McKinsey & Company, The Cost of Compute: A $7 Trillion Race to Scale Data Centers (April 2025). mckinsey.com
Methodology & Data Notes
Annualization. Unless labeled otherwise, 2026 construction figures on this page are January to July totals (not seasonally adjusted) multiplied by 12/7. This pro rata convention is used for data center construction put in place ($37.2 billion, $64 billion annualized), ConstructConnect starts ($84.1 billion, $144 billion annualized) and total U.S. construction ($1,244.6 billion, $2,134 billion annualized). It differs from the Census seasonally adjusted annual rate (SAAR), which expresses one month’s seasonally adjusted pace as a full year ($75.2 billion for data centers in July 2026). The pro rata figure understates a full year slightly when January to March are seasonally light months, and it lags the SAAR when the pace is rising within the year. Hyperscaler capex is calendar 2026 guidance and needs no annualization.
Construction put in place. The Census Bureau’s monthly estimate of the dollar value of construction work done on site during the month: shell, structure, and the building’s electrical and mechanical systems. It excludes land, IT equipment, and off-site utility generation and transmission (which fall in the separate power category). The seasonally adjusted annual rate (SAAR) removes normal seasonal swings and expresses one month’s pace as a full year; it is not a cumulative total. Calendar totals on this page sum the not-seasonally-adjusted monthly values. Data centers are classified as a sub-type of office.
Hyperscaler capex. Purchases of property and equipment from each company’s cash flow statement. Meta includes principal payments on finance leases, matching its own reported capex; Microsoft’s June fiscal years are assigned to the calendar year in which they begin; Amazon is gross of proceeds and incentives. 2026 is the midpoint of guidance from the July 2026 earnings calls. Capex is global and includes chips, servers, land, leases and capitalized software, so the construction share is indicative rather than an accounting identity.
Cost distribution. The building side applies Cushman & Wakefield’s 2026 greenfield cost mix to $20 billion per GW, the upper part of its $8.9 million to $23.3 million per MW range, appropriate for AI-class density and 2N redundancy; C&W’s figure excludes chips and GPUs. The IT hardware layer assumes hardware is 60% of the all-in total (McKinsey; Alphabet), giving $20 billion divided by 0.4, or $50 billion, with $30 billion of hardware. Microsoft’s two-thirds would imply $40 billion of hardware and a $60 billion total. As a physical cross-check, 1 GW of IT load supports roughly 700,000 to 800,000 accelerators at 1.2 to 1.4 kW each all-in; at $30,000 to $40,000 per accelerator that is $21 billion to $32 billion in chips before servers, memory and networking. Published bounds run from about $30 billion per GW (Epoch AI, 2025) to $60–80 billion (NVIDIA, 2025). The figures are representative, not a quotation for any project.
Long-lived assets by geography. Alphabet and Meta report property and equipment plus operating lease assets by location; Microsoft reports long-lived assets excluding financial and tax assets by the location of the controlling statutory company. Because these are stocks of everything built to date, the U.S. share of the latest year’s increase is the closer proxy for where current capital spending is landing. Amazon discloses property and equipment by segment only.
Third-party sources. ConstructConnect (construction starts) is an industry data vendor rather than a government series and is used as the source of record for starts because no public series exists; it is cited with its own URL.