
Comparing MSA Fiscal Outlooks
Metro Fiscal Scorecard
Ratings are as of August 2026 [2]; balance-sheet figures are from each city’s fiscal 2025 Annual Comprehensive Financial Report (fiscal years ending between April and December 2025), the most recent audited numbers that exist. [1] The table beneath the chart carries every column, links each city to its rating source, and gives the PDF page of each statement the figures came from. [3]
Pensions and Healthcare
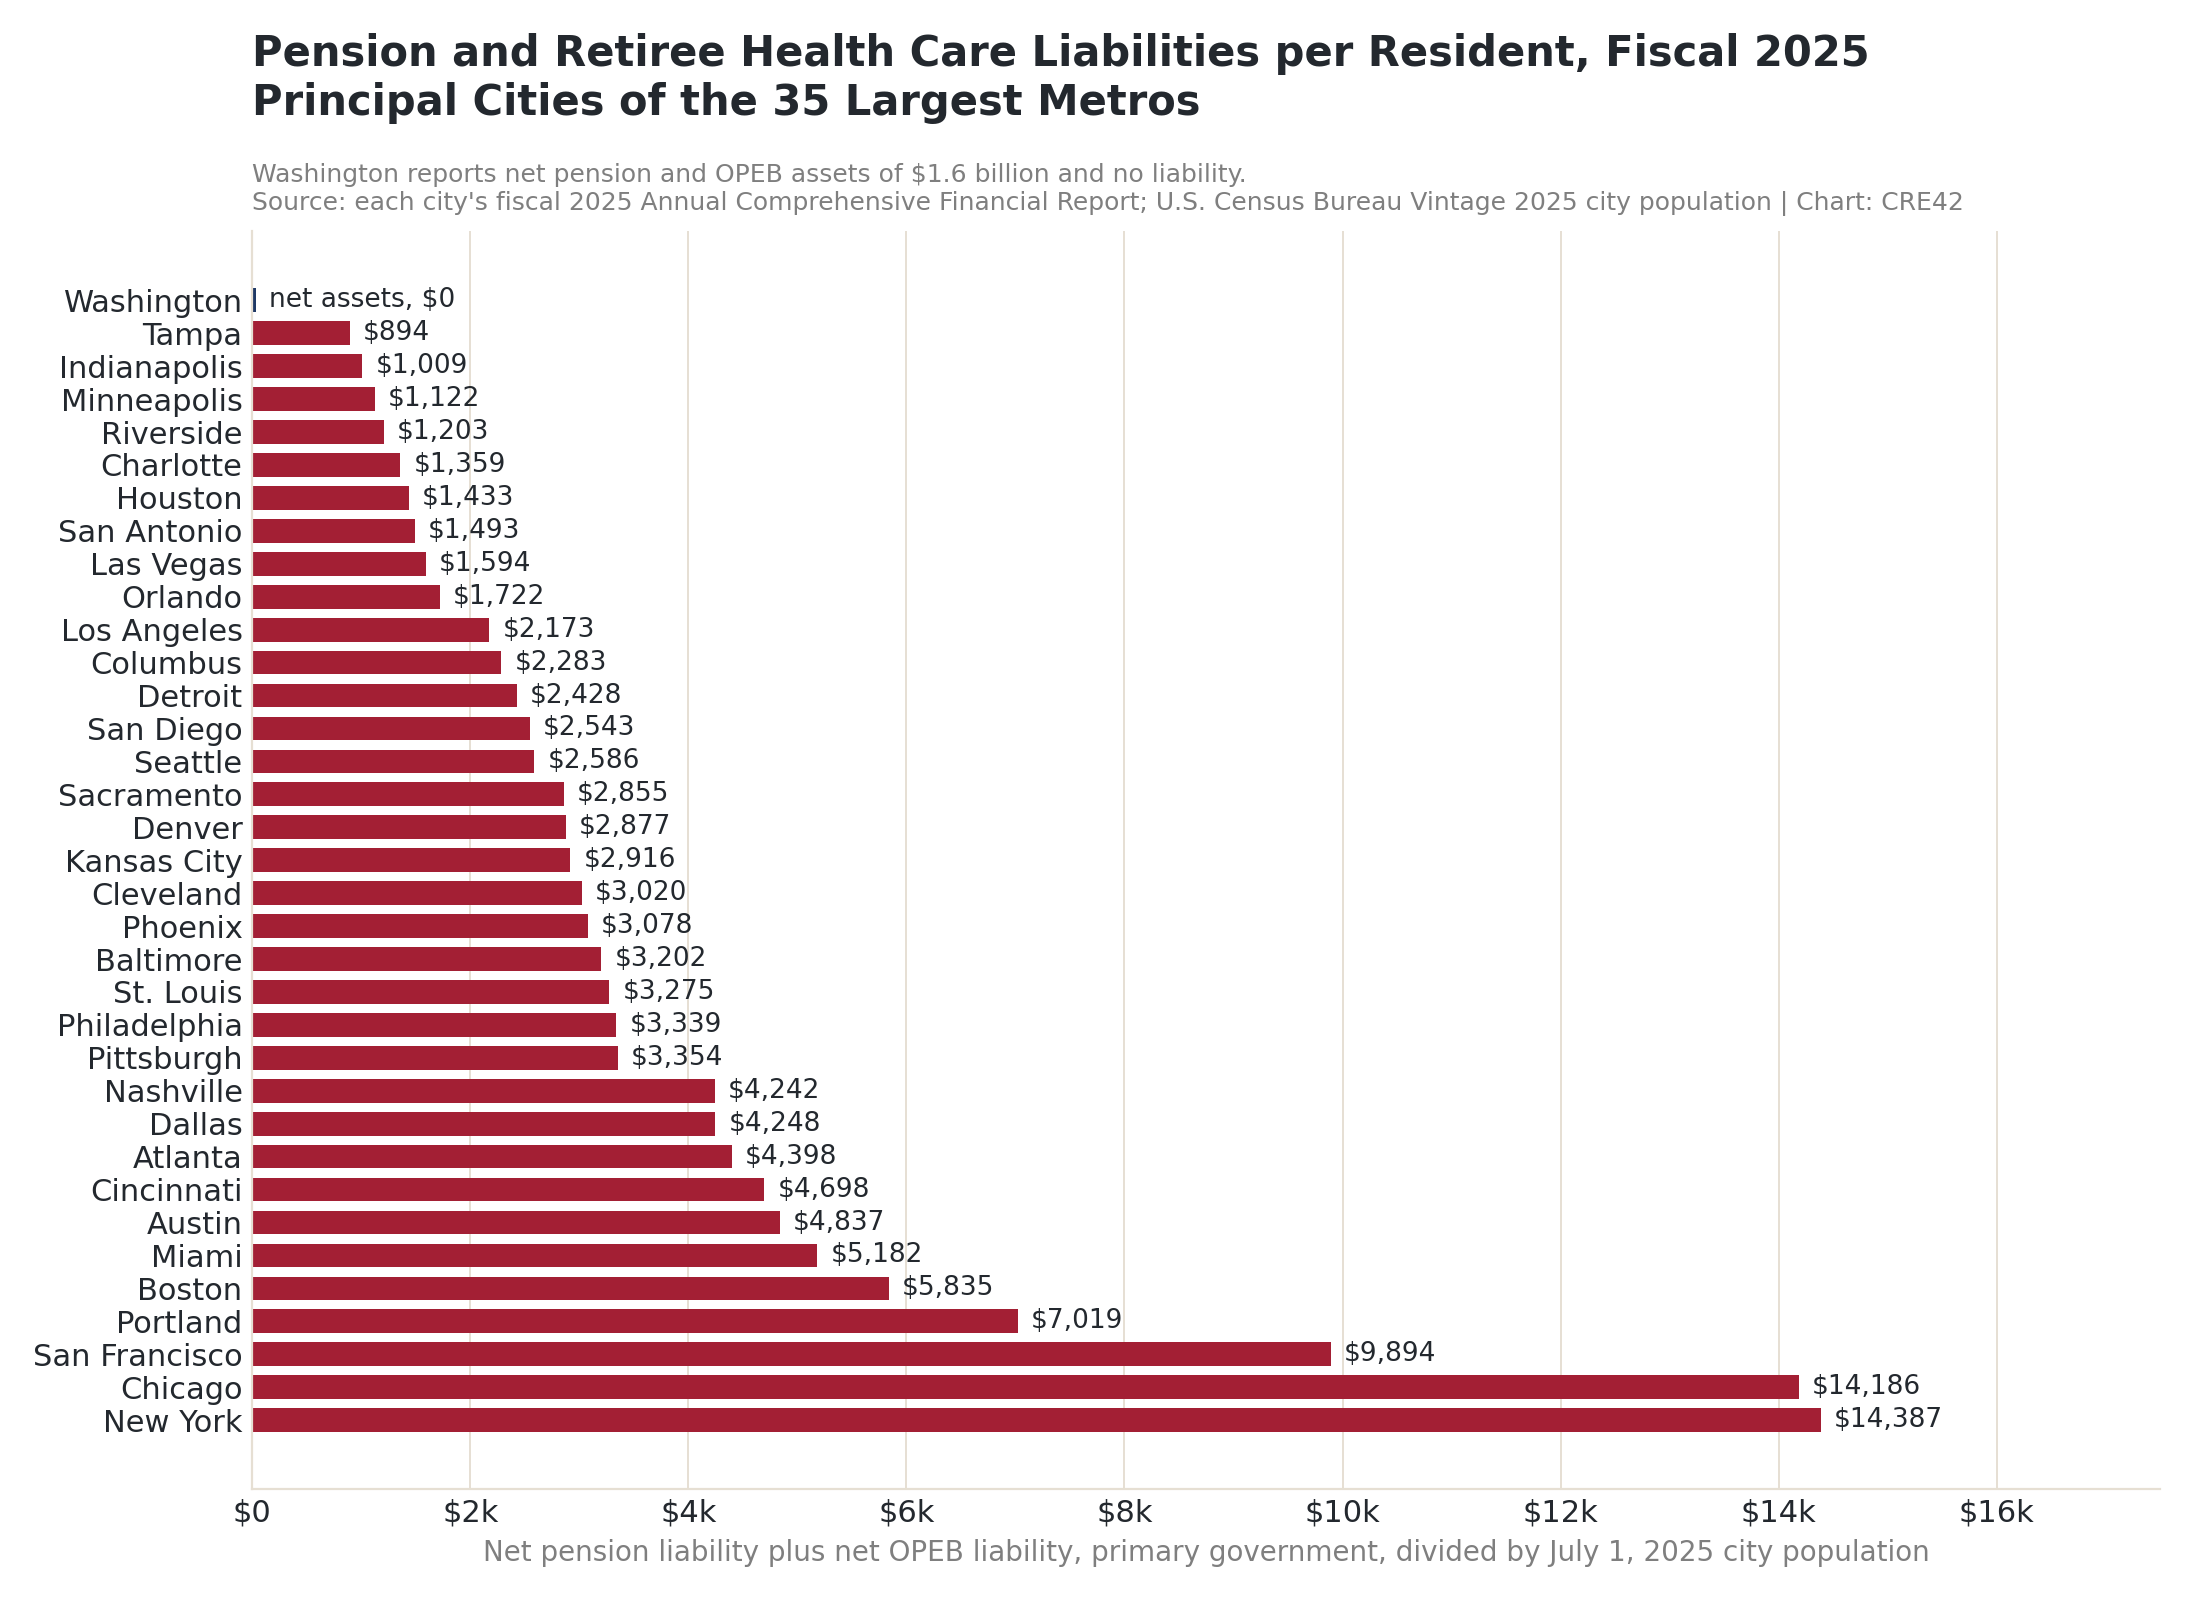
Net Pension Liability plus Net OPEB Liability per Resident, Fiscal 2025 | Source: city fiscal 2025 ACFRs; U.S. Census Bureau Vintage 2025 city population | Chart: CRE42
City Credit Ratings
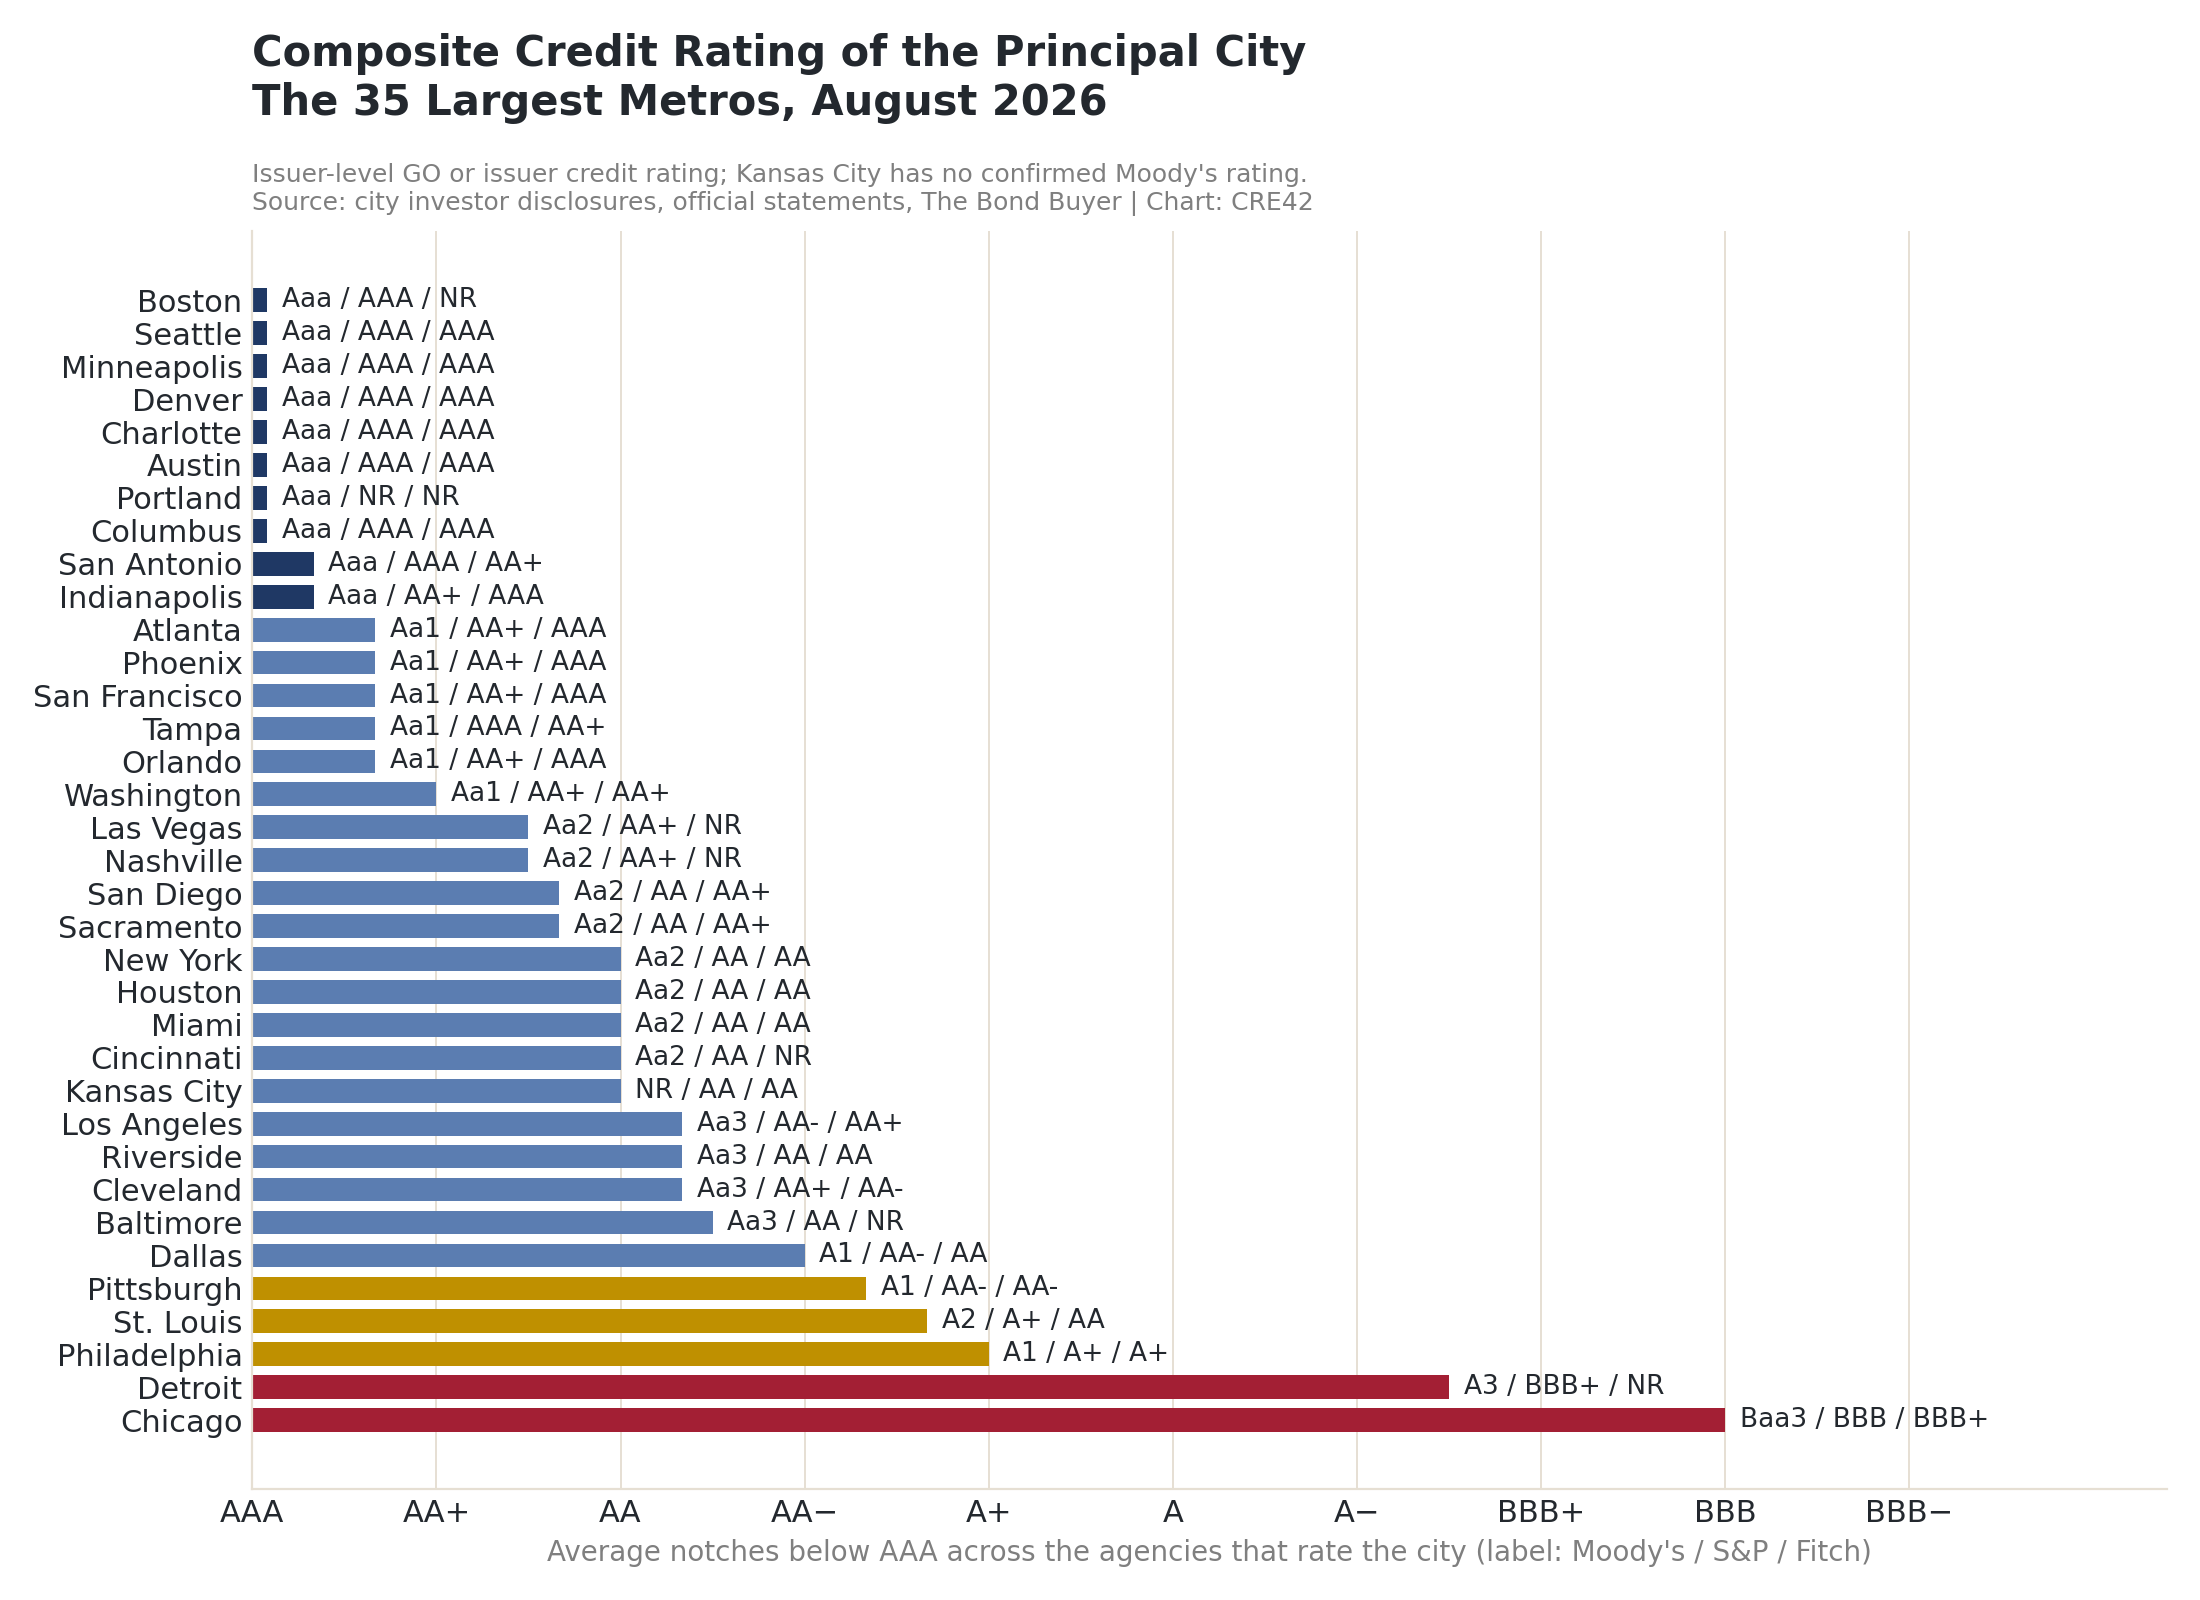
Composite Credit Rating: Average Notches Below AAA Across Moody’s, S&P and Fitch | Source: city investor disclosures, official statements and The Bond Buyer, August 2026 | Chart: CRE42
Agency Ratings vs. Balance Sheets
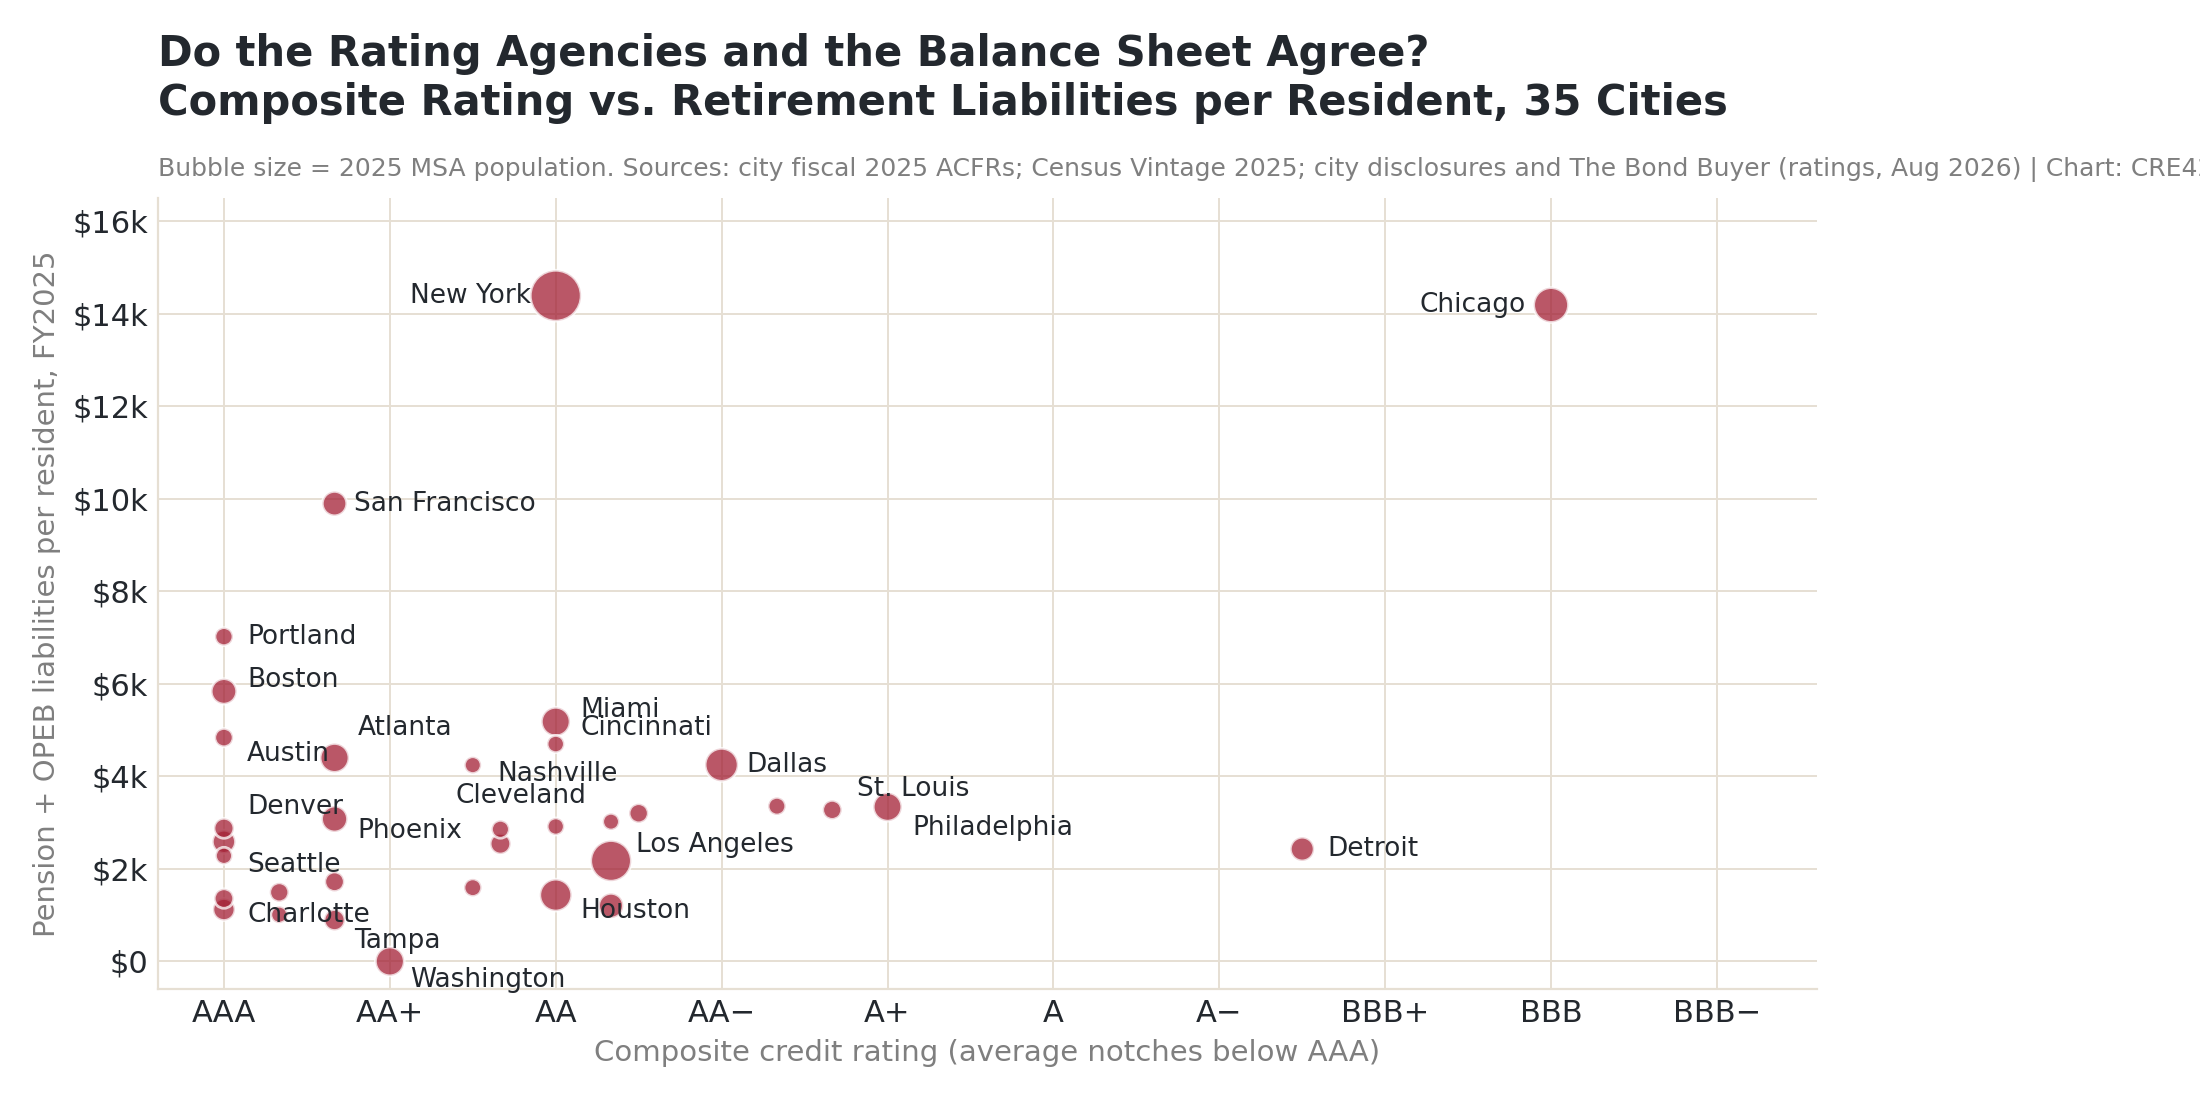
Composite Rating vs. Pension + OPEB Liabilities per Resident, 35 Cities, Bubble Size = 2025 MSA Population | Sources: city fiscal 2025 ACFRs; Census Vintage 2025; city disclosures and The Bond Buyer (August 2026) | Chart: CRE42
Key Observations
What to Watch For in 2026 and Beyond
Sources to Track State & Local Fiscal Health in 2026:
| Source | Report or Series | Frequency | Notes |
|---|---|---|---|
| City ACFRs (via EMMA or city finance sites) | Fiscal 2026 Annual Comprehensive Financial Reports: Statement of Net Position, Governmental Funds statements | Annual (December 2026 to June 2027 for fiscal 2026) | Refresh the pension, OPEB and General Fund reserve figures once the fiscal 2026 audits post |
| MSRB EMMA | Issuer pages: ratings, official statements, continuing-disclosure rating-change notices | Continuous | Free; official statements and continuing disclosures for every issuer (note: EMMA carries Fitch and KBRA ratings on individual securities; Moody’s and S&P ratings are on the agencies’ own sites and the cities’ investor pages) |
| The Bond Buyer | Rating-action coverage for large issuers | Daily | Fastest public record of upgrades, downgrades and outlook changes |
| U.S. Treasury | State and Local Fiscal Recovery Funds (ARPA) recipient reporting | Quarterly; program ends December 31, 2026 | One-time federal money must be spent by year-end 2026; cities that used it for recurring costs face a gap in fiscal 2027 budgets |
| U.S. Census Bureau | Annual Survey of State and Local Government Finances | Annual (about two years after the fiscal year) | Revenue mix and property-tax dependence by government unit; the primary source behind any revenue-side extension of this page |
| Lincoln Institute of Land Policy | 50-State Property Tax Comparison Study | Annual | Effective tax rates on commercial, industrial and apartment property for the largest city in each state; the direct link from city finances to CRE operating costs |
Notes
[1] Balance-sheet measures are taken directly from each city’s fiscal 2025 Annual Comprehensive Financial Report (ACFR), the audited financial statements every city publishes four to seven months after its fiscal year ends; fiscal years end April 30 (Kansas City), June 30 (most cities), September 30 (Austin, Dallas, Miami, Orlando, San Antonio, Tampa, Washington) or December 31 (Chicago, Cleveland, Columbus, Denver, Indianapolis, Minneapolis, Pittsburgh, Seattle) 2025. The liability measure is the net pension liability plus the net OPEB liability (or total OPEB liability where the retiree health plan is unfunded) of the primary government, from the government-wide Statement of Net Position or, where that statement folds them into long-term liabilities, from the long-term liabilities note; it is not netted against pension or OPEB assets, and component units are excluded. It is divided by the Census Bureau’s July 1, 2025 city population. The explorer also carries a secondary reserve measure, the committed, assigned and unassigned General Fund balance (the rating agencies’ “available” definition) divided by General Fund expenditures, both from the Governmental Funds statements; it is a snapshot of spendable cash rather than a structural measure and is read alongside the liability figure, not on its own. The PDF page of each statement is in the explorer table; the verbatim lines are on the companion workbook’s ACFR Source Lines tab. Truth in Accounting’s fiscal 2023 “taxpayer burden” was considered for this page and dropped as too dated; it remains on a reference tab in the workbook. ↩
[2] Ratings are the issuer-level general obligation rating (unlimited-tax GO where the city issues it) from Moody’s, S&P Global and Fitch, as of August 26, 2026, taken from each city’s investor-relations page, its most recent official statement, or its own press release, with The Bond Buyer used where the agency report is paywalled. Where a city has no GO debt (Tampa, Orlando, Riverside, San Diego), the issuer credit rating is used; where Fitch rates California GO bonds above the issuer on a statutory lien (Los Angeles, San Francisco is unaffected at AAA), the Issuer Default Rating is used. Composite = average notches below AAA across the agencies that rate the city (Aa1 = AA+ = 1, and so on). Baltimore, Sacramento and Pittsburgh ratings are from the cities’ own finance pages (Baltimore shows no outlooks or dates); Kansas City’s S&P and Fitch ratings, the Miami outlooks and the Cleveland Fitch outlook come from an unverified summary and are flagged; Kansas City’s Moody’s rating is not confirmed and is left blank; Riverside’s issuer ratings (Aa3/AA/AA, all stable) were confirmed from the city’s investor page on August 27, 2026 (agency reports dated July 2025 for Moody’s, September 2024 for S&P and Fitch). Flags appear in the explorer table. ↩
[3] Universe: the 35 metropolitan statistical areas above 2 million residents in the Census Bureau’s Vintage 2025 estimates, the same set used on the domestic migration pages. Metros do not have budgets, so the fiscal unit is the largest principal city of each: the District of Columbia for Washington, the consolidated city-county for Indianapolis and Nashville, and the City and County for San Francisco and Denver. Overlapping counties, school districts and transit authorities are not included; a city that runs its own schools (Boston) therefore carries obligations that a city in a separate school district (Phoenix) does not. ↩
Companion workbook. demographics-msa-fiscal-outlook.xlsx: Sources tab, Scorecard (formulas), Rating Scale, Ratings Detail (per-city ratings, outlooks, dates, actions and source URLs) and ACFR FY2025 (per-city fiscal 2025 pension, OPEB, net position and General Fund figures with PDF page references), ACFR Source Lines (verbatim statement lines), City Population, and a TIA Reference tab that is not used on the page.
Sources
1. Annual Comprehensive Financial Reports, fiscal 2025, for the 35 principal cities, issued by each city’s finance department, comptroller or controller (December 2025 to June 2026). Government-wide Statement of Net Position; Governmental Funds Balance Sheet; Statement of Revenues, Expenditures and Changes in Fund Balances; long-term liabilities notes. Per-city PDF page references in the explorer table; the reports are on file in the CRE42 base-data folder and are available from each city’s investor-relations page or from EMMA under continuing disclosures.
2. U.S. Census Bureau. Vintage 2025 Subcounty Population Estimates: Incorporated Places of 20,000 or More (May 2026). census.gov/popest/2020s-total-cities-and-towns
3. City investor-relations pages, official statements and press releases for each of the 35 cities (per-city URLs in the explorer table and the workbook’s Ratings Detail tab), with rating-action coverage from The Bond Buyer (2024–2026). Rating definitions: Moody’s; S&P Global; Fitch.
4. U.S. Census Bureau. Vintage 2025 Metropolitan Statistical Area Population Estimates (March 2026). census.gov/metro-micro/tables
5. Government Finance Officers Association. Fund Balance Guidelines for the General Fund (best practice; two months of operating expenditures). gfoa.org/materials/fund-balance-guidelines-for-the-general-fund
6. Municipal Securities Rulemaking Board. EMMA (issuer ratings and disclosures). emma.msrb.org
Methodology & Data Notes
Scope and What Is Deliberately Left Out
This page uses two headline measures on purpose. Credit ratings are current, free to verify and already blend economy, governance, reserves and liabilities; the liability measure isolates the long-term promises on a comparable basis from audited statements. General Fund reserves were considered as a third headline measure and demoted to the explorer: the General Fund is a different share of each city’s operations (Boston’s includes the schools, New York’s excludes its reserve funds by charter), and the balance is a snapshot that swings with one-time money (St. Louis’s 92% reflects settlement and federal-aid cash parked in the General Fund; Riverside’s 67% is a committed contingency), so it is a useful secondary read, not a ranking. An unassigned-only version was dropped entirely because it mostly measures labeling policy (Portland classifies all of its reserve as committed and shows zero). Pension funded ratios, revenue mix, property-tax dependence on office values, transit-agency finances and the expiry of federal pandemic aid are all real drivers of city fiscal health and are listed under What to Watch For; each would need its own primary-source pull and is left for a later page. Muni bond yields and spreads, the market’s real-time verdict, were also considered and deferred: spreads to the AAA benchmark are subscription data, and the free substitutes (EMMA trade prints, Bond Buyer new-issue pricing) are not yet comparable across 35 cities.
Balance-Sheet Measures
Liabilities: net pension liability plus net OPEB liability of the primary government (governmental plus business-type activities), as reported on the government-wide Statement of Net Position or, for cities that aggregate them into long-term liabilities (Chicago, Dallas, Nashville, St. Louis, Tampa, Denver, San Antonio, Indianapolis, Sacramento), in the long-term liabilities note. Columbus reports pension and OPEB as one combined line by activity; its totals are from the pension and OPEB notes. Pay-as-you-go retiree health plans report a “total OPEB liability”, which is used as reported. Pension and OPEB assets are not netted against liabilities. Fifteen cities report such assets; for all but one they are under 10% of the liability (Seattle 14%, Cincinnati 9%, Nashville 7%, Baltimore 7%, Los Angeles 6%, the rest under 4%), so netting would move no city more than a place or two in the ranking. The exception is Washington (net assets of $1.6 billion and no liability), shown at zero; a netted figure would be about $2,300 per resident in the District’s favor. The companion workbook carries the netted figure as a reference column. Divided by the July 1, 2025 city population; Indianapolis and Nashville use the consolidated-government “balance” population. Reserves: committed plus assigned plus unassigned General Fund balance divided by General Fund expenditures, both from the Governmental Funds statements; nonspendable and restricted balances are excluded. This is the definition the rating agencies use for “available” fund balance. The two-month (16.7%) and one-month (8.3%) markers follow the GFOA best-practice minimum. New York’s reserves are held outside the General Fund by charter (Revenue Stabilization Fund, Retiree Health Benefits Trust) and are not captured.
Extraction and Verification
The 35 ACFR PDFs were converted to text and the three statements located by heading; for four reports whose statement pages use fonts without a text layer (Atlanta, Austin, San Antonio, Portland) the pages were OCRed. Every figure was checked by column footing (assets equal liabilities plus deferred inflows plus net position; fund-balance components sum to the printed total; revenues less expenditures plus other financing sources reconcile to the change in fund balance) and against the MD&A condensed tables. The PDF page of each statement is recorded in the explorer table and the workbook, and the verbatim lines are on the workbook’s ACFR Source Lines tab.
Composite Rating
Each agency’s long-term scale is mapped to notches below AAA (Aaa/AAA = 0, Aa1/AA+ = 1, Aa2/AA = 2, Aa3/AA− = 3, A1/A+ = 4, A2/A = 5, A3/A− = 6, Baa1/BBB+ = 7, Baa2/BBB = 8, Baa3/BBB− = 9). The composite is the plain average over the agencies that rate the city; a city rated by one agency (Portland) or two (Boston, Detroit, Las Vegas, Cincinnati, Nashville) is averaged over those only. The weakest single rating is also carried in the workbook. Outlooks are recorded but not scored.
Vintages and Known Gaps
Ratings are as of August 26, 2026. Balance-sheet figures are fiscal 2025 (fiscal years ending April 30 to December 31, 2025). All 35 cities now carry ratings; Kansas City’s Moody’s rating is not confirmed (blank), and the Kansas City S&P/Fitch ratings, Miami outlooks and Cleveland Fitch outlook come from an unverified summary; Riverside’s issuer ratings and outlooks were confirmed from the city’s investor page on August 27, 2026. All gaps are flagged in the explorer table and the workbook.