Stabilized CAGR, Q1 2016 – Q2 2026
| Metric | Whole company | Per stab. share |
|---|---|---|
| NOI (PNOI) | 12.2% | 6.6% |
| EBITDAre | 13.0% | 7.3% |
| FFO | 15.3% | 9.5% |
| AFFO | 17.2% | 11.3% |

| Metric | Whole company | Per stab. share |
|---|---|---|
| NOI (PNOI) | 12.2% | 6.6% |
| EBITDAre | 13.0% | 7.3% |
| FFO | 15.3% | 9.5% |
| AFFO | 17.2% | 11.3% |
| TTM | Q3 25 | Q4 25 | Q1 26 | Q2 26 | |
|---|---|---|---|---|---|
| AFFO / STAB MKT CAP | 4.0% | 4.5% | 4.6% | 4.5% | 4.1% |
| FFO / STAB MKT CAP | 4.9% | 5.8% | 5.7% | 5.4% | 5.0% |
| EBITDAre / STAB TEV | 4.5% | 5.2% | 5.1% | 4.9% | 4.6% |
| NOI / STAB TEV | 4.7% | 5.4% | 5.3% | 5.2% | 4.8% |
| 2016 | 2017 | 2018 | 2019 | 2020 | 2021 | 2022 | 2023 | 2024 | 2025 | 2026 ann. | |
|---|---|---|---|---|---|---|---|---|---|---|---|
| NOI (PNOI) | $6.02 | $6.19 | $6.49 | $6.84 | $7.20 | $7.73 | $9.03 | $9.83 | $10.33 | $10.81 | $11.30 |
| EBITDAre | $5.64 | $5.75 | $6.12 | $6.36 | $6.80 | $7.30 | $8.60 | $9.55 | $9.93 | $10.36 | $10.79 |
| FFO | $4.42 | $4.62 | $5.05 | $5.37 | $5.86 | $6.44 | $7.62 | $8.41 | $9.06 | $9.70 | $10.07 |
| AFFO | $3.30 | $3.41 | $3.56 | $3.93 | $4.66 | $4.89 | $6.04 | $6.51 | $7.12 | $7.55 | $8.39 |
| CFO | $4.68 | $4.94 | $5.01 | $5.63 | $5.44 | $6.71 | $8.07 | $8.05 | $9.25 | $9.83 | $12.06 |
| 2016 | 2017 | 2018 | 2019 | 2020 | 2021 | 2022 | 2023 | 2024 | 2025 | 2026 ann. | |
|---|---|---|---|---|---|---|---|---|---|---|---|
| NOI (PNOI) | 2.7% | 4.8% | 5.5% | 5.3% | 7.3% | 16.8% | 9.0% | 5.0% | 4.7% | 4.6% | |
| EBITDAre | 2.1% | 6.5% | 3.9% | 7.0% | 7.3% | 17.8% | 11.0% | 4.0% | 4.3% | 4.1% | |
| FFO | 4.6% | 9.1% | 6.4% | 9.2% | 9.8% | 18.4% | 10.3% | 7.8% | 7.0% | 3.8% | |
| AFFO | 3.4% | 4.5% | 10.4% | 18.5% | 5.0% | 23.5% | 7.7% | 9.4% | 6.1% | 11.0% | |
| CFO | 5.5% | 1.4% | 12.3% | -3.4% | 23.5% | 20.2% | -0.3% | 15.0% | 6.3% | 22.6% |
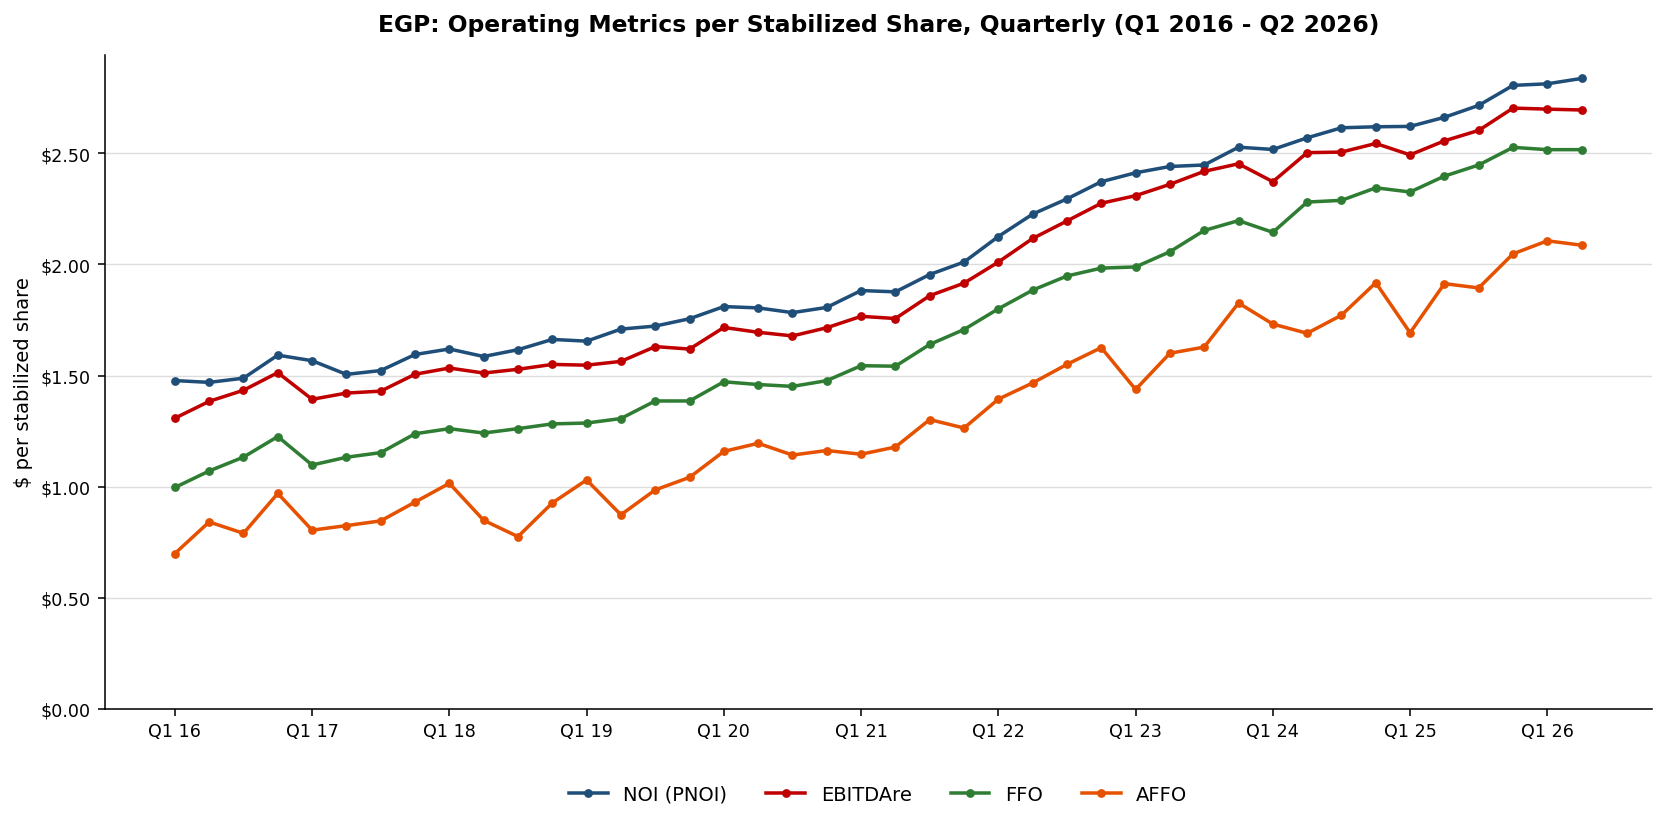
Source: EastGroup quarterly supplemental filings, Q1 2016–Q2 2026; CRE42 stabilized-share basis. Companion workbook, CHARTS STAB tab.
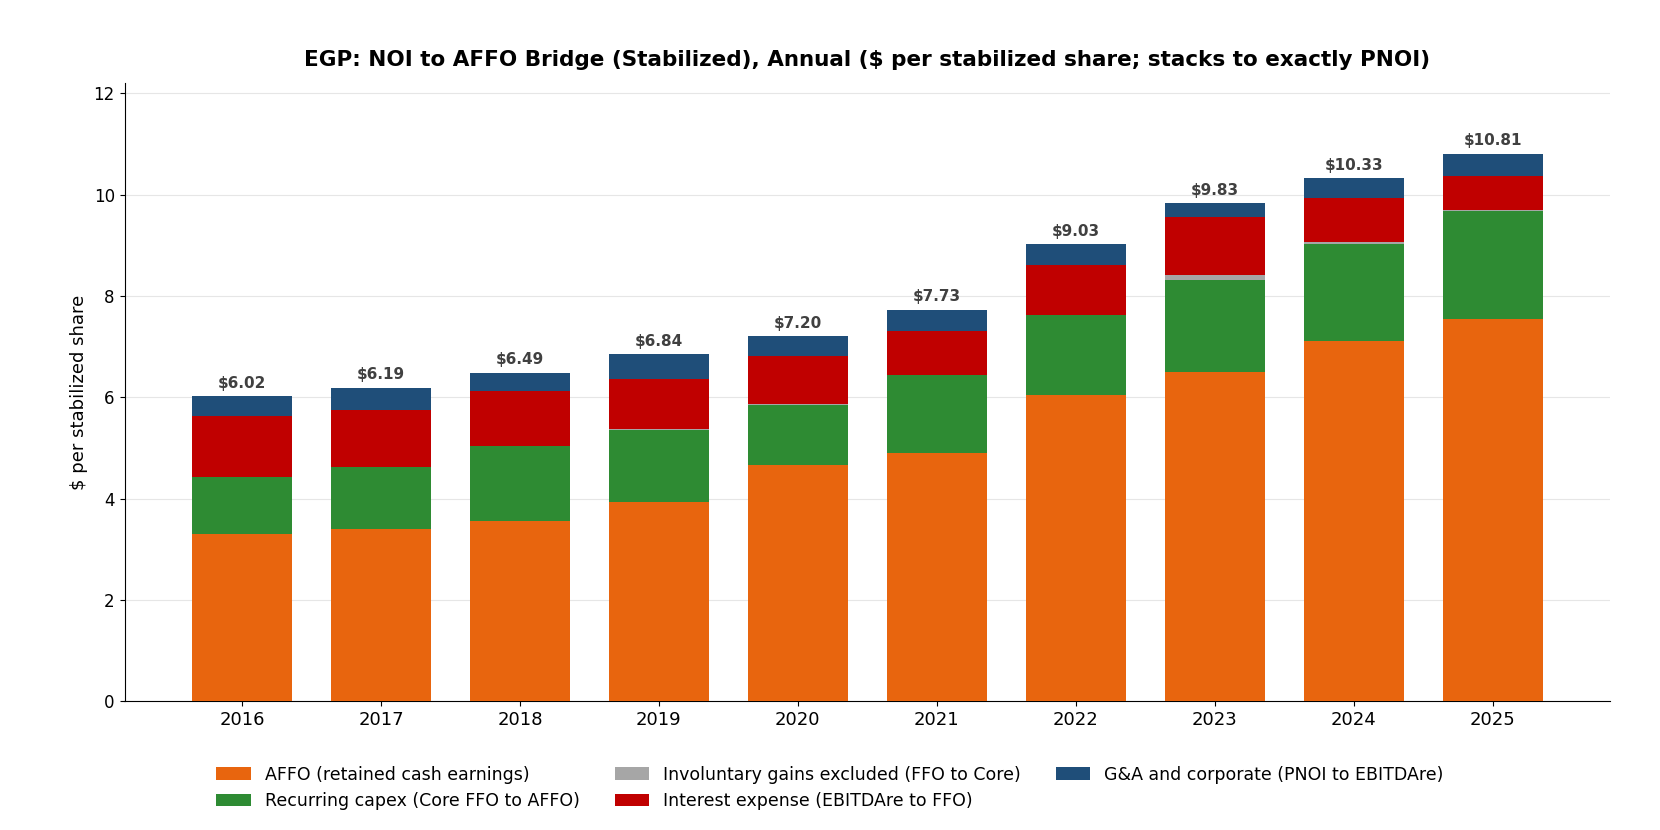
Source: Companion workbook, Quarterly Data annual block; segments are the exact differences between adjacent metrics, per stabilized share, and stack to PNOI.
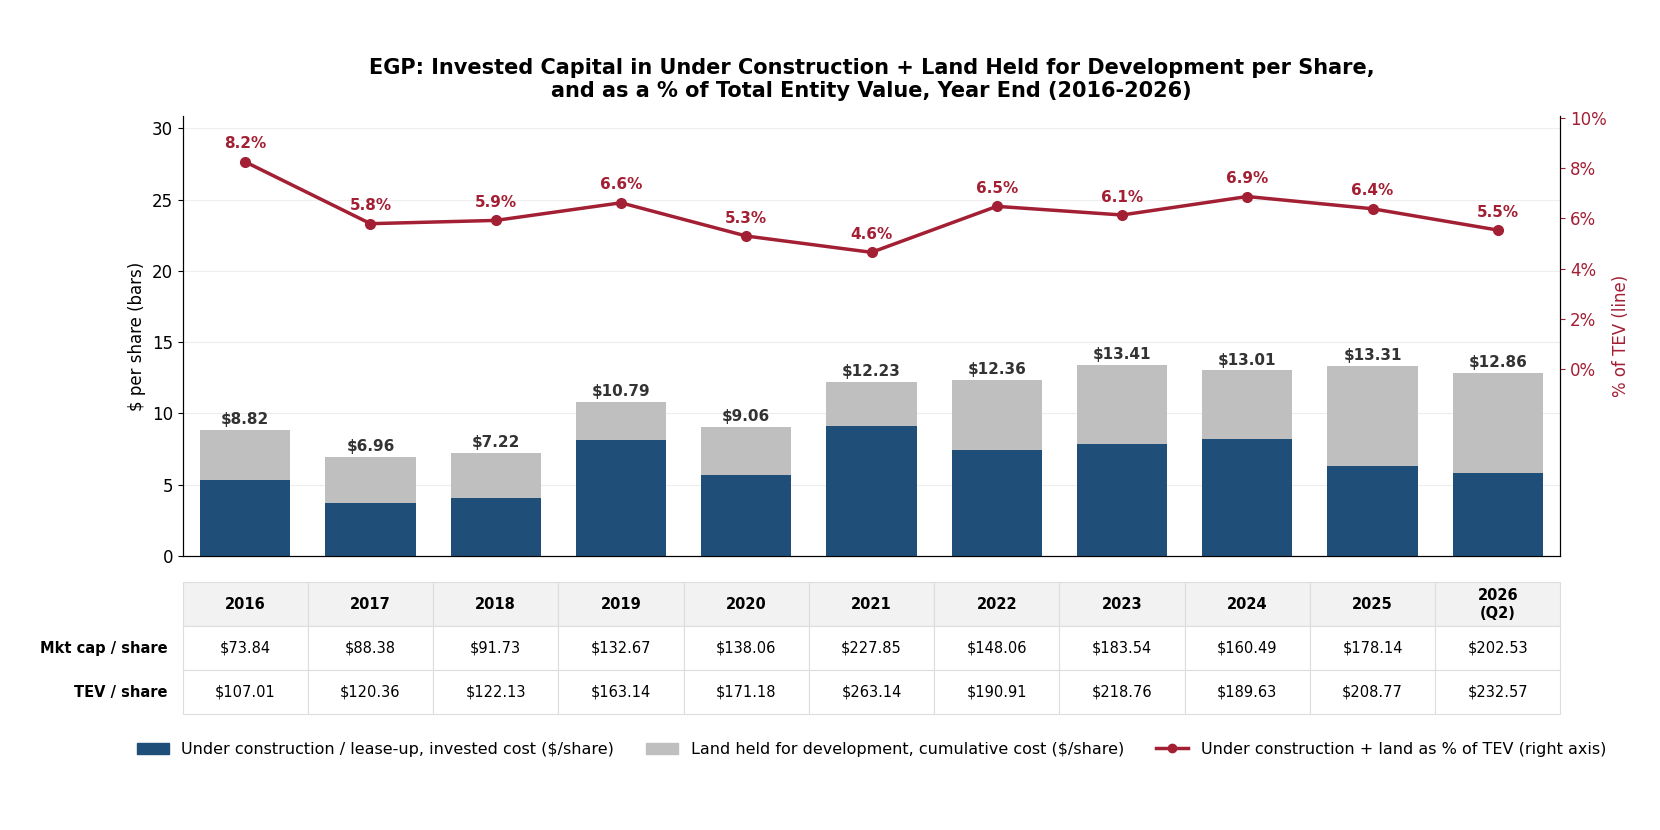
Source: EastGroup balance sheets and development pages, Q4 2016–Q2 2026; companion workbook, Quarterly Data development pipeline block (rows 141–152). Bars: the balance-sheet line "Development and value-add properties" split into projects under construction or in lease-up (invested cost) and prospective-development land (cumulative cost), per period-end share; line: the same total as a percentage of TEV. 2026 = quarter end June 2026, not annualized.[2]
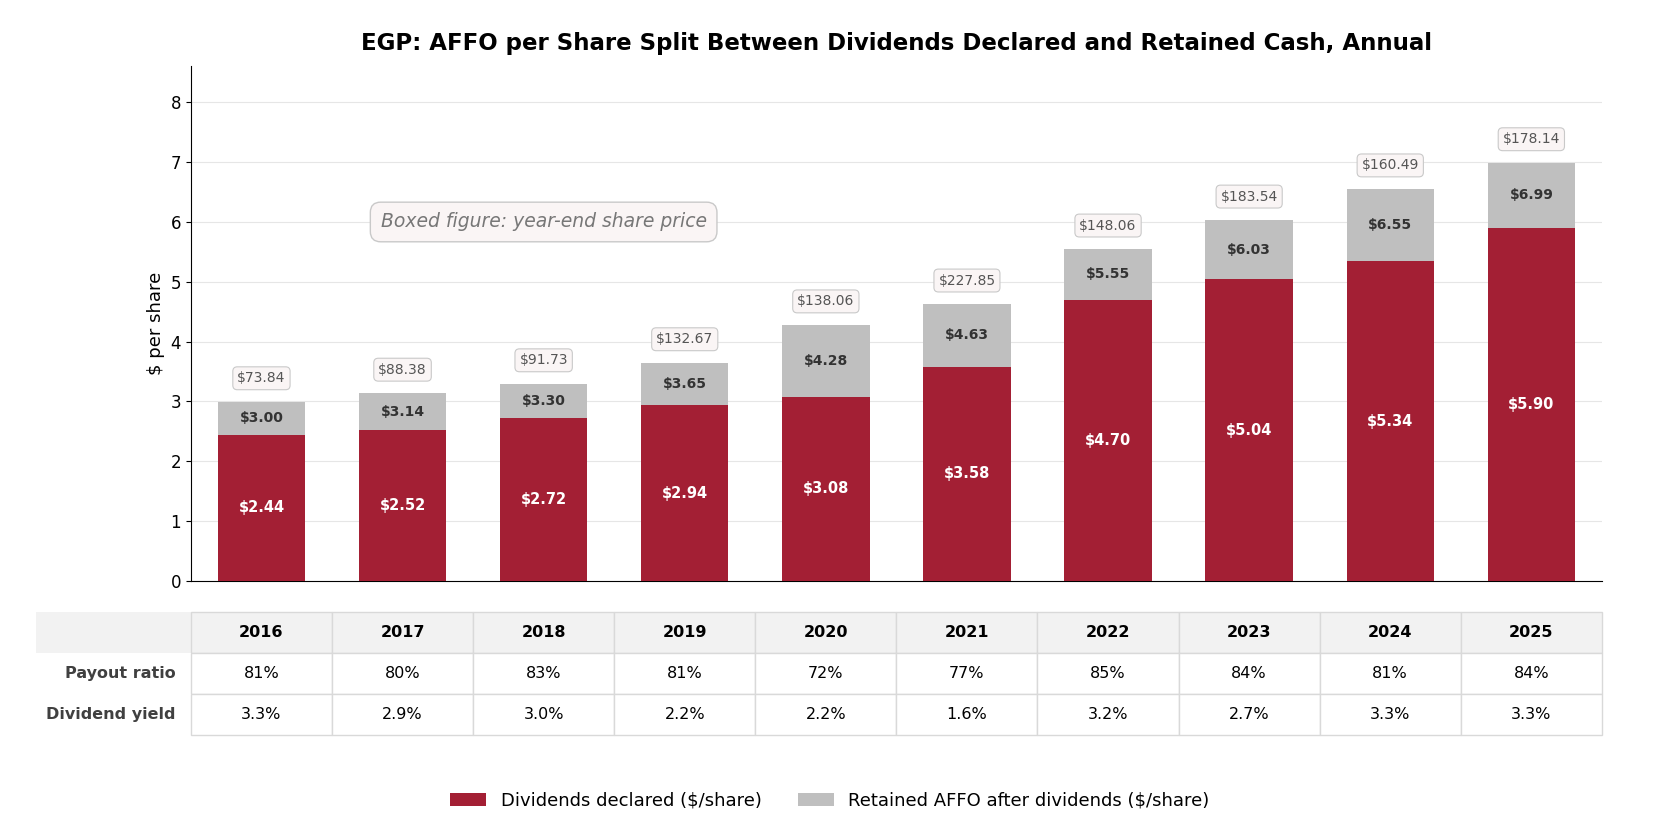
Source: EastGroup Forms 10-K and 10-Q, 2016–2025 (dividends declared); companion workbook, Quarterly Data dividend rows and annual block. AFFO per share on weighted-average diluted shares; payout ratio = dividends declared / AFFO; dividend yield = dividends declared / year-end closing price.
The chart above and the three tables below are on an as-reported basis: per-share figures use weighted-average diluted shares, and the yields use unadjusted market capitalization and total enterprise value. The tables higher up the page are on the stabilized basis[1], which deducts non-revenue-producing construction and development land from both capitalization and share counts. Same dollars, different denominator: FY2025 AFFO reads $6.99 per share here and $7.55 per stabilized share there.
| TTM | Q3 25 | Q4 25 | Q1 26 | Q2 26 | |
|---|---|---|---|---|---|
| AFFO / MKT CAP | 3.7% | 4.1% | 4.3% | 4.2% | 3.9% |
| FFO / MKT CAP | 4.6% | 5.4% | 5.3% | 5.0% | 4.7% |
| EBITDAre / TEV | 4.3% | 4.9% | 4.8% | 4.6% | 4.3% |
| NOI / TEV | 4.4% | 5.1% | 5.0% | 4.8% | 4.6% |
| 2016 | 2017 | 2018 | 2019 | 2020 | 2021 | 2022 | 2023 | 2024 | 2025 | 2026 ann. | |
|---|---|---|---|---|---|---|---|---|---|---|---|
| NOI (PNOI) | $5.48 | $5.70 | $6.00 | $6.35 | $6.62 | $7.31 | $8.29 | $9.12 | $9.51 | $10.00 | $10.54 |
| EBITDAre | $5.12 | $5.30 | $5.67 | $5.90 | $6.25 | $6.91 | $7.90 | $8.85 | $9.14 | $9.59 | $10.07 |
| FFO | $4.02 | $4.26 | $4.67 | $4.98 | $5.39 | $6.09 | $7.00 | $7.79 | $8.35 | $8.98 | $9.39 |
| AFFO | $3.00 | $3.14 | $3.30 | $3.65 | $4.28 | $4.63 | $5.55 | $6.03 | $6.55 | $6.99 | $7.82 |
| CFO | $4.26 | $4.55 | $4.64 | $5.22 | $5.00 | $6.35 | $7.41 | $7.46 | $8.52 | $9.10 | $11.25 |
| 2016 | 2017 | 2018 | 2019 | 2020 | 2021 | 2022 | 2023 | 2024 | 2025 | 2026 ann. | |
|---|---|---|---|---|---|---|---|---|---|---|---|
| NOI (PNOI) | 4.1% | 5.3% | 5.8% | 4.3% | 10.4% | 13.4% | 10.0% | 4.3% | 5.2% | 5.4% | |
| EBITDAre | 3.4% | 7.0% | 4.1% | 5.9% | 10.5% | 14.4% | 12.0% | 3.3% | 4.9% | 5.0% | |
| FFO | 6.0% | 9.7% | 6.6% | 8.2% | 13.1% | 14.9% | 11.4% | 7.1% | 7.6% | 4.6% | |
| AFFO | 4.8% | 5.0% | 10.7% | 17.3% | 8.1% | 19.8% | 8.7% | 8.6% | 6.7% | 11.9% | |
| CFO | 7.0% | 1.9% | 12.5% | -4.3% | 27.1% | 16.6% | 0.7% | 14.2% | 6.9% | 23.6% |
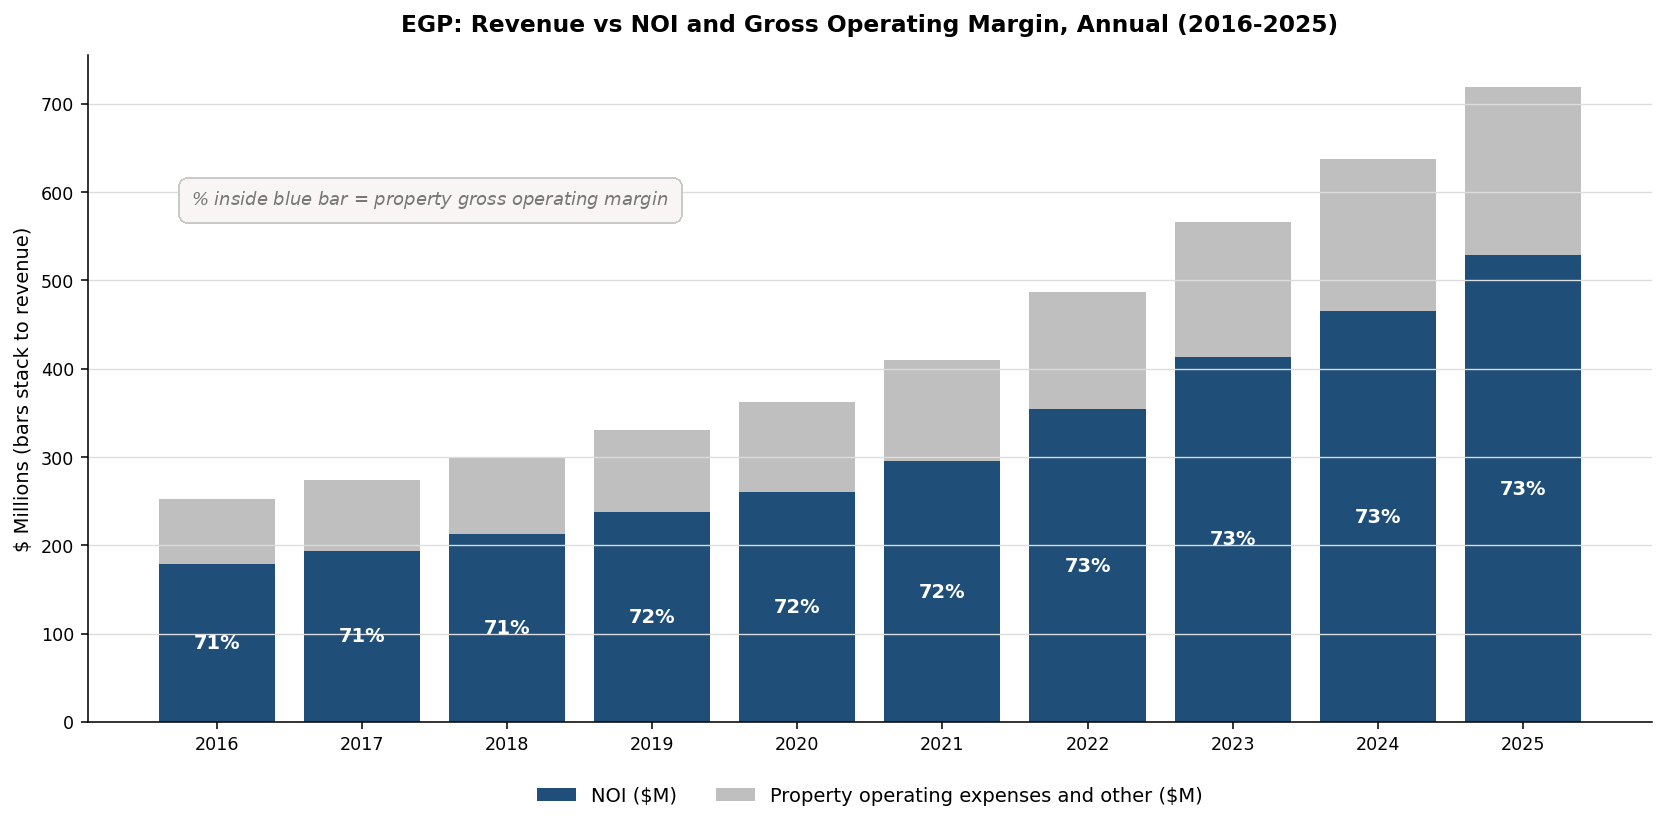
Source: EastGroup Q4 supplemental income statements, 2016–2025 (income from real estate operations, twelve-month column; cross-vintage corroborated). Margin = property NOI / income from real estate operations.
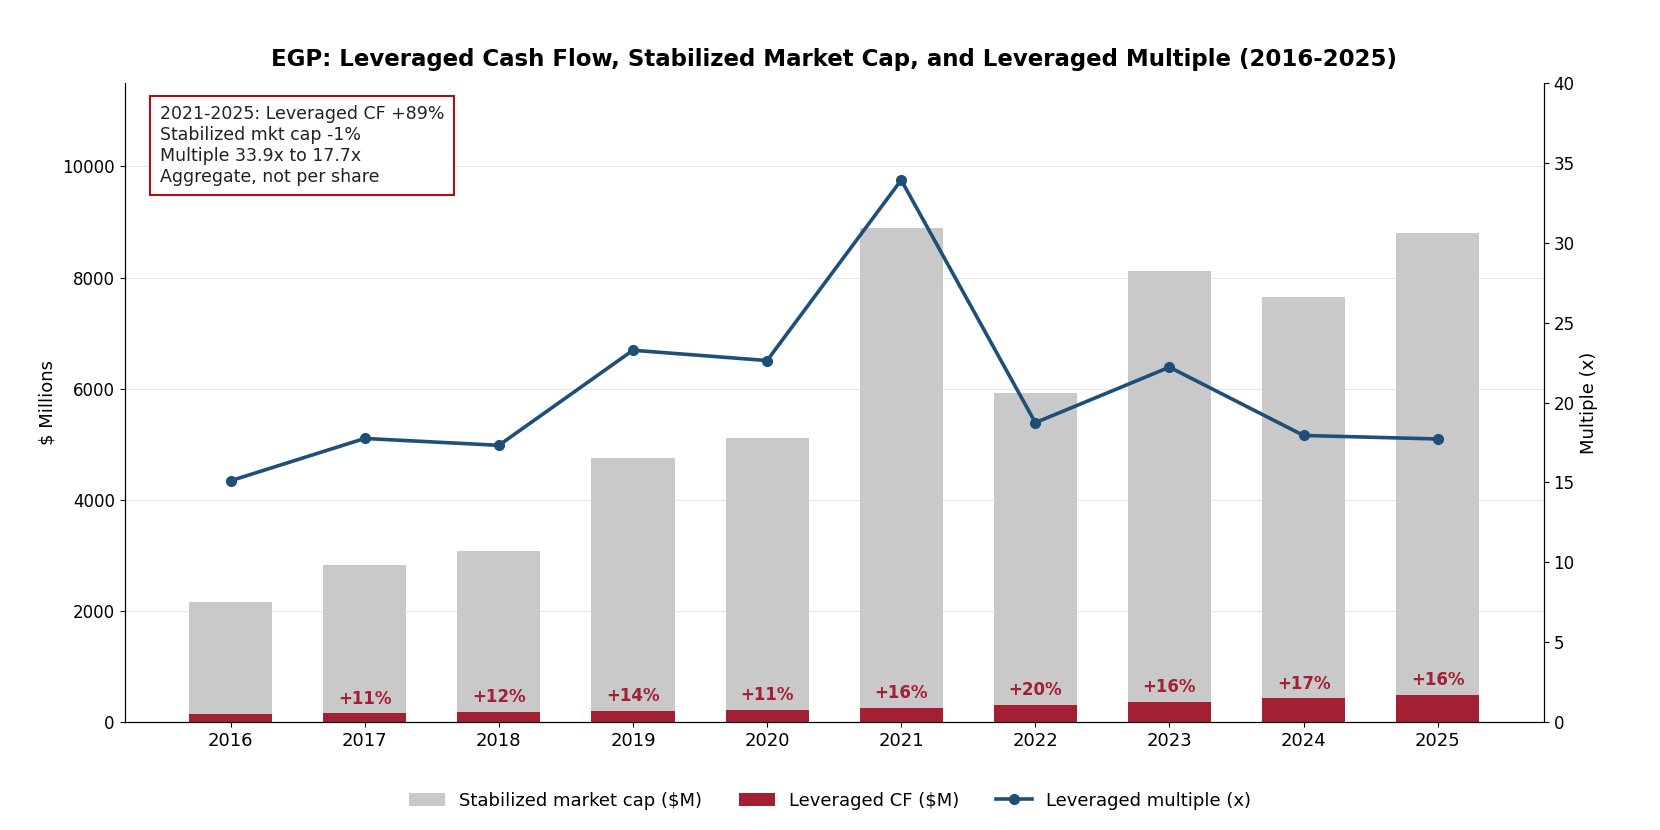
Source: Companion workbook, Quarterly Data annual block; stabilized market cap per the CRE42 method.[1] Leveraged CF = NOI less interest expense.
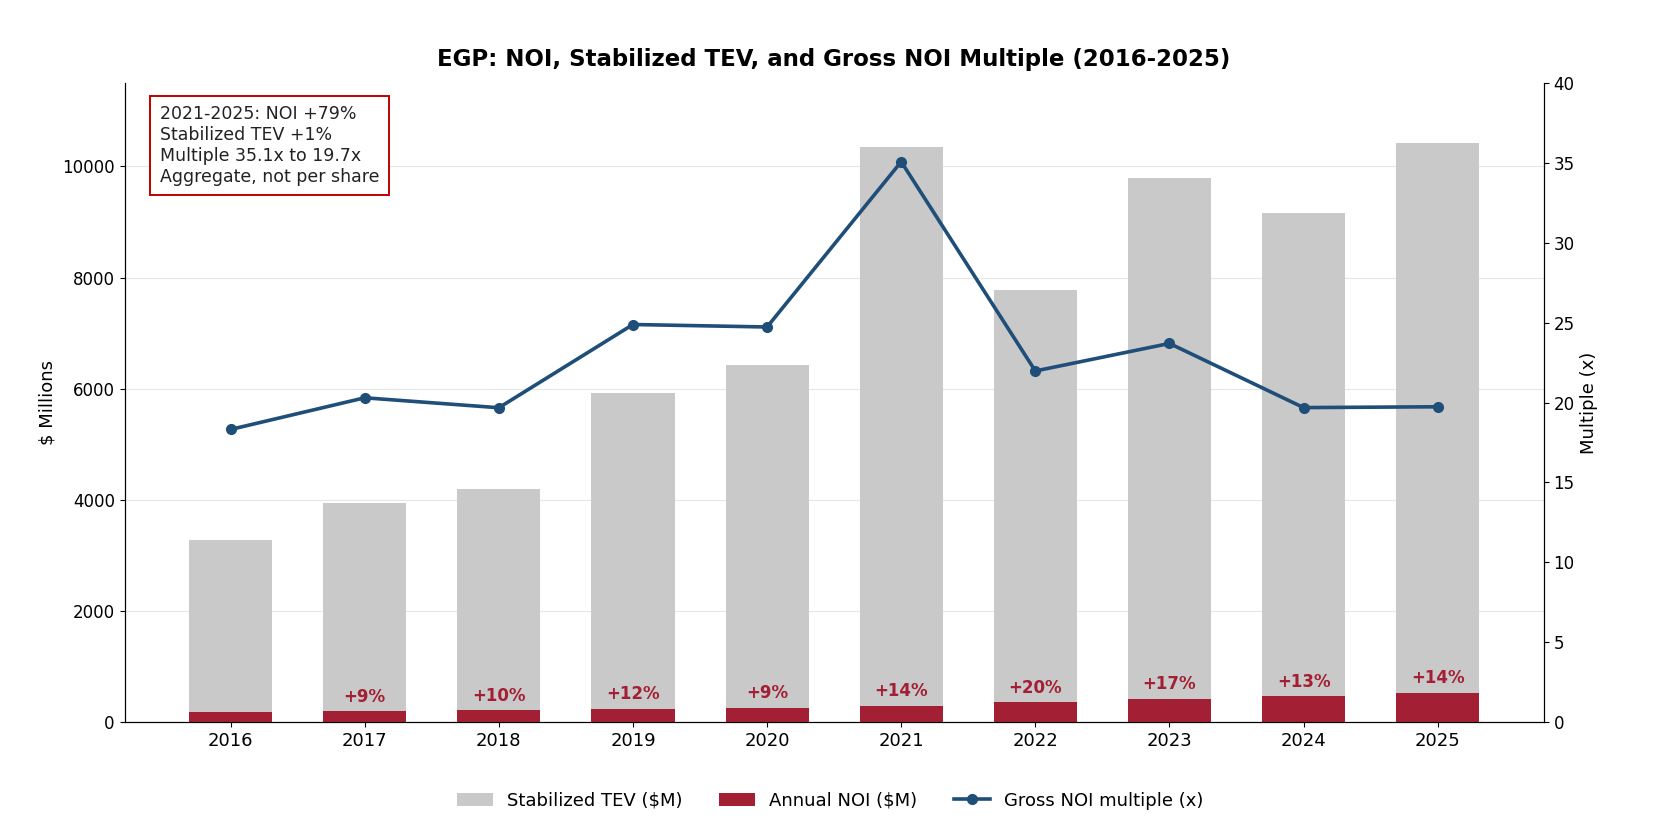
Source: Companion workbook, Quarterly Data annual block; stabilized TEV per the CRE42 method.[1]
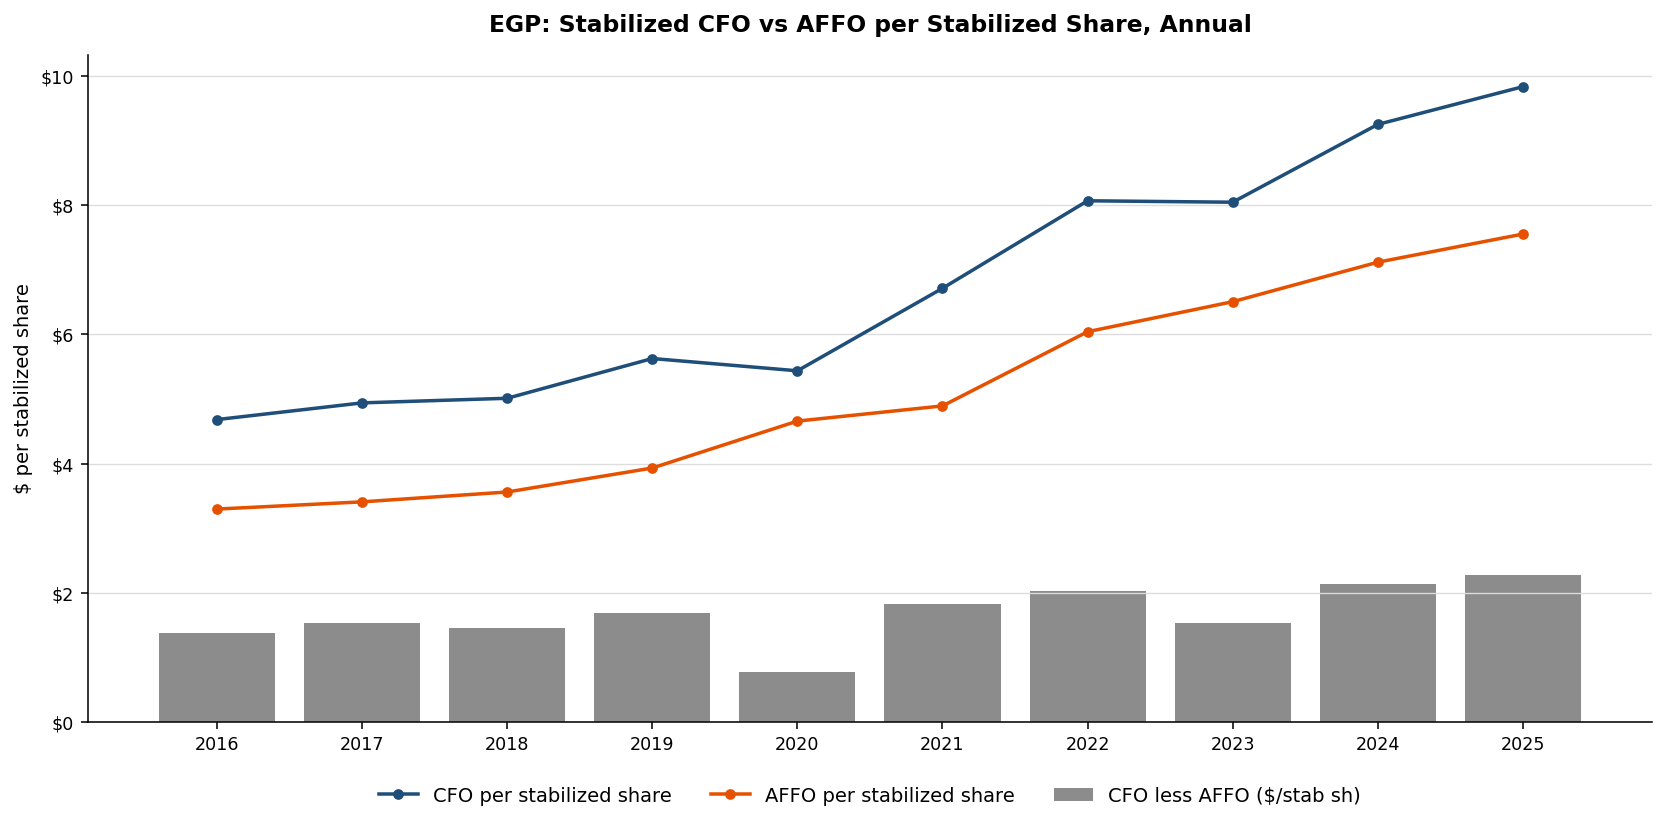
Source: Companion workbook, Quarterly Data annual block. CFO is as-reported operating cash flow; AFFO is CRE42-constructed (Core FFO less recurring capex).
[1] Stabilized basis, accounting mechanics. The stabilized adjustment removes from equity market capitalization and total enterprise value the cumulative invested cost of (a) development and value-add projects in lease-up or under construction, capitalized construction dollars not yet producing full income, and (b) prospective-development land held at cumulative cost. For EGP these two components equal the balance-sheet line "Development and value-add properties" in every quarter measured, a built-in cross-check; the figure also matches the subtraction EastGroup itself makes in its published adjusted-debt-to-EBITDAre calculation. Per-share figures deduct the share-equivalent of the same value (dev and land value divided by the quarter-end share price) from both weighted-average diluted and period-end share counts. Land under operating properties is not deducted; the adjustment isolates only capital that is not yet producing income. Method per the CRE42 REIT-section convention; full decision trail on the companion workbook Sources tab. ↩
[2] Development pipeline chart. The two bar segments together equal the "dev & land value" that the stabilized adjustment in note [1] removes from market cap and TEV; the split follows EastGroup's development page, which reports prospective-development land at cumulative cost separately from projects in lease-up or under construction. Per-share figures divide year-end balances by period-end shares outstanding, the same count used for market cap and TEV per share in the table beneath the bars, so the two segments stack exactly; the percentage of TEV does not depend on the share count. The right axis is offset so the line reads clear of the bars; its zero sits mid-plot by design.
Data. EastGroup Properties quarterly supplemental packages and Forms 10-K / 10-Q, Q1 2016 through Q2 2026. All derived figures tie to published totals in the companion workbook; every input is cited on its Sources tab. Trailing yields and multiples use trailing-twelve-month results against quarter-end June 2026 stabilized capitalization.
Companion workbook. EGP-individual-metrics.xlsx – 42-quarter per-share grid (as reported and stabilized), derivations tied to published figures, annual aggregations, and native chart tabs (CHARTS, CHARTS STAB).