Stabilized CAGR, Q1 2016 – Q2 2026
| Metric | Whole company | Per stab. share |
|---|---|---|
| NOI | 3.9% | 3.4% |
| EBITDAre | 3.5% | 3.1% |
| FFO | 3.1% | 2.6% |
| AFFO | 2.8% | 2.4% |

Definitions. NOI (Net Operating Income) = property-level rental and other income less community operating expenses. EBITDAre = Earnings Before Interest, Taxes, Depreciation and Amortization for Real Estate (Nareit definition). FFO (Funds from Operations) = net income excluding real estate depreciation and gains or losses on property sales (Nareit definition). AFFO (Adjusted Funds from Operations, cre42 definition) = Funds from Operations (FFO) less recurring capital expenditures. CFO (Cash Flow from Operations) = as-reported net cash provided by operating activities. TEV (Total Enterprise Value) = market capitalization plus total value of debt plus preferred shares and other debt-like obligations. CAGR = Compound Annual Growth Rate.
| Metric | Whole company | Per stab. share |
|---|---|---|
| NOI | 3.9% | 3.4% |
| EBITDAre | 3.5% | 3.1% |
| FFO | 3.1% | 2.6% |
| AFFO | 2.8% | 2.4% |
| TTM | Q3 25 | Q4 25 | Q1 26 | Q2 26 | |
|---|---|---|---|---|---|
| AFFO / STAB MKT CAP | 5.6% | 5.3% | 5.9% | 6.7% | 5.5% |
| FFO / STAB MKT CAP | 6.4% | 6.6% | 6.6% | 7.2% | 6.2% |
| EBITDAre / STAB TEV | 5.6% | 5.8% | 5.7% | 6.1% | 5.4% |
| NOI / STAB TEV | 6.0% | 5.8% | 6.2% | 6.8% | 6.2% |
| 2016 | 2017 | 2018 | 2019 | 2020 | 2021 | 2022 | 2023 | 2024 | 2025 | 2026 ann. | |
|---|---|---|---|---|---|---|---|---|---|---|---|
| NOI | $11.24 | $11.63 | $12.29 | $12.43 | $11.86 | $11.29 | $13.25 | $14.18 | $14.62 | $15.12 | $15.93 |
| EBITDAre | $10.34 | $10.71 | $11.45 | $11.51 | $10.76 | $10.32 | $12.05 | $12.94 | $13.49 | $14.19 | $14.13 |
| FFO | $8.99 | $9.06 | $9.49 | $9.74 | $8.97 | $8.39 | $10.09 | $10.95 | $11.49 | $12.04 | $11.74 |
| AFFO | $8.37 | $8.73 | $9.15 | $9.23 | $8.64 | $7.78 | $9.37 | $10.34 | $10.58 | $10.64 | $10.63 |
| CFO | $9.05 | $9.75 | $10.13 | $10.05 | $9.22 | $8.89 | $10.60 | $11.68 | $11.80 | $12.36 | $11.92 |
| 2016 | 2017 | 2018 | 2019 | 2020 | 2021 | 2022 | 2023 | 2024 | 2025 | 2026 ann. | |
|---|---|---|---|---|---|---|---|---|---|---|---|
| NOI | 3.5% | 5.7% | 1.2% | -4.6% | -4.8% | 17.4% | 7.0% | 3.1% | 3.4% | 5.4% | |
| EBITDAre | 3.6% | 6.9% | 0.5% | -6.5% | -4.1% | 16.9% | 7.3% | 4.3% | 5.2% | -0.4% | |
| FFO | 0.8% | 4.7% | 2.7% | -7.9% | -6.5% | 20.3% | 8.5% | 4.9% | 4.8% | -2.5% | |
| AFFO | 4.2% | 4.8% | 0.9% | -6.4% | -10.0% | 20.6% | 10.3% | 2.4% | 0.6% | -0.1% | |
| CFO | 7.7% | 3.9% | -0.7% | -8.3% | -3.6% | 19.3% | 10.2% | 1.1% | 4.7% | -3.5% |
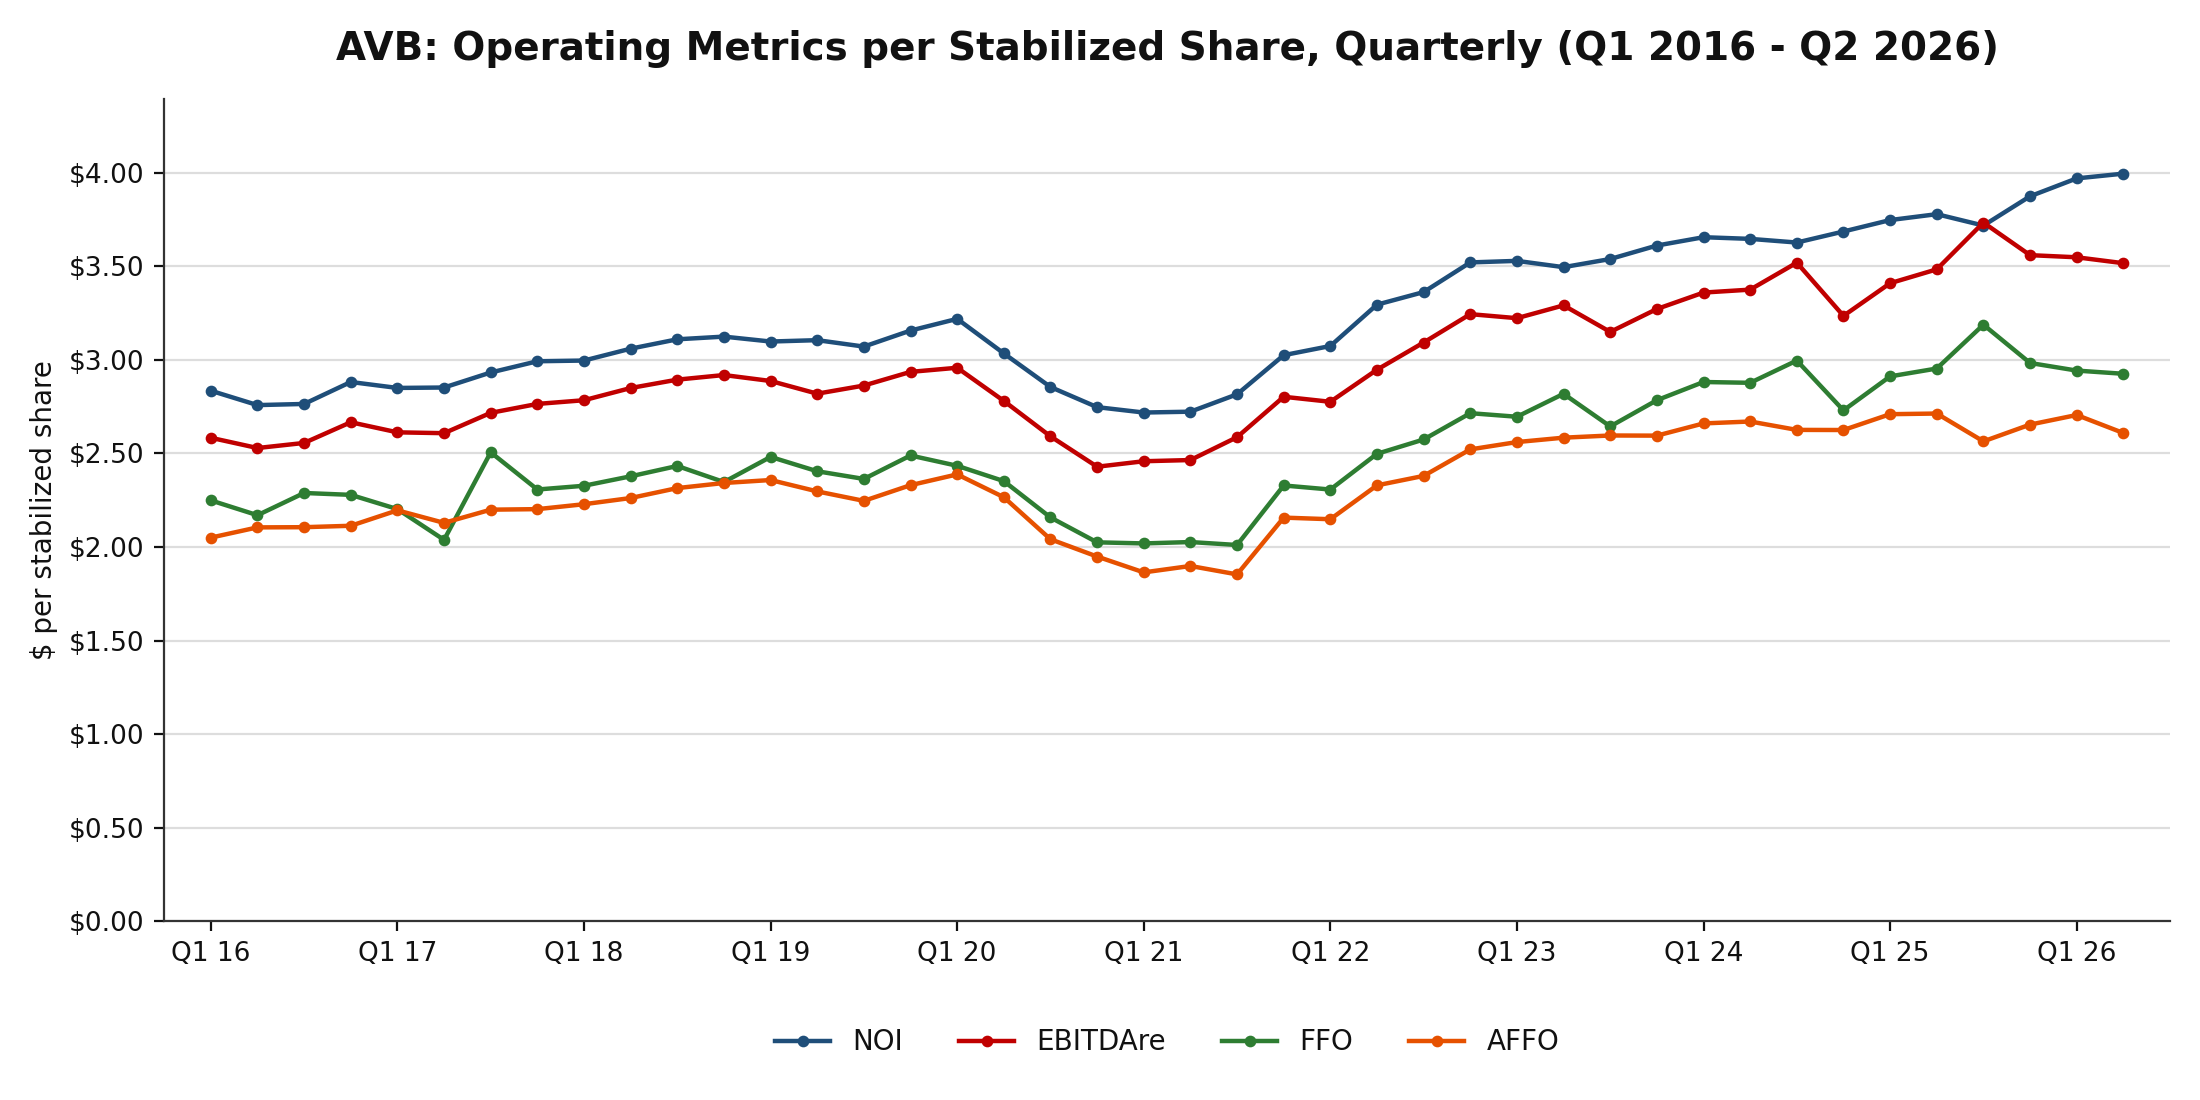
Source: AvalonBay quarterly earnings release attachments (8-K Ex-99.2) and Forms 10-Q / 10-K, Q1 2016–Q2 2026; CRE42 stabilized-share basis. Companion workbook, CHARTS STAB tab.
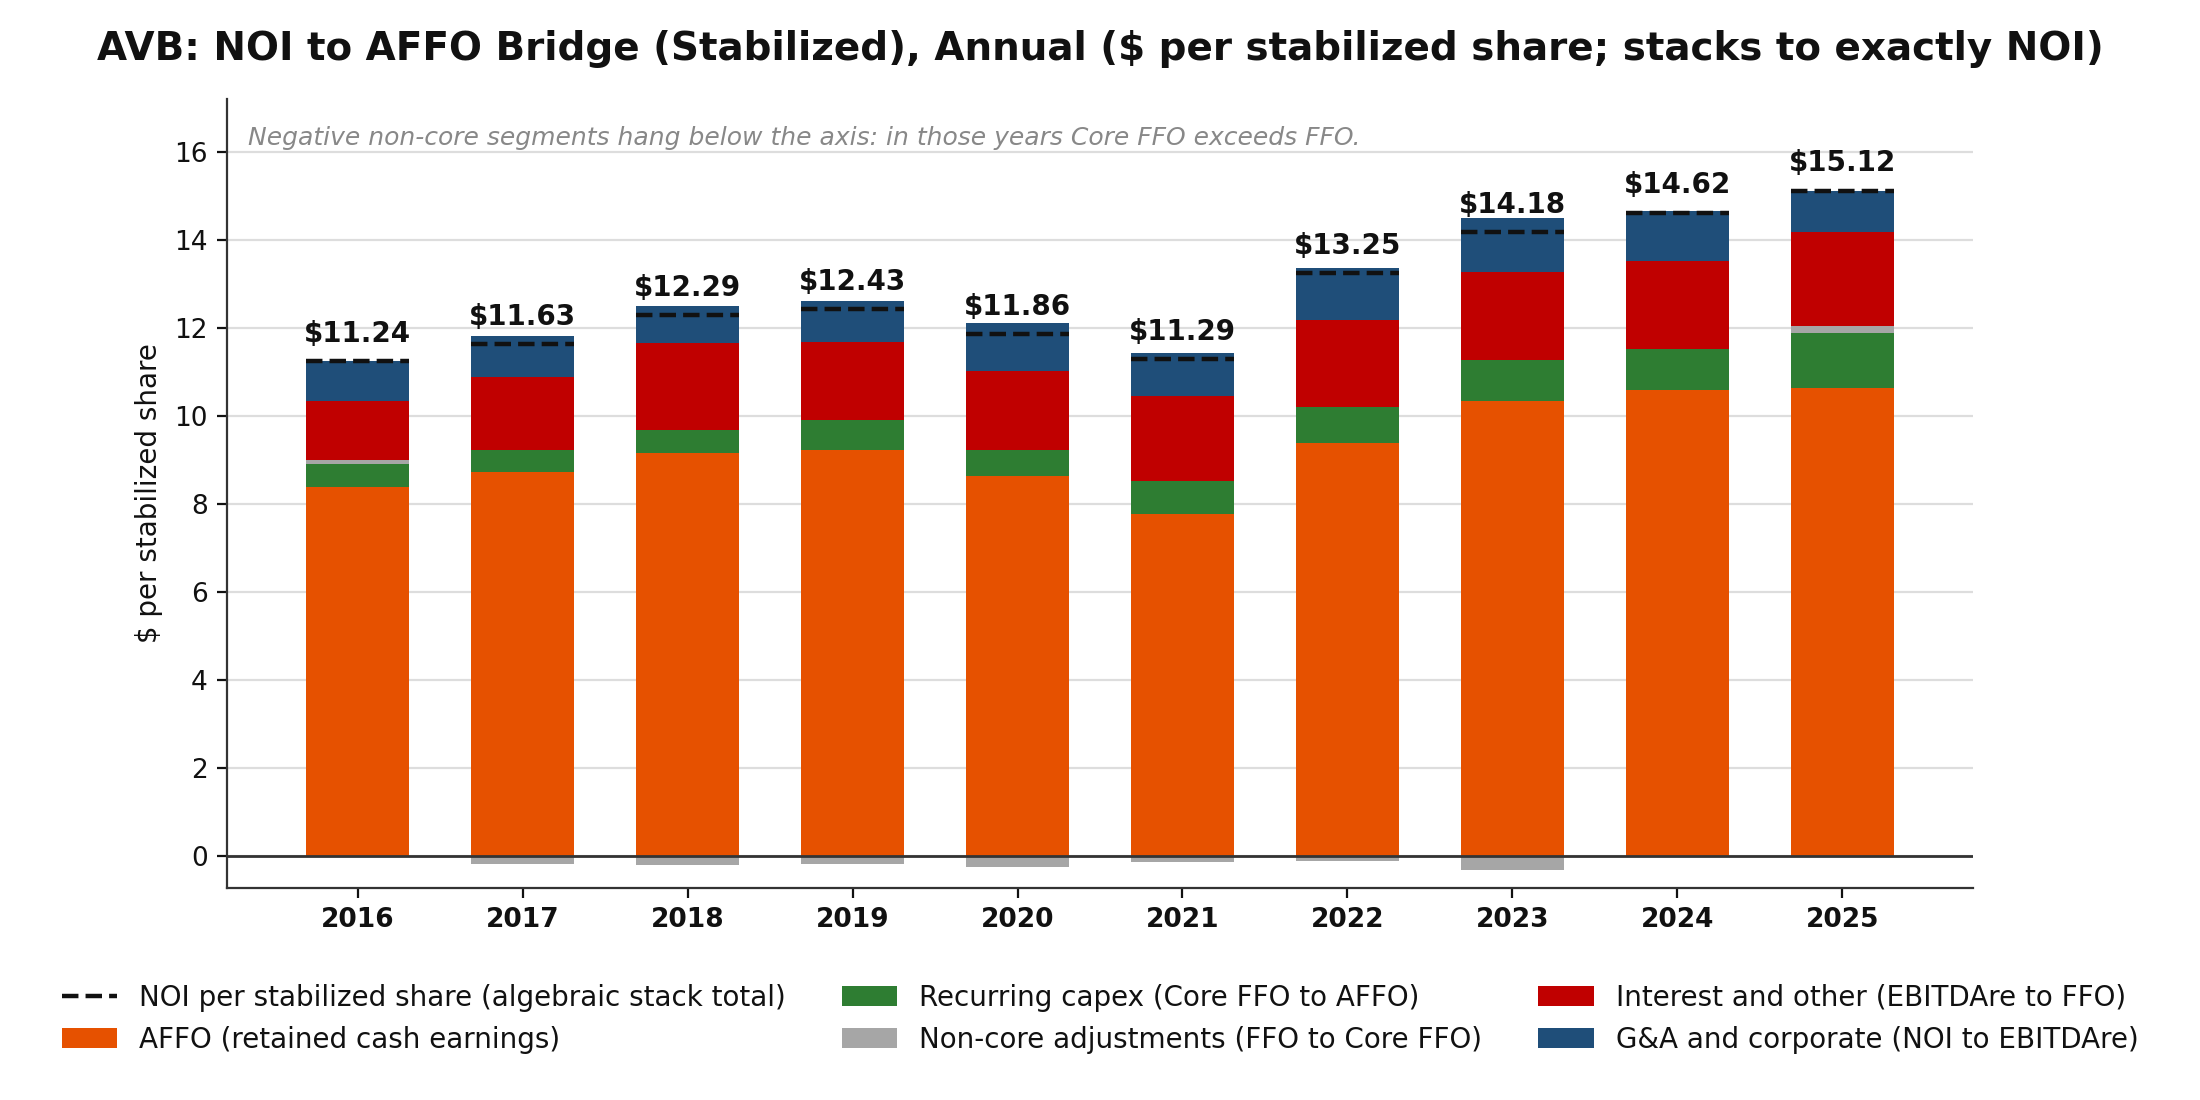
Source: Companion workbook, Quarterly Data annual block; segments are the exact differences between adjacent metrics, per stabilized share, and stack to NOI.
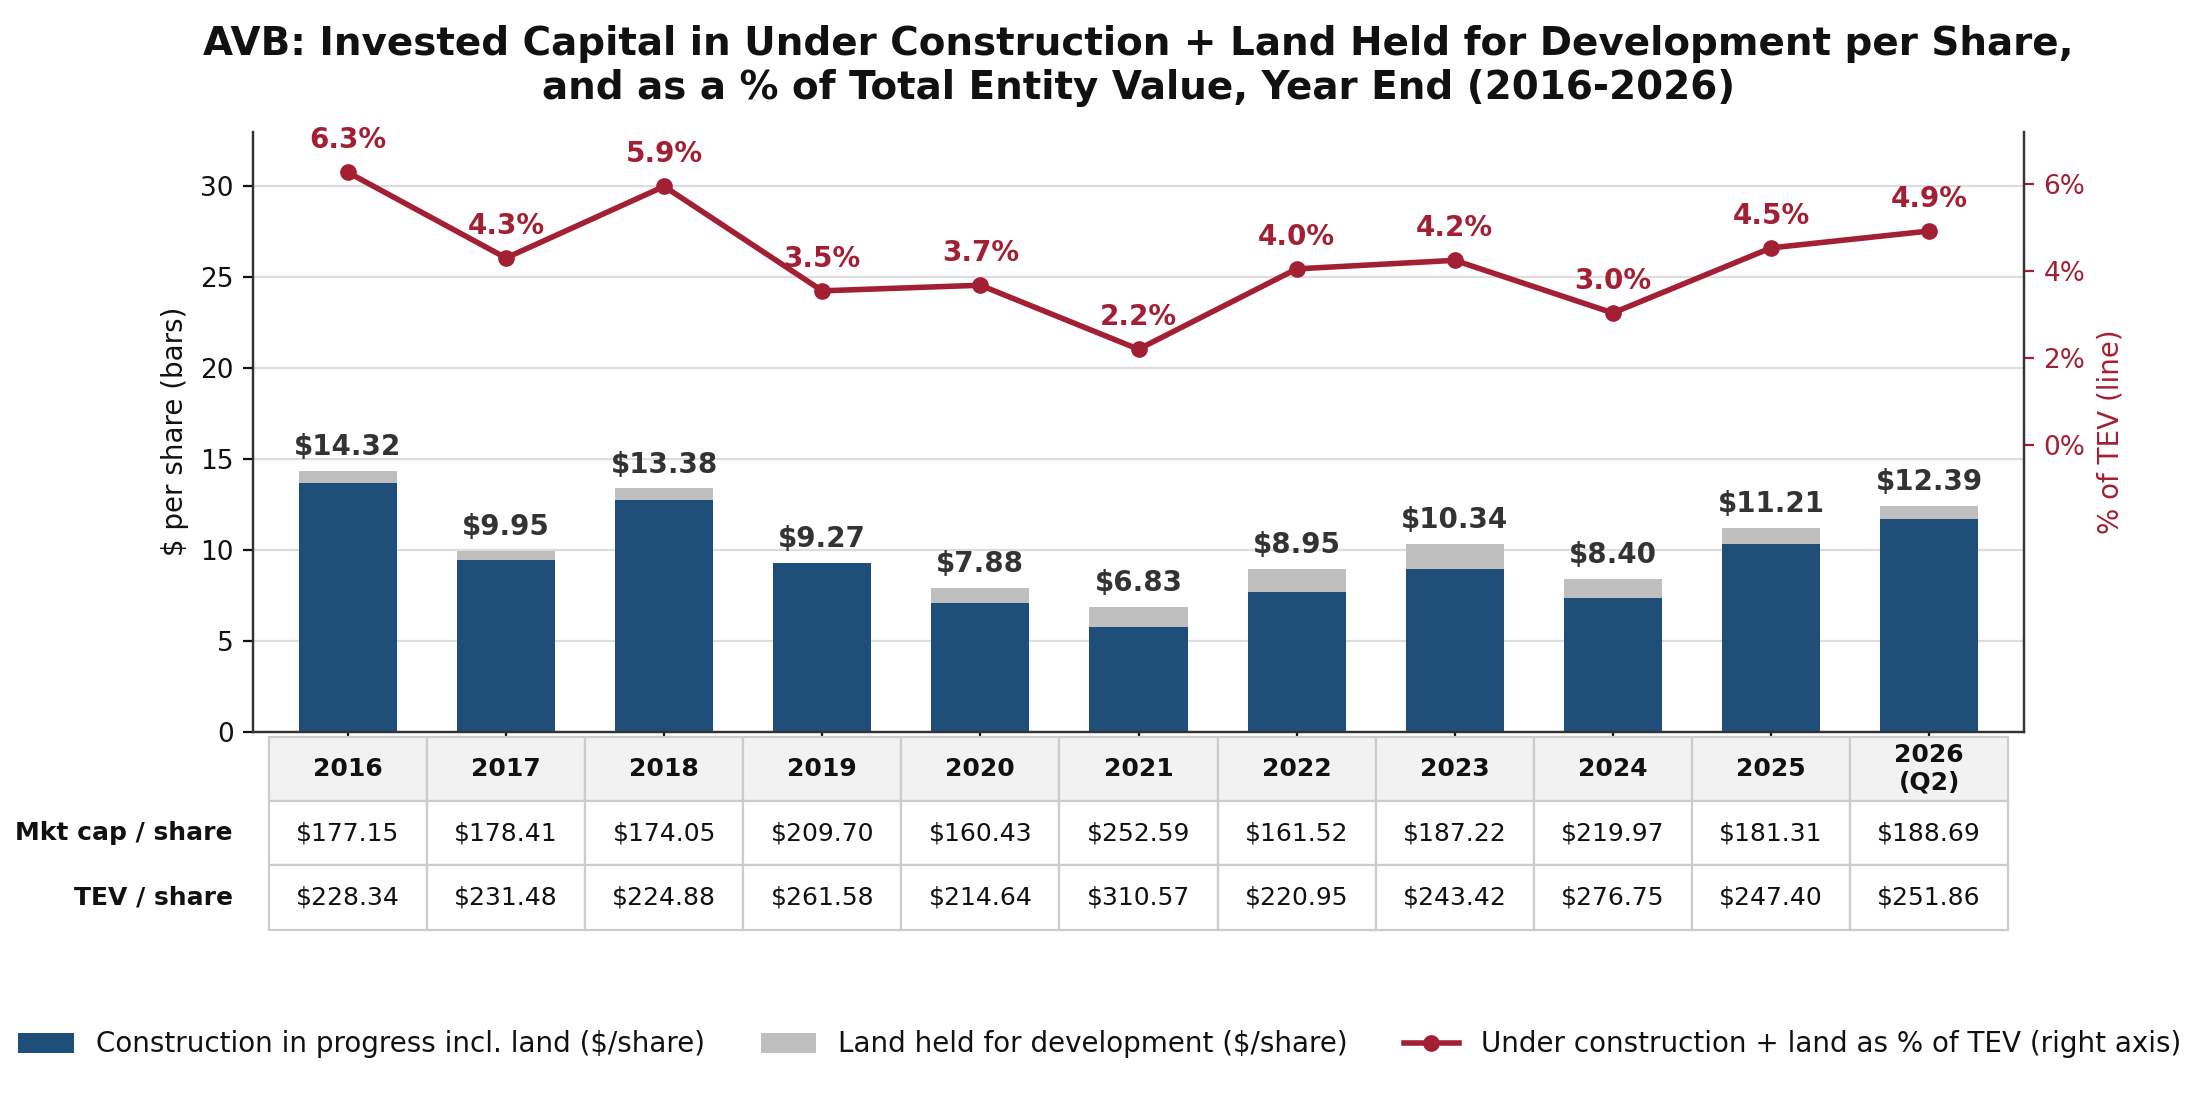
Source: AvalonBay balance sheets (Forms 10-K / 10-Q), Q4 2016–Q2 2026; companion workbook, Quarterly Data development pipeline block (rows 169–180). Bars: "Construction in progress, including land" plus "Land held for development", per period-end share and unit; line: the same total as a percentage of TEV. 2026 = quarter end June 2026, not annualized.[3]
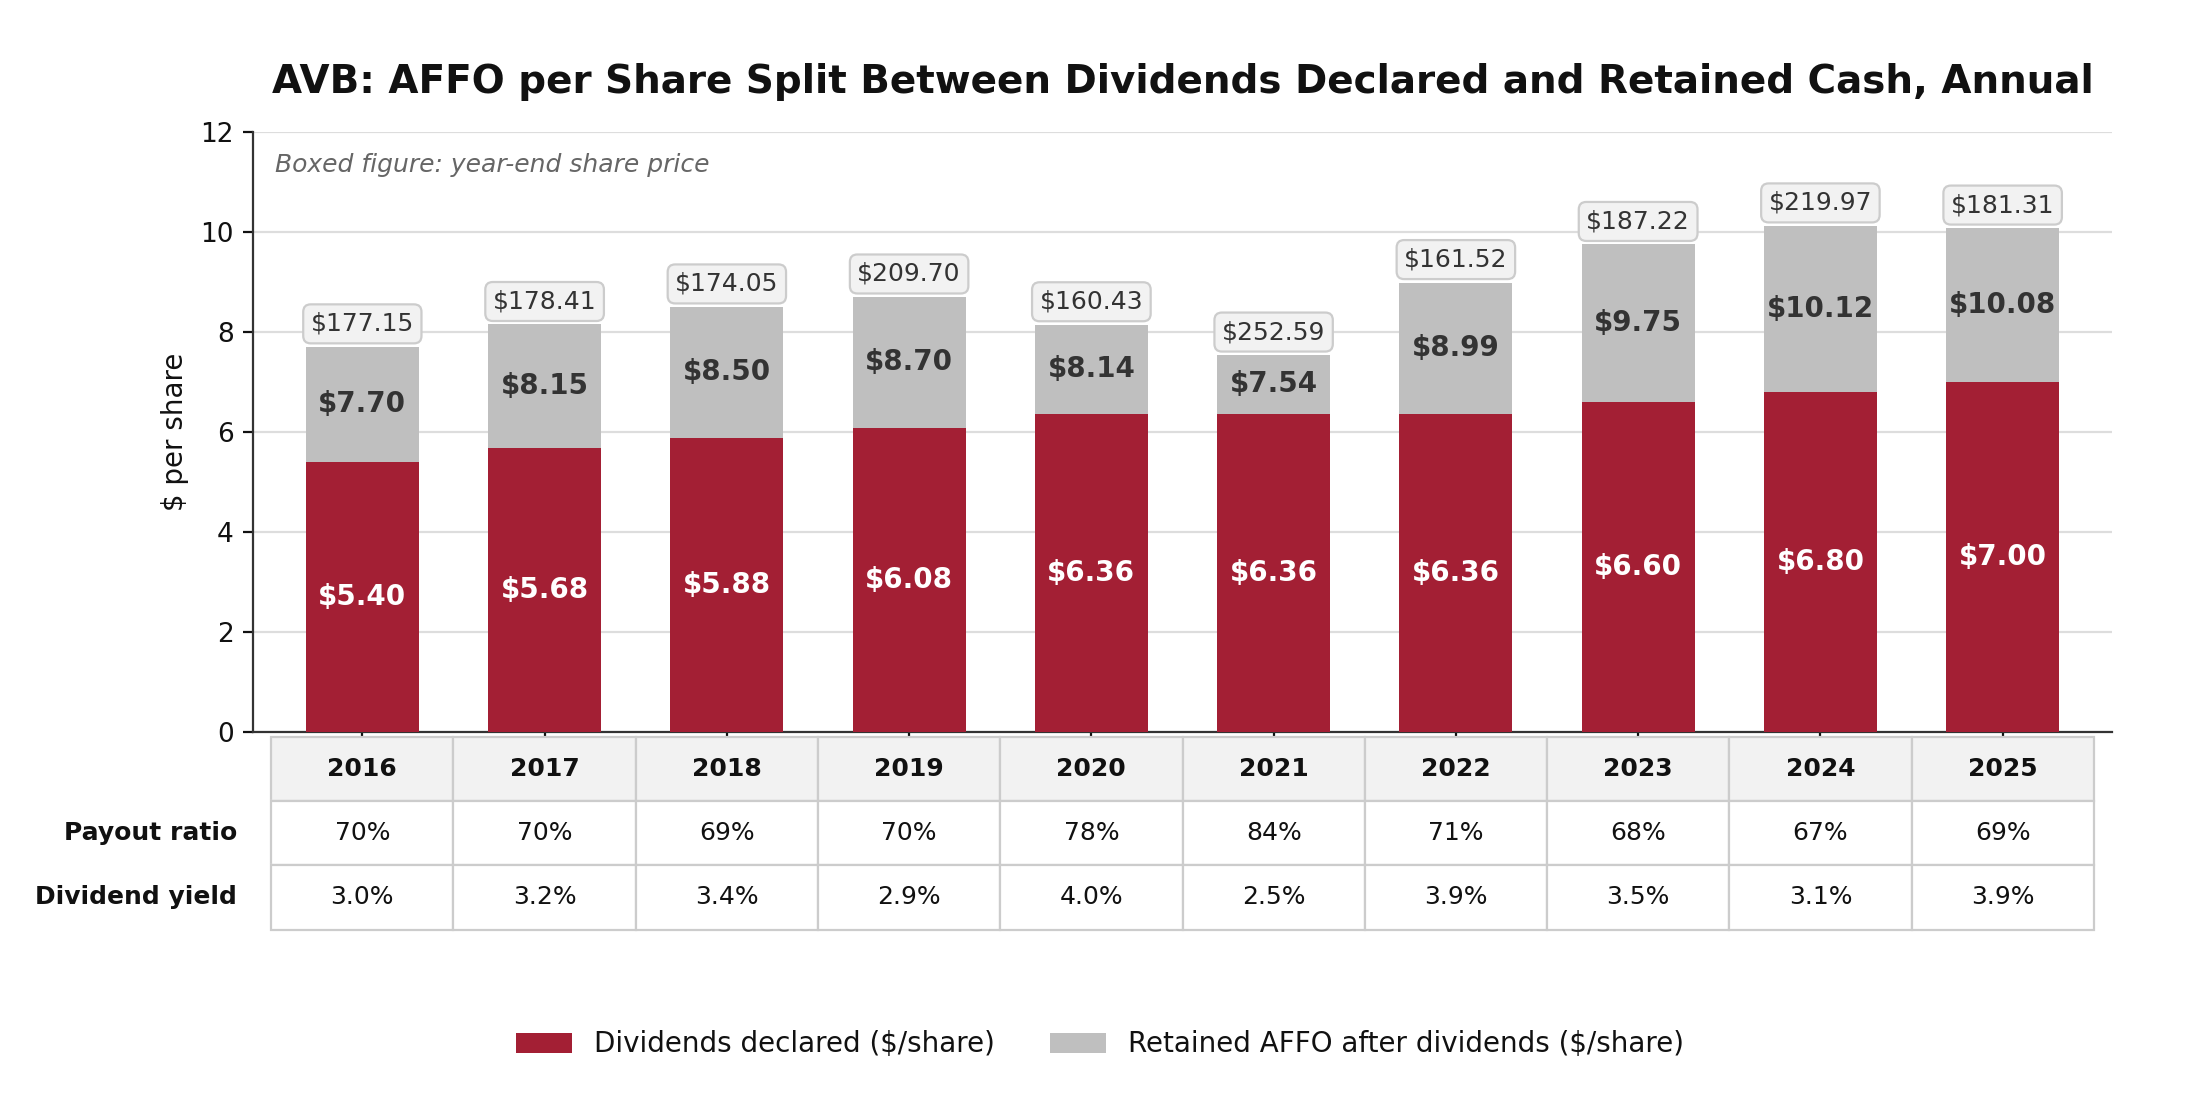
Source: AvalonBay Forms 10-K and 10-Q, 2016–2025 (dividends declared, statements of changes in equity); companion workbook, Quarterly Data dividend rows and annual block. AFFO per share on weighted-average diluted shares; payout ratio = dividends declared / AFFO; dividend yield = dividends declared / year-end closing price.
The chart above and the three tables below are on an as-reported basis: per-share figures use weighted-average diluted shares, and the yields use unadjusted market capitalization and total enterprise value. The tables higher up the page are on the stabilized basis[1], which deducts non-revenue-producing construction and development land from both capitalization and share counts. FY2025 AFFO reads $10.08 per share here and $10.64 per stabilized share there.
| TTM | Q3 25 | Q4 25 | Q1 26 | Q2 26 | |
|---|---|---|---|---|---|
| AFFO / MKT CAP | 5.2% | 5.0% | 5.5% | 6.2% | 5.1% |
| FFO / MKT CAP | 5.9% | 6.3% | 6.2% | 6.7% | 5.8% |
| EBITDAre / TEV | 5.3% | 5.6% | 5.4% | 5.7% | 5.2% |
| NOI / TEV | 5.7% | 5.6% | 5.9% | 6.4% | 5.9% |
| 2016 | 2017 | 2018 | 2019 | 2020 | 2021 | 2022 | 2023 | 2024 | 2025 | 2026 ann. | |
|---|---|---|---|---|---|---|---|---|---|---|---|
| NOI | $10.33 | $10.86 | $11.42 | $11.71 | $11.17 | $10.94 | $12.70 | $13.37 | $13.98 | $14.31 | $14.81 |
| EBITDAre | $9.50 | $9.99 | $10.64 | $10.84 | $10.13 | $10.00 | $11.55 | $12.20 | $12.90 | $13.43 | $13.14 |
| FFO | $8.26 | $8.45 | $8.81 | $9.18 | $8.45 | $8.13 | $9.67 | $10.32 | $10.98 | $11.40 | $10.91 |
| AFFO | $7.70 | $8.15 | $8.50 | $8.70 | $8.14 | $7.54 | $8.99 | $9.75 | $10.12 | $10.08 | $9.88 |
| CFO | $8.32 | $9.10 | $9.41 | $9.47 | $8.68 | $8.61 | $10.16 | $11.01 | $11.29 | $11.70 | $11.08 |
| 2016 | 2017 | 2018 | 2019 | 2020 | 2021 | 2022 | 2023 | 2024 | 2025 | 2026 ann. | |
|---|---|---|---|---|---|---|---|---|---|---|---|
| NOI | 5.1% | 5.2% | 2.6% | -4.7% | -2.1% | 16.1% | 5.3% | 4.6% | 2.4% | 3.5% | |
| EBITDAre | 5.2% | 6.4% | 1.9% | -6.5% | -1.3% | 15.6% | 5.6% | 5.7% | 4.1% | -2.2% | |
| FFO | 2.3% | 4.2% | 4.1% | -7.9% | -3.8% | 19.0% | 6.7% | 6.4% | 3.8% | -4.2% | |
| AFFO | 5.8% | 4.3% | 2.3% | -6.4% | -7.4% | 19.3% | 8.5% | 3.8% | -0.4% | -1.9% | |
| CFO | 9.4% | 3.4% | 0.7% | -8.3% | -0.8% | 18.0% | 8.4% | 2.5% | 3.7% | -5.3% |
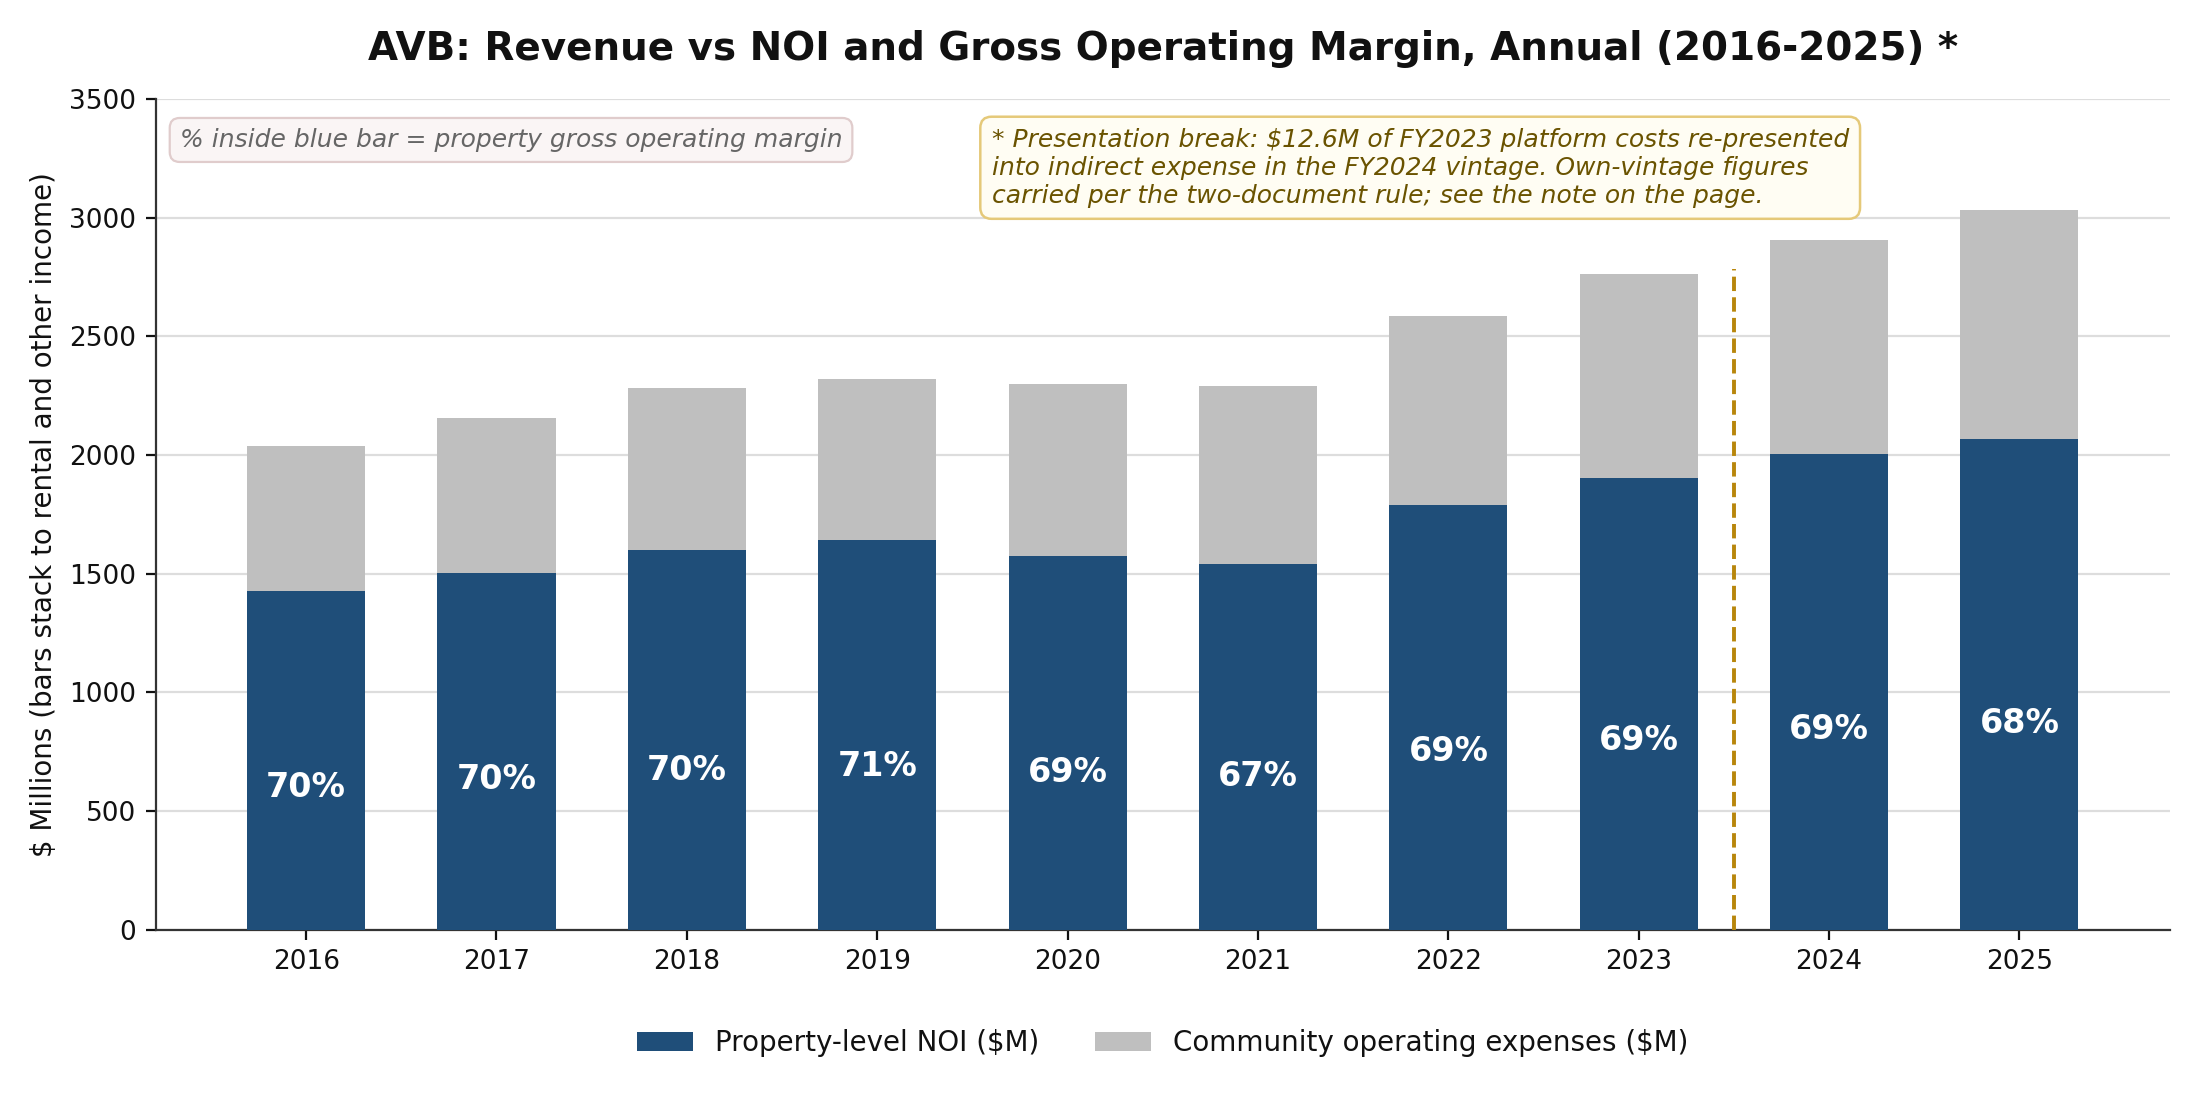
Source: AvalonBay Q4 earnings release attachments (8-K Ex-99.2), consolidated statements of operations, full-year column, own vintage 2016–2025; cross-vintage corroborated. Margin = (rental and other income less community operating expenses) / rental and other income. Companion workbook, Quarterly Data rows 114–118 and the detail block at rows 155–167.[4]
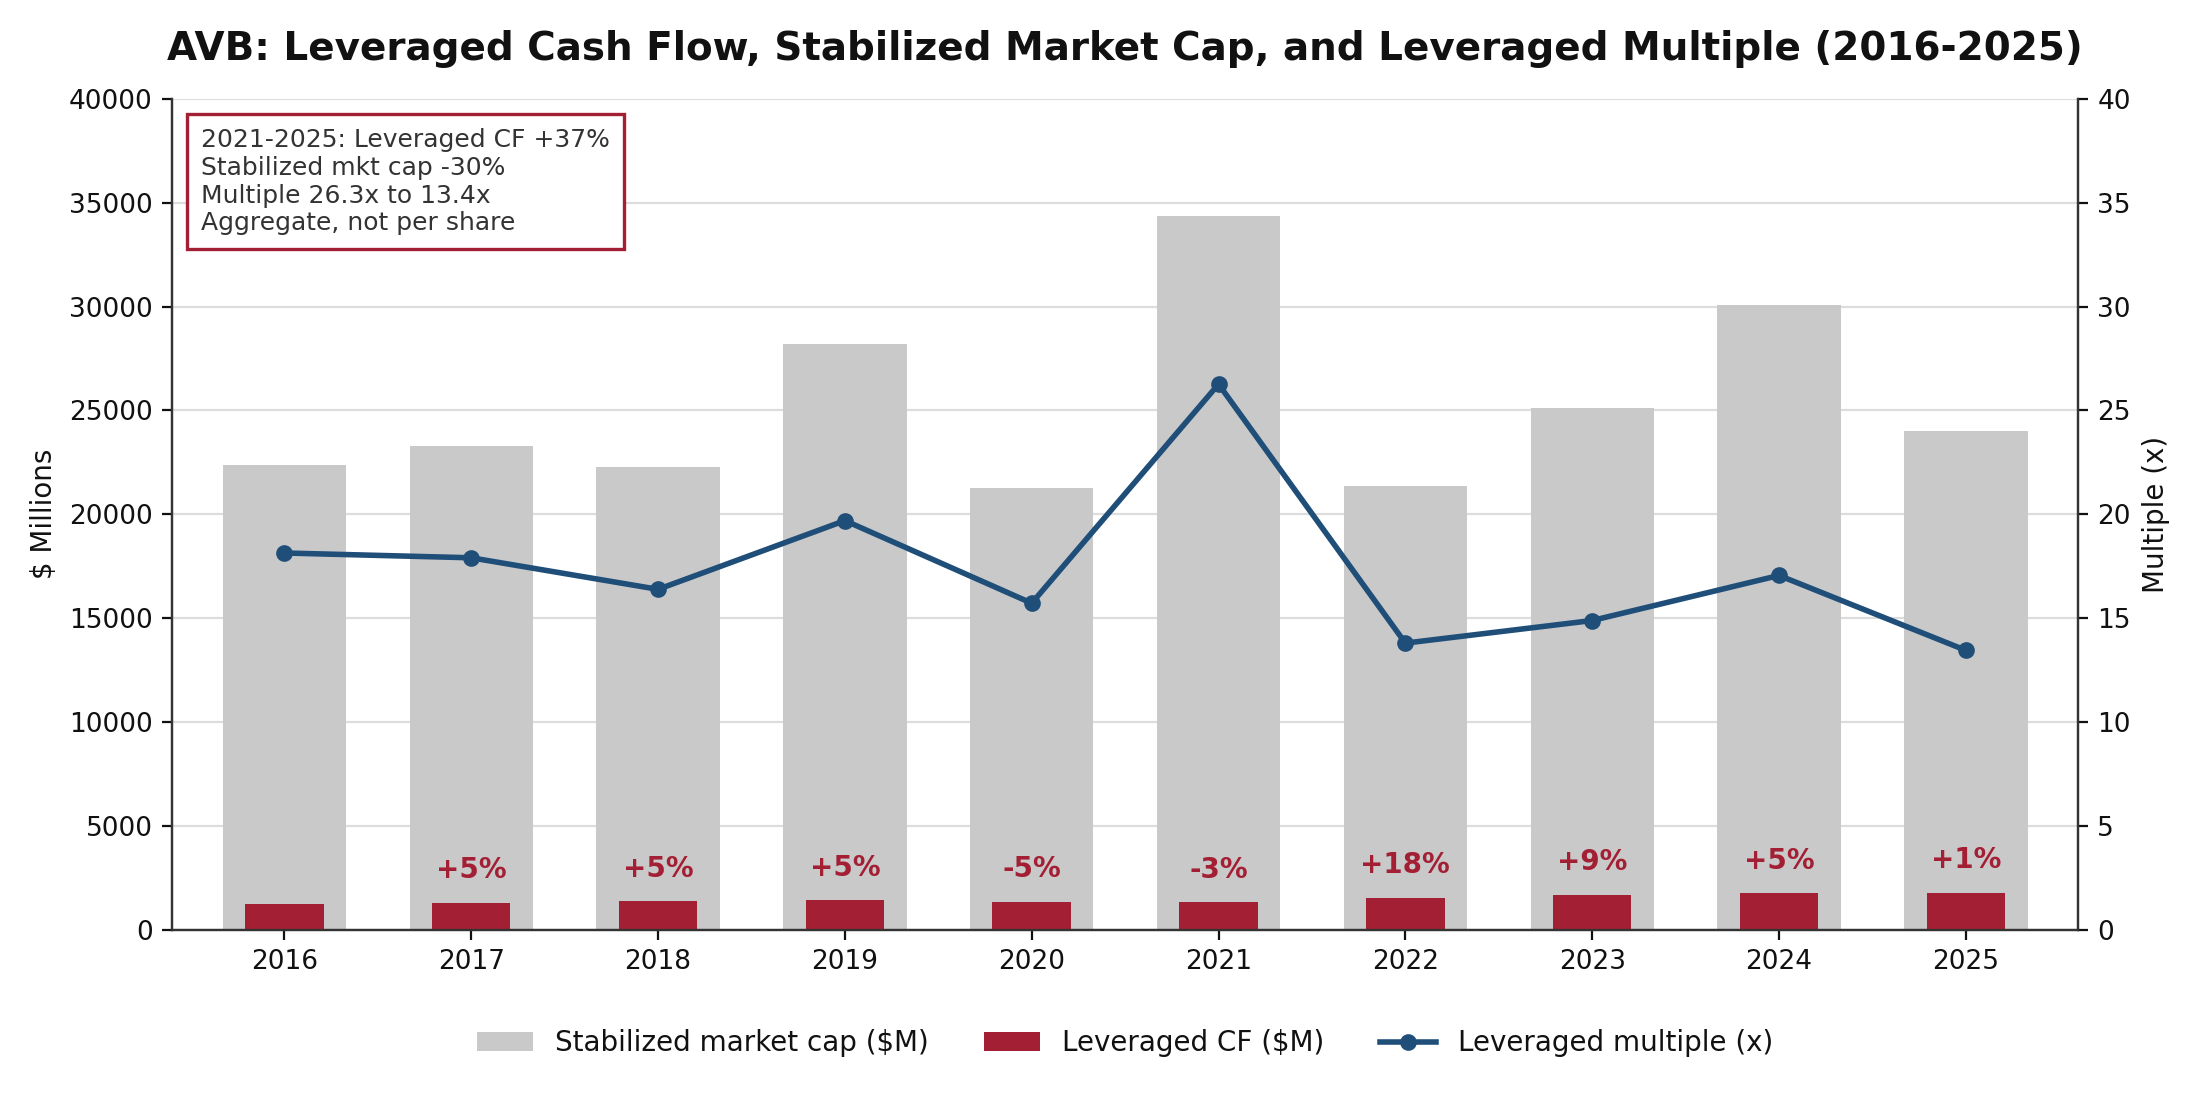
Source: Companion workbook, Quarterly Data annual block; stabilized market cap per the CRE42 method.[1] Leveraged CF = NOI less interest expense.
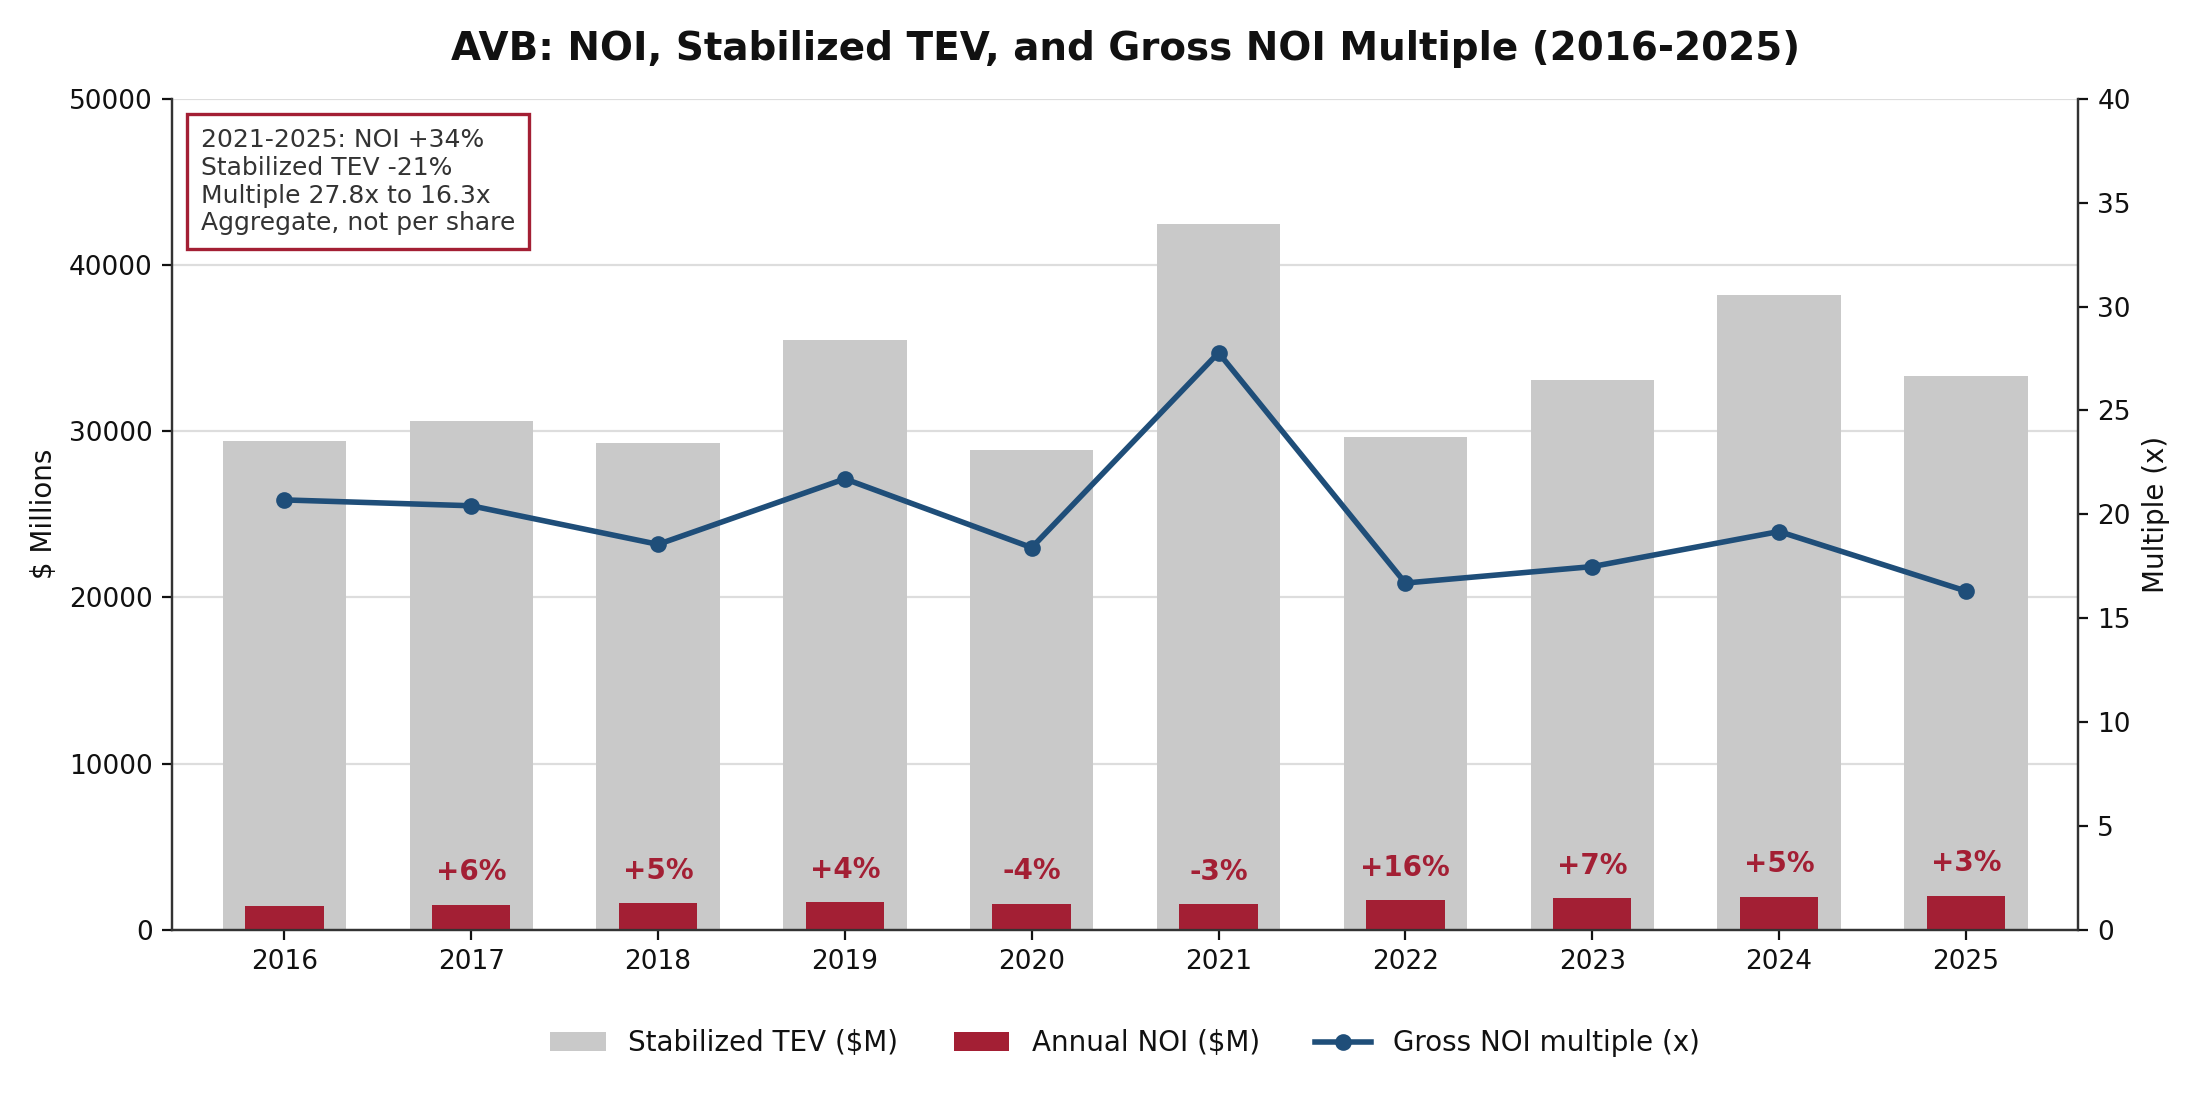
Source: Companion workbook, Quarterly Data annual block; stabilized TEV per the CRE42 method.[1]
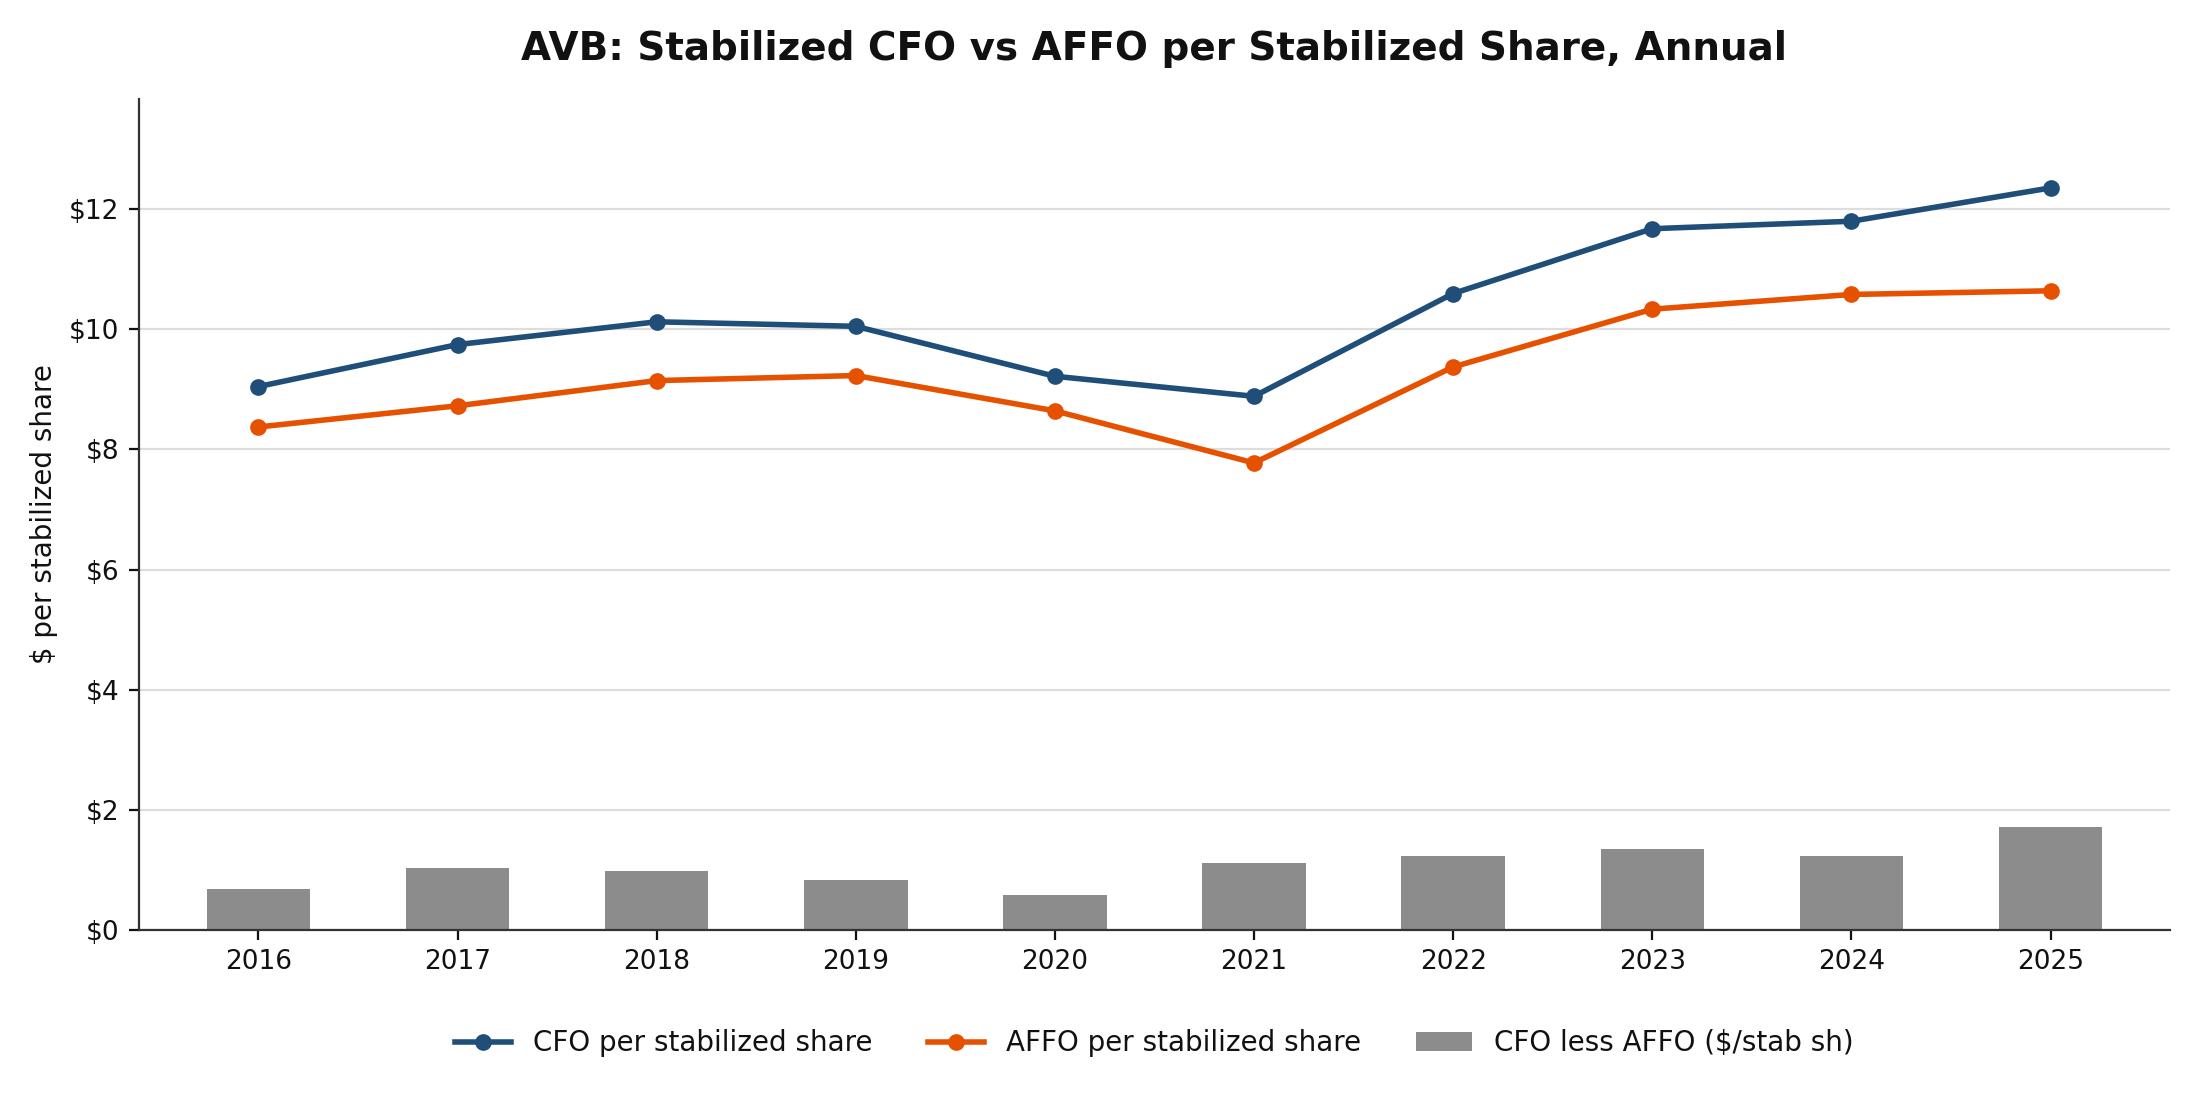
Source: Companion workbook, Quarterly Data annual block. CFO is as-reported operating cash flow; AFFO is CRE42-constructed (Core FFO less recurring capex).
[1] Stabilized basis, accounting mechanics. The stabilized adjustment removes from equity market capitalization and total enterprise value the cumulative invested cost of (a) development and value-add projects in lease-up or under construction, carried on AVB's balance sheet as "Construction in progress, including land", and (b) prospective-development land held at cumulative cost, carried as "Land held for development". Per-share figures deduct the share-equivalent of the same value (dev and land value divided by the quarter-end share price) from both weighted-average diluted and period-end share counts. Land under operating communities is not deducted; the adjustment isolates only capital that is not yet producing income. Note that AvalonBay moves assets out of construction in progress at completion rather than at stabilization, so the adjustment is, if anything, conservative; AVB publishes no figure to cross-check it against. Method per the CRE42 REIT-section convention; full decision trail on the companion workbook Sources tab. ↩
[2] Reading the 2026 column. Every 2026 figure on this page is the first half annualized ×2, and the four series diverge sharply that year: NOI per stabilized share rises 5.4% while EBITDAre falls 0.4%, FFO falls 2.5% and CFO falls 3.5%. Four things drive the wedge, none of them a change in property performance. (a) 2025's EBITDAre base carries unrealized gains on AvalonBay's proptech investments that do not repeat, large enough that published Q3 2025 EBITDAre sits slightly above NOI. (b) 2026 carries merger transaction costs, which is most of why G&A and corporate per stabilized share jumps to $1.80 from $0.93. (c) Asset Preservation capex steps up to $1.62 per stabilized share from $1.23. (d) AvalonBay's operating cash flow is back-half weighted, so the H1 ×2 convention understates CFO in a way it does not understate NOI. NOI, which sits above all four effects, is the only series on the page that reads clean in 2026.
[3] Development pipeline chart. The two bar segments together equal the "dev & land value" that the stabilized adjustment in note [1] removes from market cap and TEV. AvalonBay's balance sheet carries the land under communities being built inside "Construction in progress, including land", so the gray segment is only the separately held land bank; the two lines are not the same split EastGroup reports. Per-share figures divide year-end balances by period-end shares plus DownREIT units, the same count used for market cap and TEV per share in the table beneath the bars. Two published readings look unusual and are carried as reported: land held for development reads $0 at December 31, 2019, and it fell from $520M to $84M between the third and fourth quarters of 2016. The right axis is offset so the line reads clear of the bars; its zero sits mid-plot by design.
[4] Gross operating margin series, two things to know. First, the numerator is not the NOI used elsewhere on this page. AVB's earnings-release NOI reconciliation carries no total-revenue line, so revenue and operating expenses come from the consolidated statements of operations instead. Those statements do not re-base prior periods for dispositions and assets held for sale, while AVB's published NOI does, leaving the two 0.3% to 1.2% apart in any given year ($2,067M against $2,044M in 2025). The margin ratio is internally consistent; it simply will not tie to the NOI in the charts above. Second, there is a presentation break between 2023 and 2024. In its FY2024 release AvalonBay re-presented $12.6M of FY2023 "platform costs" out of direct property operating expenses and into property management and other indirect expense, following its centralization into a shared-services model. Own-vintage figures are carried here per the two-document rule, so the reported 2023-to-2024 change reads as flat; on a consistent basis it is roughly -0.4 points. ↩
Data. AvalonBay Communities quarterly earnings release attachments and Forms 10-K / 10-Q, Q1 2016 through Q2 2026. AvalonBay publishes no standalone supplemental package; its supplemental disclosure is the set of attachments to the quarterly earnings release, furnished as 8-K Exhibit 99.2. Quarter-end share prices appear in no AVB filing and are carried as market-data inputs. AVB publishes no AFFO, so the AFFO series here is a CRE42 construct (Core FFO less recurring capex) with no published figure to tie to; recurring capex is AVB's Asset Preservation capex from 2018 forward and a flagged 10-Q proxy for 2016–2017, when no quarterly disclosure existed. All derived figures tie to published totals in the companion workbook; every input is cited on its Sources tab. Trailing yields and multiples use trailing-twelve-month results against quarter-end June 2026 stabilized capitalization.
Companion workbook. AVB-individual-metrics.xlsx – 42-quarter per-share grid (as reported and stabilized), derivations tied to published figures, annual aggregations, and native chart tabs (CHARTS, CHARTS STAB).