
U.S. Retail Supply Cycle: 2008–2026
U.S. Retail Net Delivered SF (2008–2026)
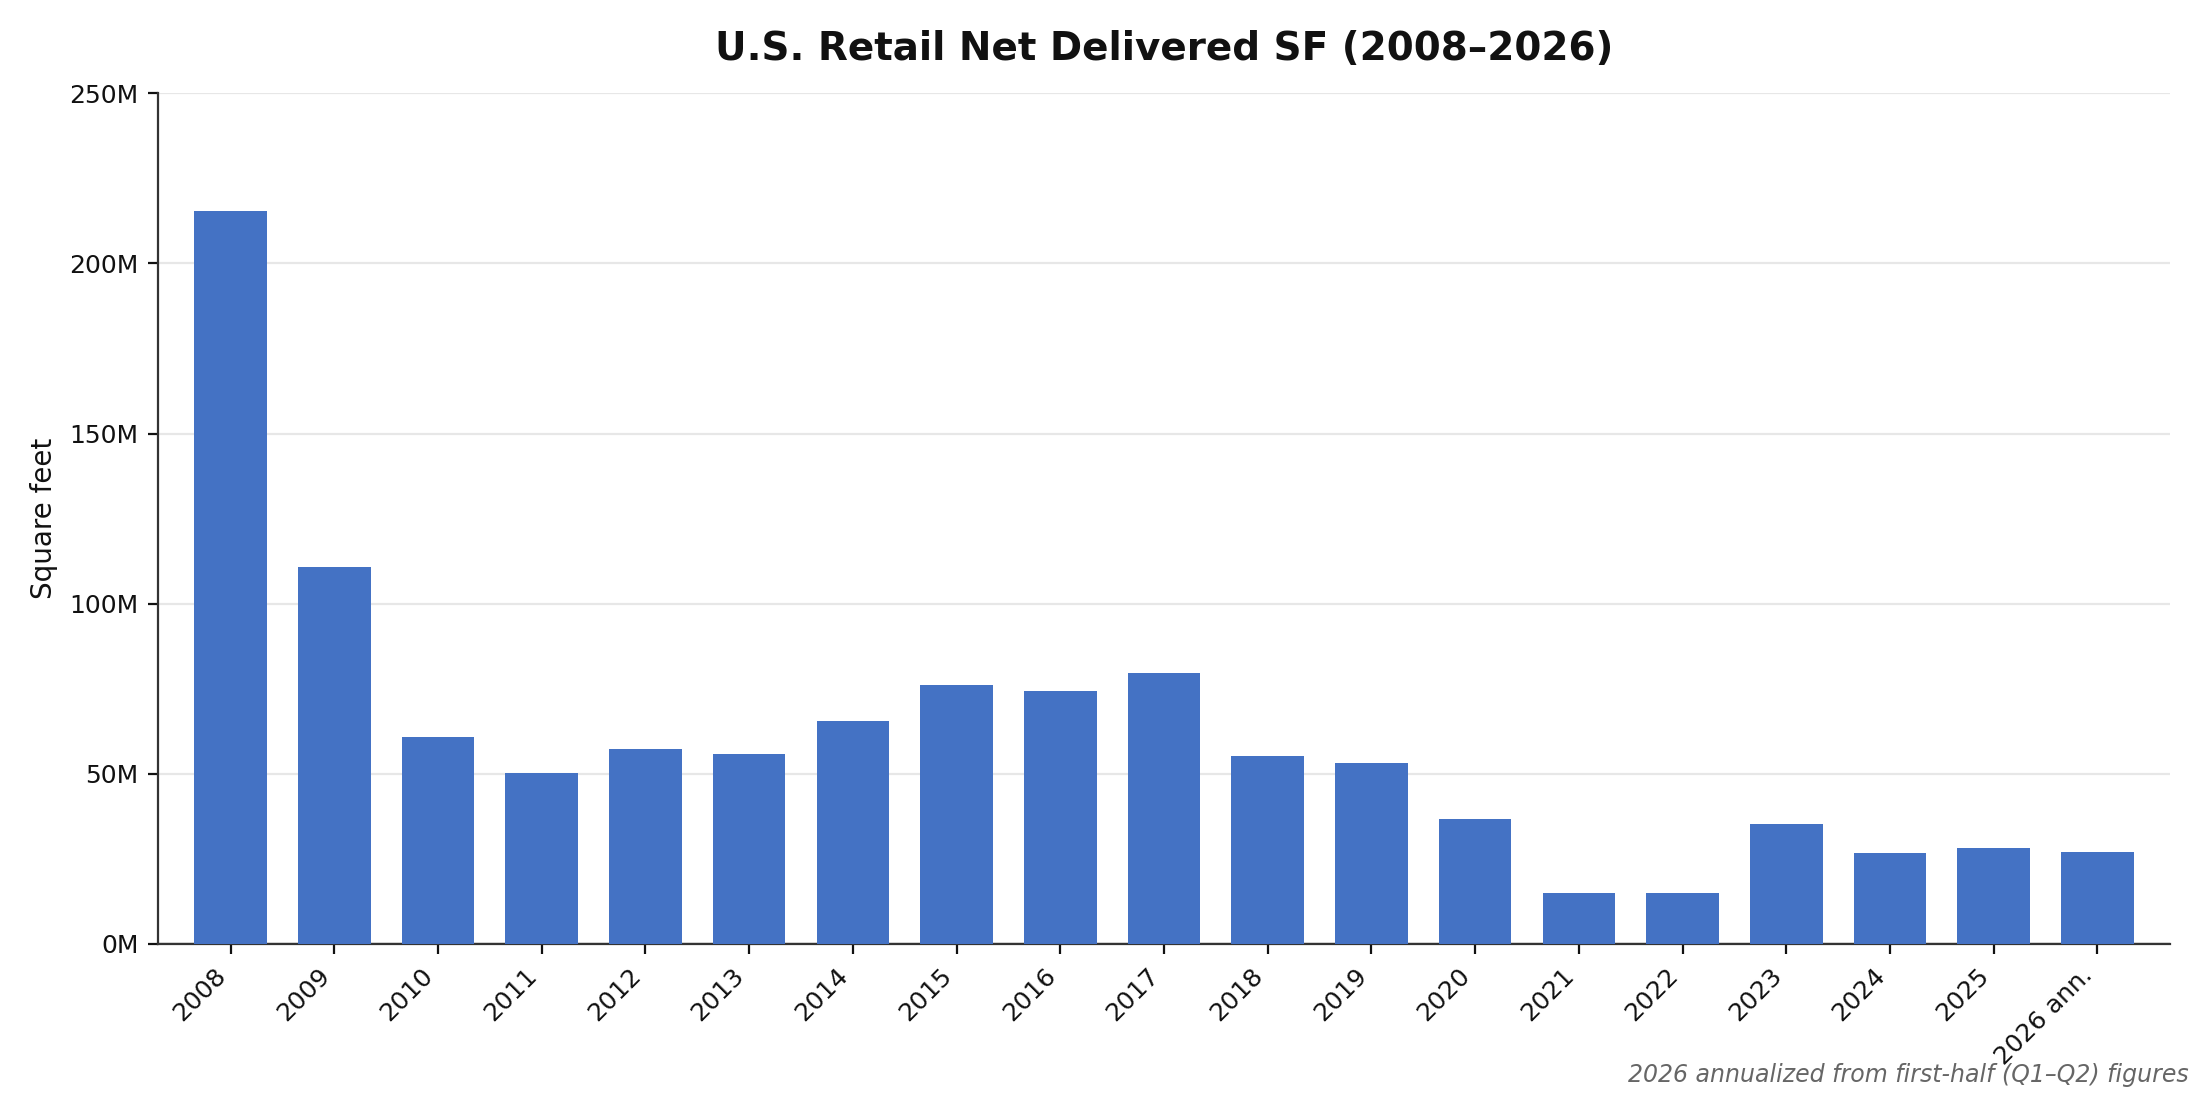
Source: CoStar, Q2 2026; 2026 annualized from first-half figures.
U.S. Retail Deliveries, Absorption & Vacancy (2008–2026)
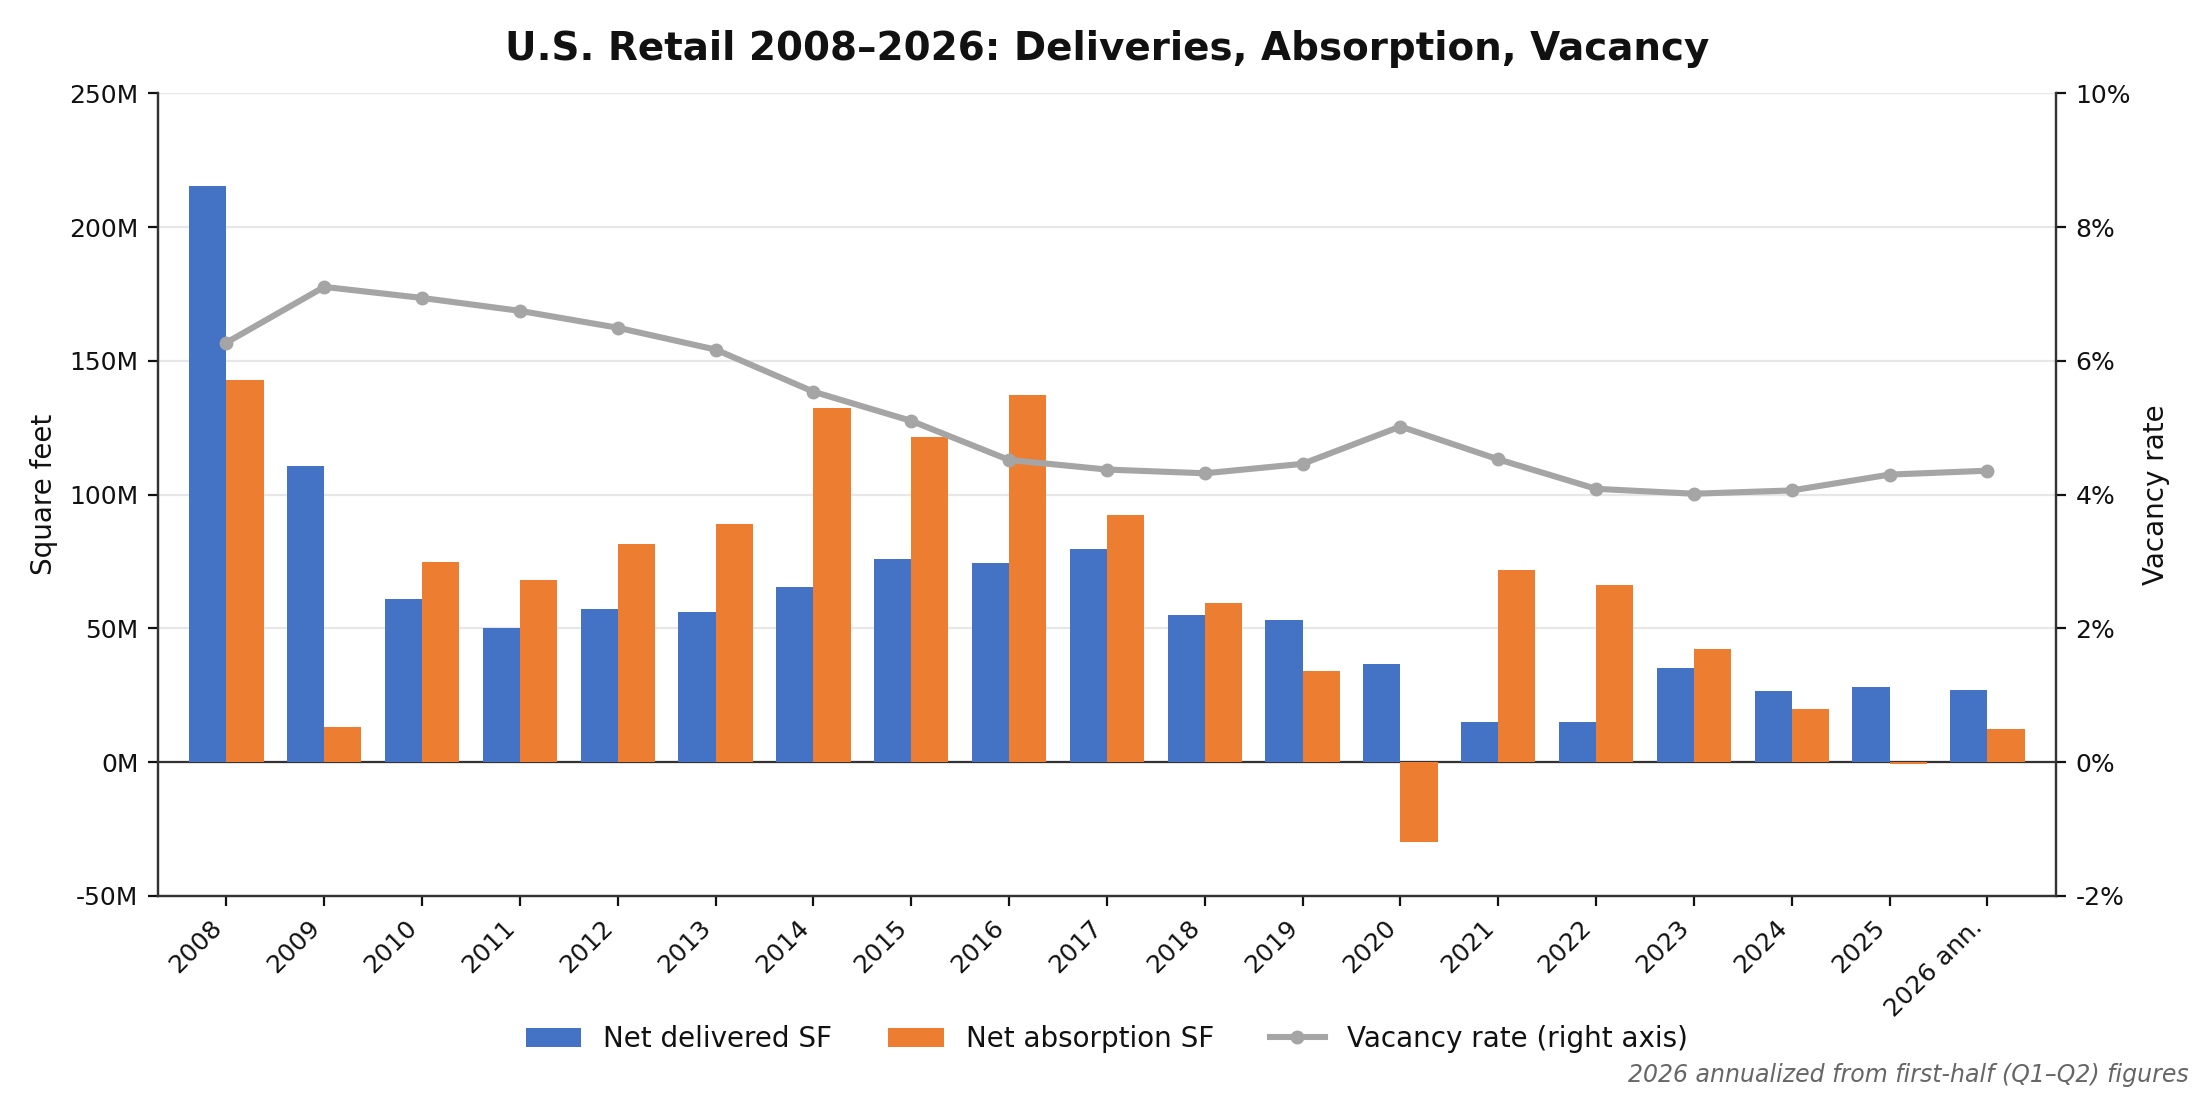
Source: CoStar, Q2 2026; 2026 deliveries and absorption annualized from first-half figures, vacancy as of Q2 2026.
U.S. Retail Vacancy vs. Market Asking Rent (2008–2026)
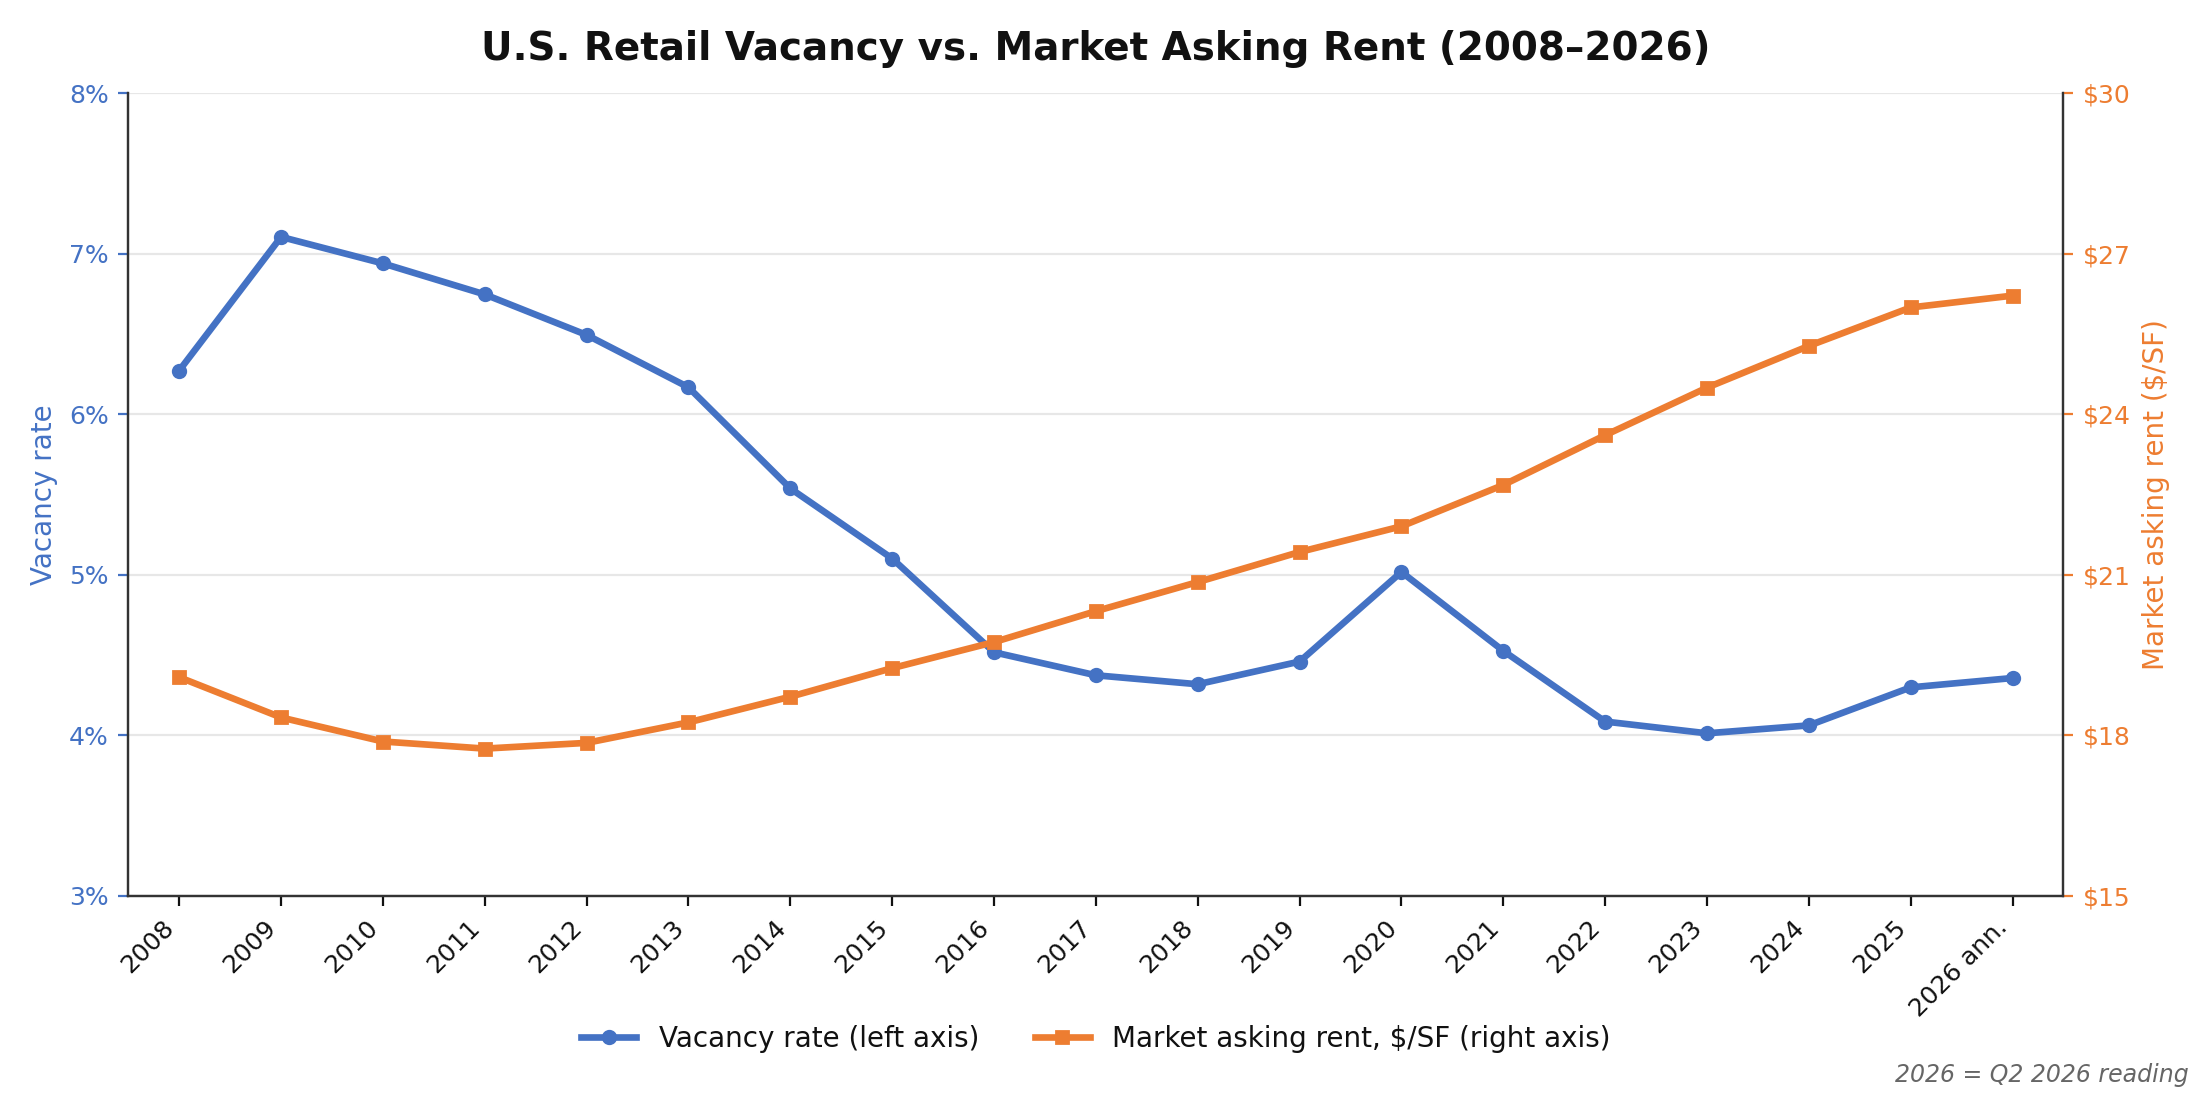
Source: CoStar, Q2 2026; the 2026 point is the Q2 2026 reading.
U.S. Retail Net Deliveries vs. Construction Starts (Prior 2-Year Average)
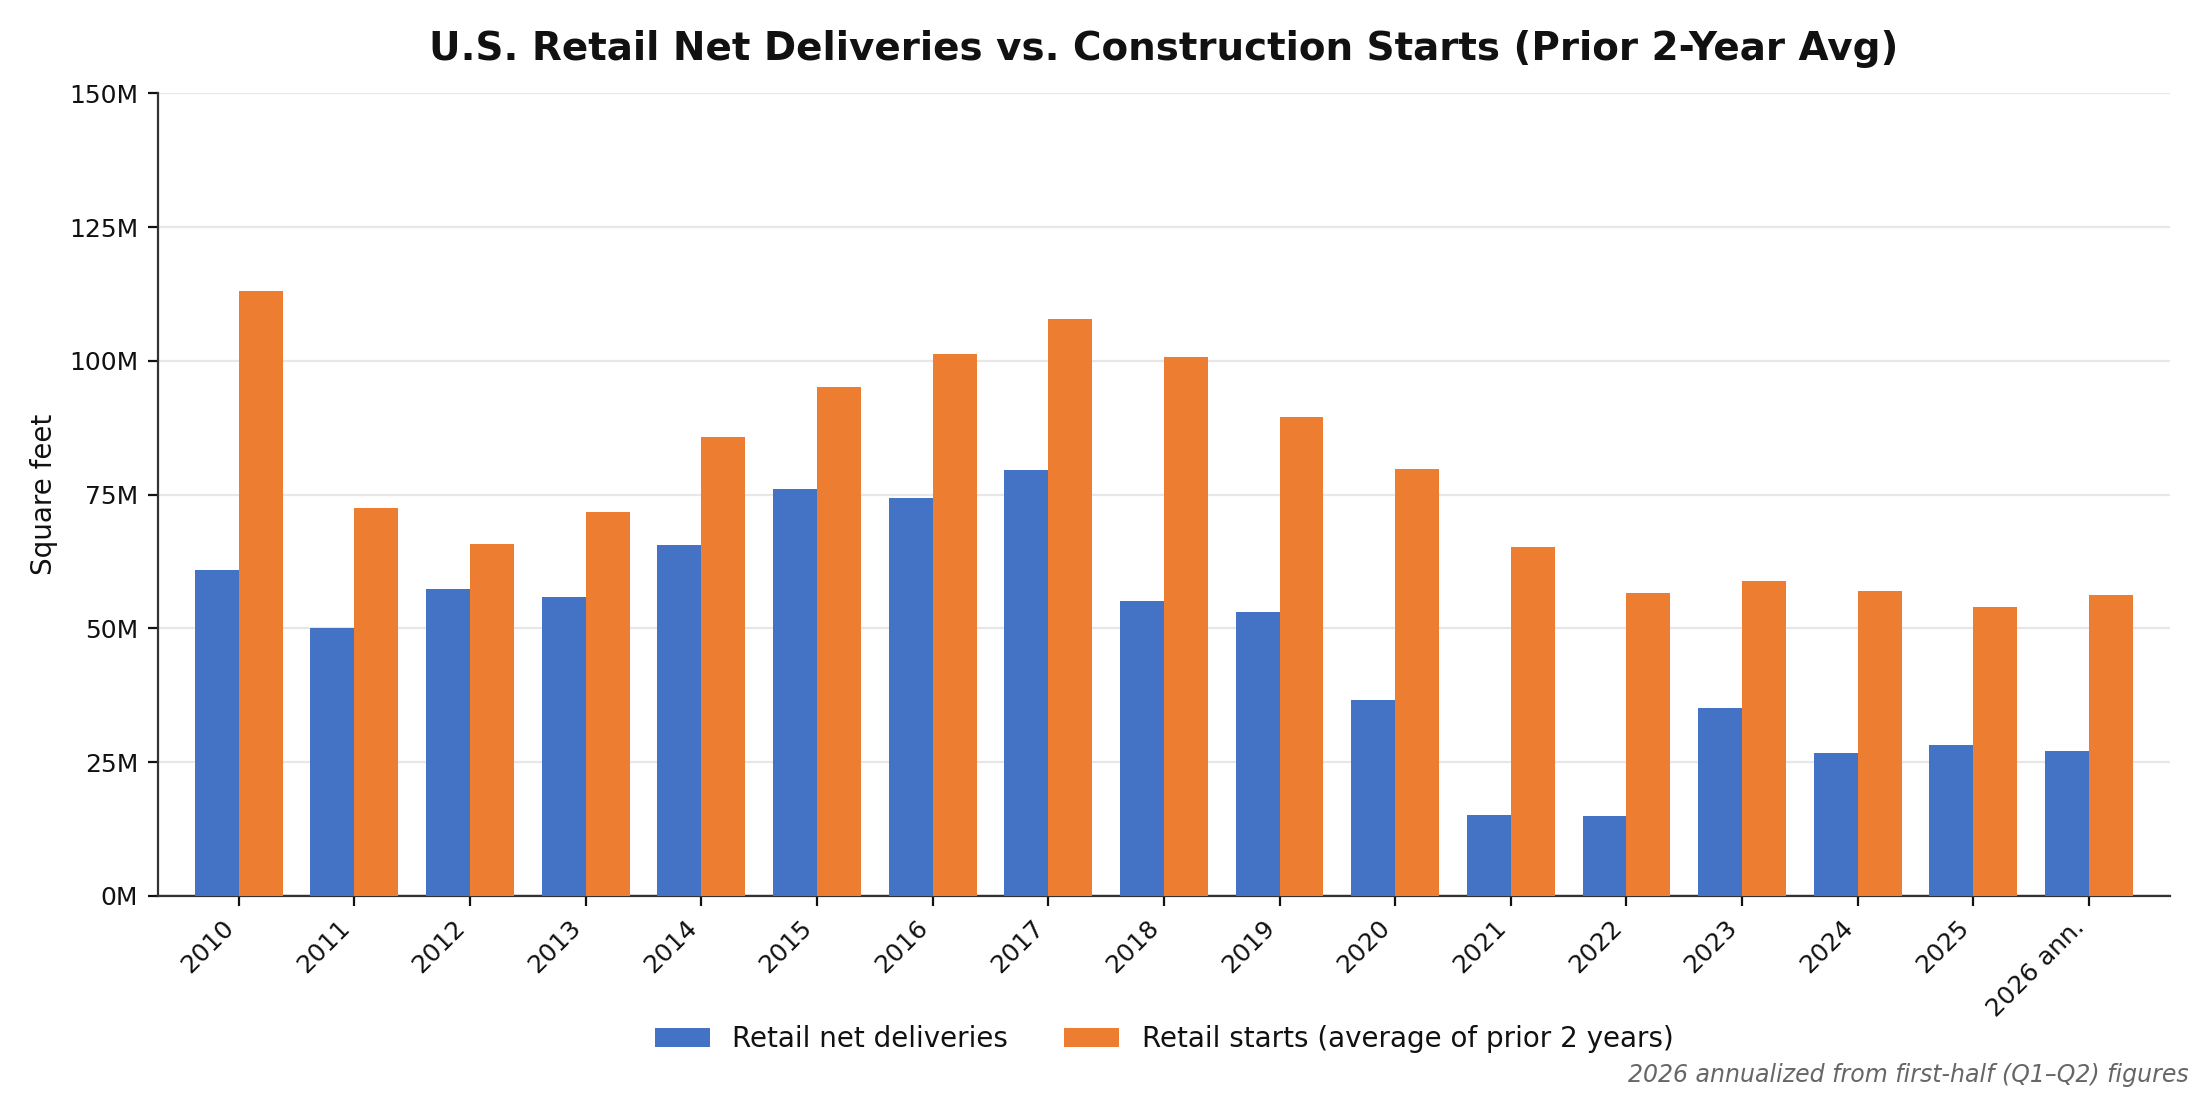
Source: CoStar, Q2 2026; 2026 annualized from first-half figures. Correlation between annual net deliveries and prior 2-year average starts (2010–2025) ≈ 0.80.
Key Observations
What to Watch For in 2026 and Beyond
Sources to Track U.S. Retail Supply in 2026:
| Source | Report / Series | Frequency | Notes |
|---|---|---|---|
| CoStar | Quarterly national and MSA-level retail update | Quarterly | Inventory, deliveries, starts, absorption, vacancy, availability, and rents; the basis of every series on this page |
| U.S. Census Bureau | Quarterly Retail E-Commerce Sales | Quarterly, about seven weeks after quarter end | E-commerce share of total retail sales, 17.1% in Q2 2026 |
| U.S. Census Bureau | Monthly Retail Trade Survey | Monthly | Retail sales by kind of business; the demand-side backdrop to retail space |
| Coresight Research | Store Tracker | Weekly, with annual reviews | U.S. store openings and closures by retailer |
Notes
[1] CoStar. U.S. Retail National Historical Data (Q2 2026, exported August 26, 2026). costar.com. Quarterly data for inventory, net delivered SF, construction starts, net absorption, vacancy rate, availability rate, asking rent/SF, rent growth, under-construction SF, and market cap rate for the U.S. retail market (all retail), Q4 2007 through Q2 2026, rolled up to calendar years by CRE42. Figures for 2026 are the first half (Q1–Q2) unless marked annualized. ↩
Companion workbook. retail-national-supply-cycle.xlsx: quarterly CoStar data (Q4 2007–Q2 2026), the calendar-year roll-up with the 2026 first-half and annualized rows, the deliveries-vs-starts correlation, and native charts. CoStar, Q2 2026.
Methodology & Data Notes
Data Source & Period
All national retail data sourced from CoStar’s U.S. Retail National Historical dataset, exported August 26, 2026, with the series cut at Q2 2026 (June 30, 2026); CoStar’s partial-quarter and forecast rows are not used. CoStar reports quarterly; CRE42 rolls the quarters up to calendar years, taking year-end readings for inventory, vacancy, availability, rent, cap rate, and under-construction figures and four-quarter sums for deliveries, starts, and absorption. The 2026 first-half figures quoted in the text are the first two quarters of 2026; the charts plot 2026 as an annualized point (first-half deliveries, starts, and absorption doubled, with vacancy, availability, rent, and pipeline as of Q2 2026), and the workbook carries both rows. CoStar’s retail series begins in Q4 2007, so 2007 holds one quarter of flows and the charts start at 2008. “Net Delivered SF” subtracts demolished and converted square footage from gross deliveries. “Construction Starts” represents the square footage of retail projects that broke ground in each calendar year. “Net Absorption” represents the change in occupied square footage over the period.
Starts-to-Deliveries Correlation
The correlation of approximately 0.80 is calculated between annual net delivered SF and the simple average of construction starts from the two preceding calendar years (e.g., 2025 deliveries correlated with the average of 2023 and 2024 starts), for the full calendar years 2010 through 2025. Data begins in 2010 (earliest year with two prior full years of starts data); the 2026 bar (annualized from the first half) is shown for continuity but excluded from the correlation. Because net deliveries subtract demolitions and conversions, which are large relative to completions in retail, the correlation is lower than the 0.95 to 0.99 measured for office, industrial, and multifamily.
Vacancy Rate vs. Availability Rate
Vacancy rate represents the percentage of total inventory that is physically vacant at period end. Availability rate is a broader measure that includes vacant space plus occupied space listed for sublease or anticipated to become available at lease expiration. The gap between availability and vacancy was approximately 45 bps at Q2 2026 (4.8% availability against 4.4% vacancy), down from roughly 180 bps in 2010.
Retail Universe & Rent Data
CoStar’s all-retail universe includes general/freestanding, malls, power centers, neighborhood centers, strip centers, and all other retail formats; it totals approximately 11.7 billion SF as of Q2 2026 and is broader than brokerage shopping-center series, so vacancy and rent figures are not directly comparable across sources. Market asking rent represents the CoStar-weighted average asking rent per SF across the full retail inventory. Rent growth data begins in 2008.