
U.S. Retail Regional Divergence: Low Vacancy, Southern Construction
This analysis covers all 45 U.S. metropolitan areas with retail inventory exceeding 100 million SF each. MSAs located in the South region (see list of MSAs: retail-regional-divergence.xlsx, Market Detail tab) accounted for 55% (19.5 million of 35.5 million SF) of gross retail space delivered in the trailing twelve months through June 2026 (Q2 2026), and 62% of net deliveries (14.4 million of 23.2 million SF).[1] The South’s inventory-weighted vacancy rate stands at 4.5%, compared to 3.9% in the Northeast, 4.3% in the Midwest, and 5.1% in the West. Total vacancy among this data set is 4.5%.[1]
Four of 45 major markets experienced negative asking rent growth in the last 12 months: Los Angeles, Portland, and Pittsburgh at –0.7% and San Diego at –0.4%. Under-construction SF represents 0.5% of inventory across the 45 markets, ranging from 0.2% in the Northeast to 0.8% in the South.[1]
Retail Market Explorer: All 394 CoStar Metros (Q2 2026)
Narrow the table by inventory size and Census region, sort on any column, and tick one market or several to chart their deliveries, absorption, vacancy, and construction pipeline since 2016, combined or side by side. The table opens on all 394 metros, largest first, with the three largest charted; the regional charts and commentary below cover the 45 markets with 100M+ SF of inventory. Net delivered SF subtracts demolished and converted space and is negative where removals exceeded completions.[2]
Retail Gross Deliveries by Census Region: Trailing 12 Months (Q2 2026)
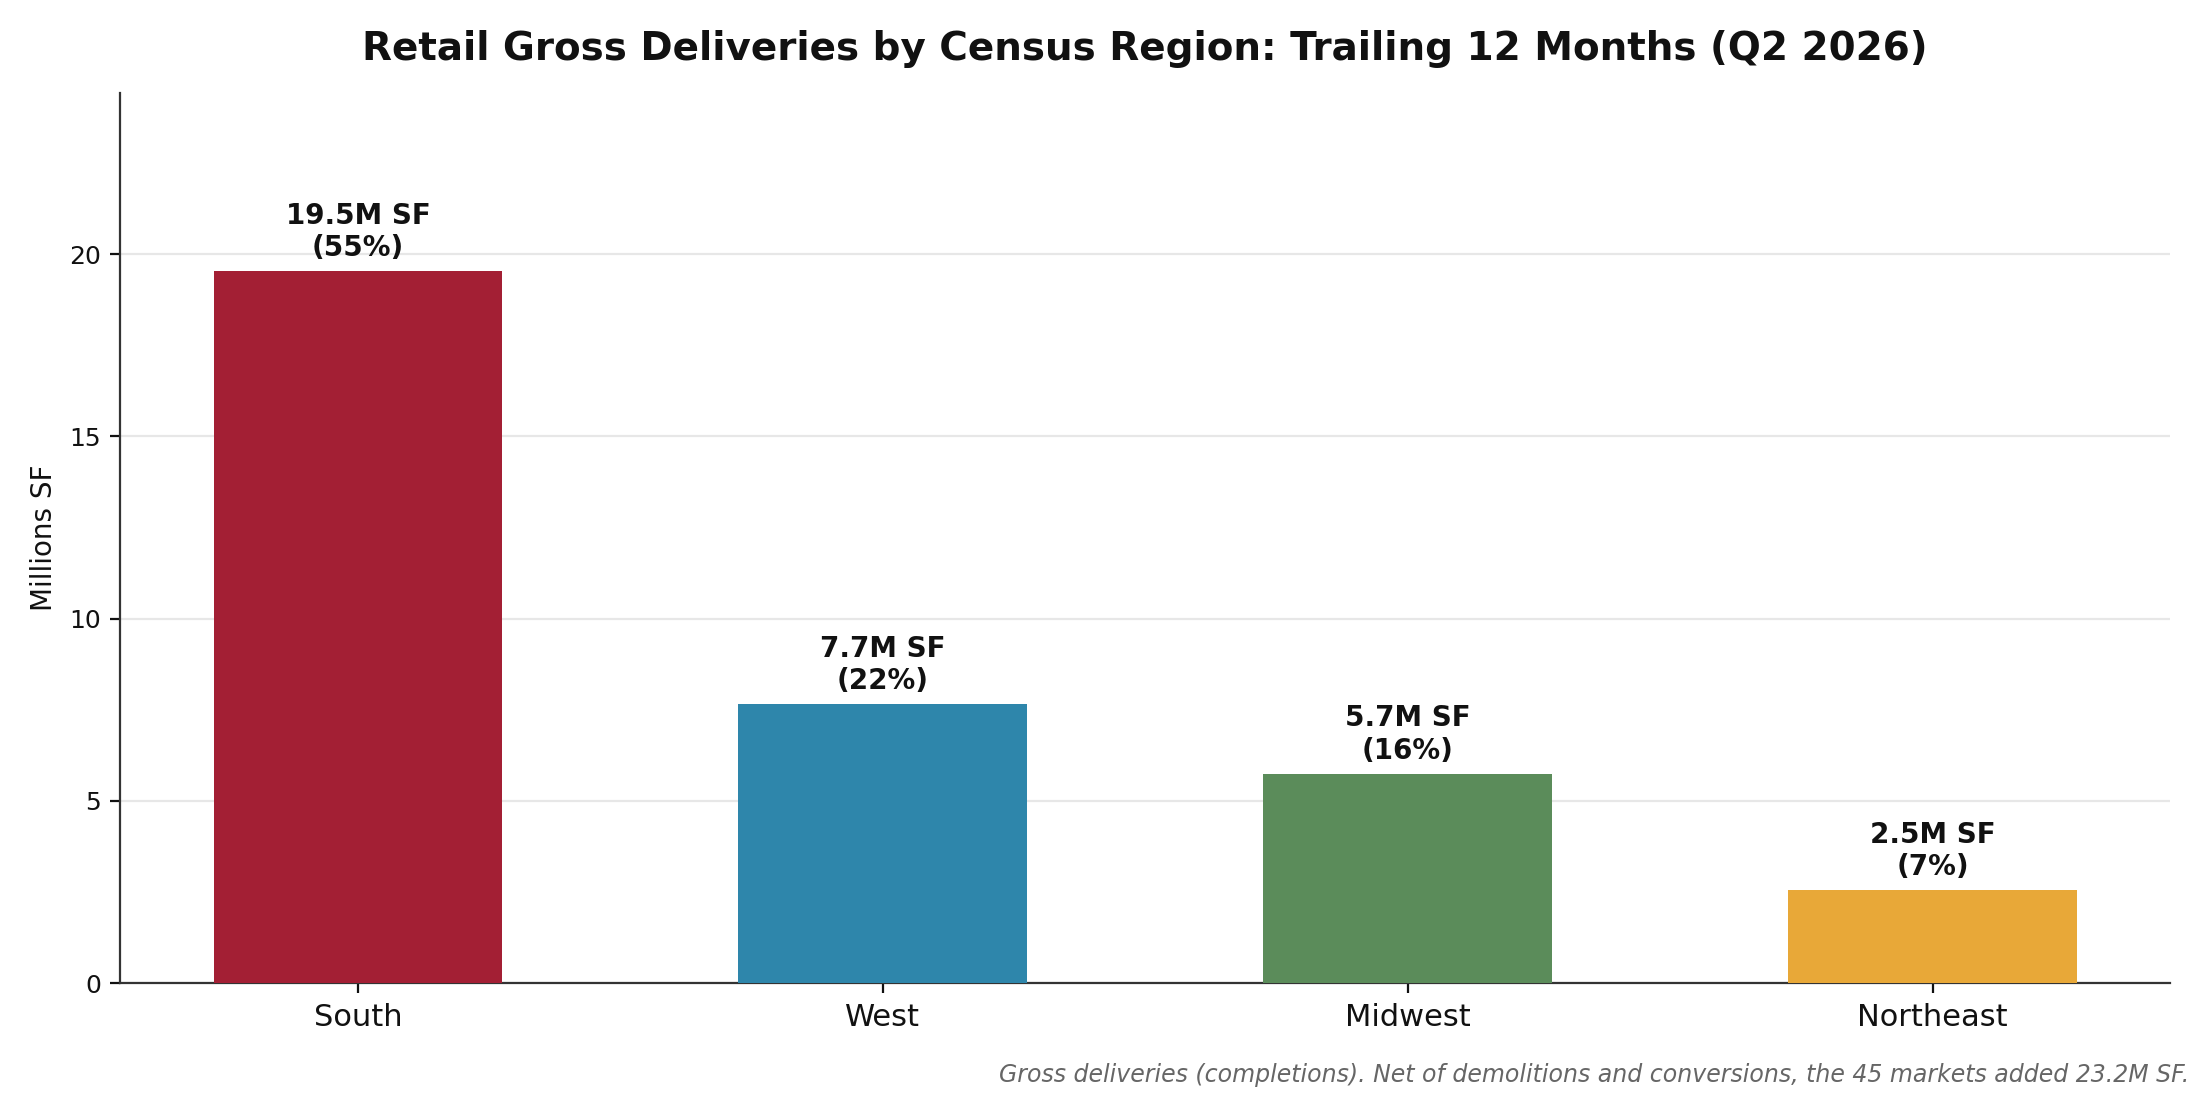
Source: CoStar, Q2 2026. Gross deliveries (completions) across 45 MSAs with 100M+ SF retail inventory, grouped by Census region. Net of demolitions and conversions, the 45 markets added 23.2 million SF.
Retail Vacancy Rate by Census Region: Inventory-Weighted (Q2 2026)
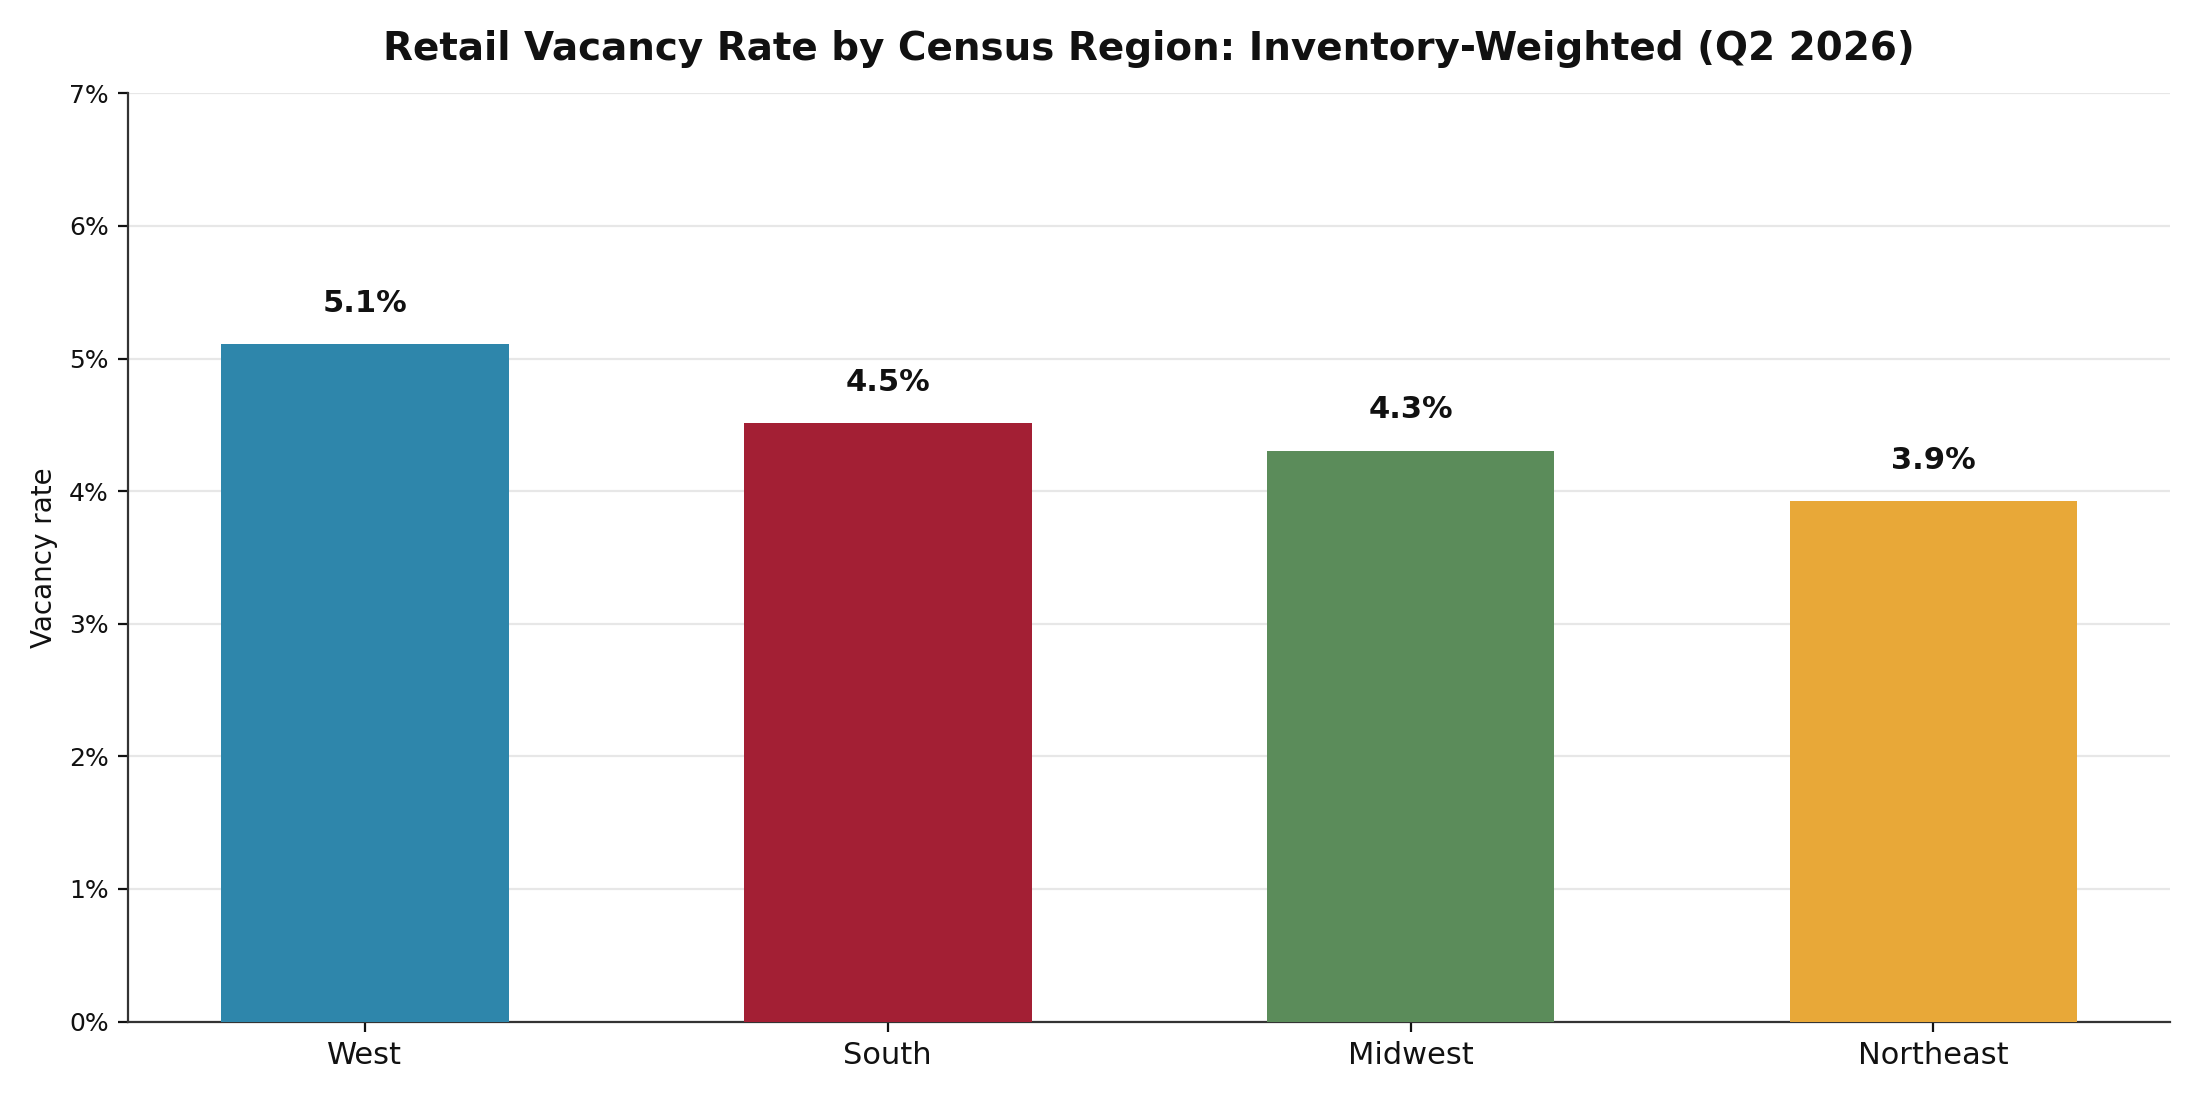
Source: CoStar, Q2 2026. Weighted by inventory SF across 45 MSAs with 100M+ SF retail inventory.
Retail Asking Rent by Census Region: Inventory-Weighted (Q2 2026)
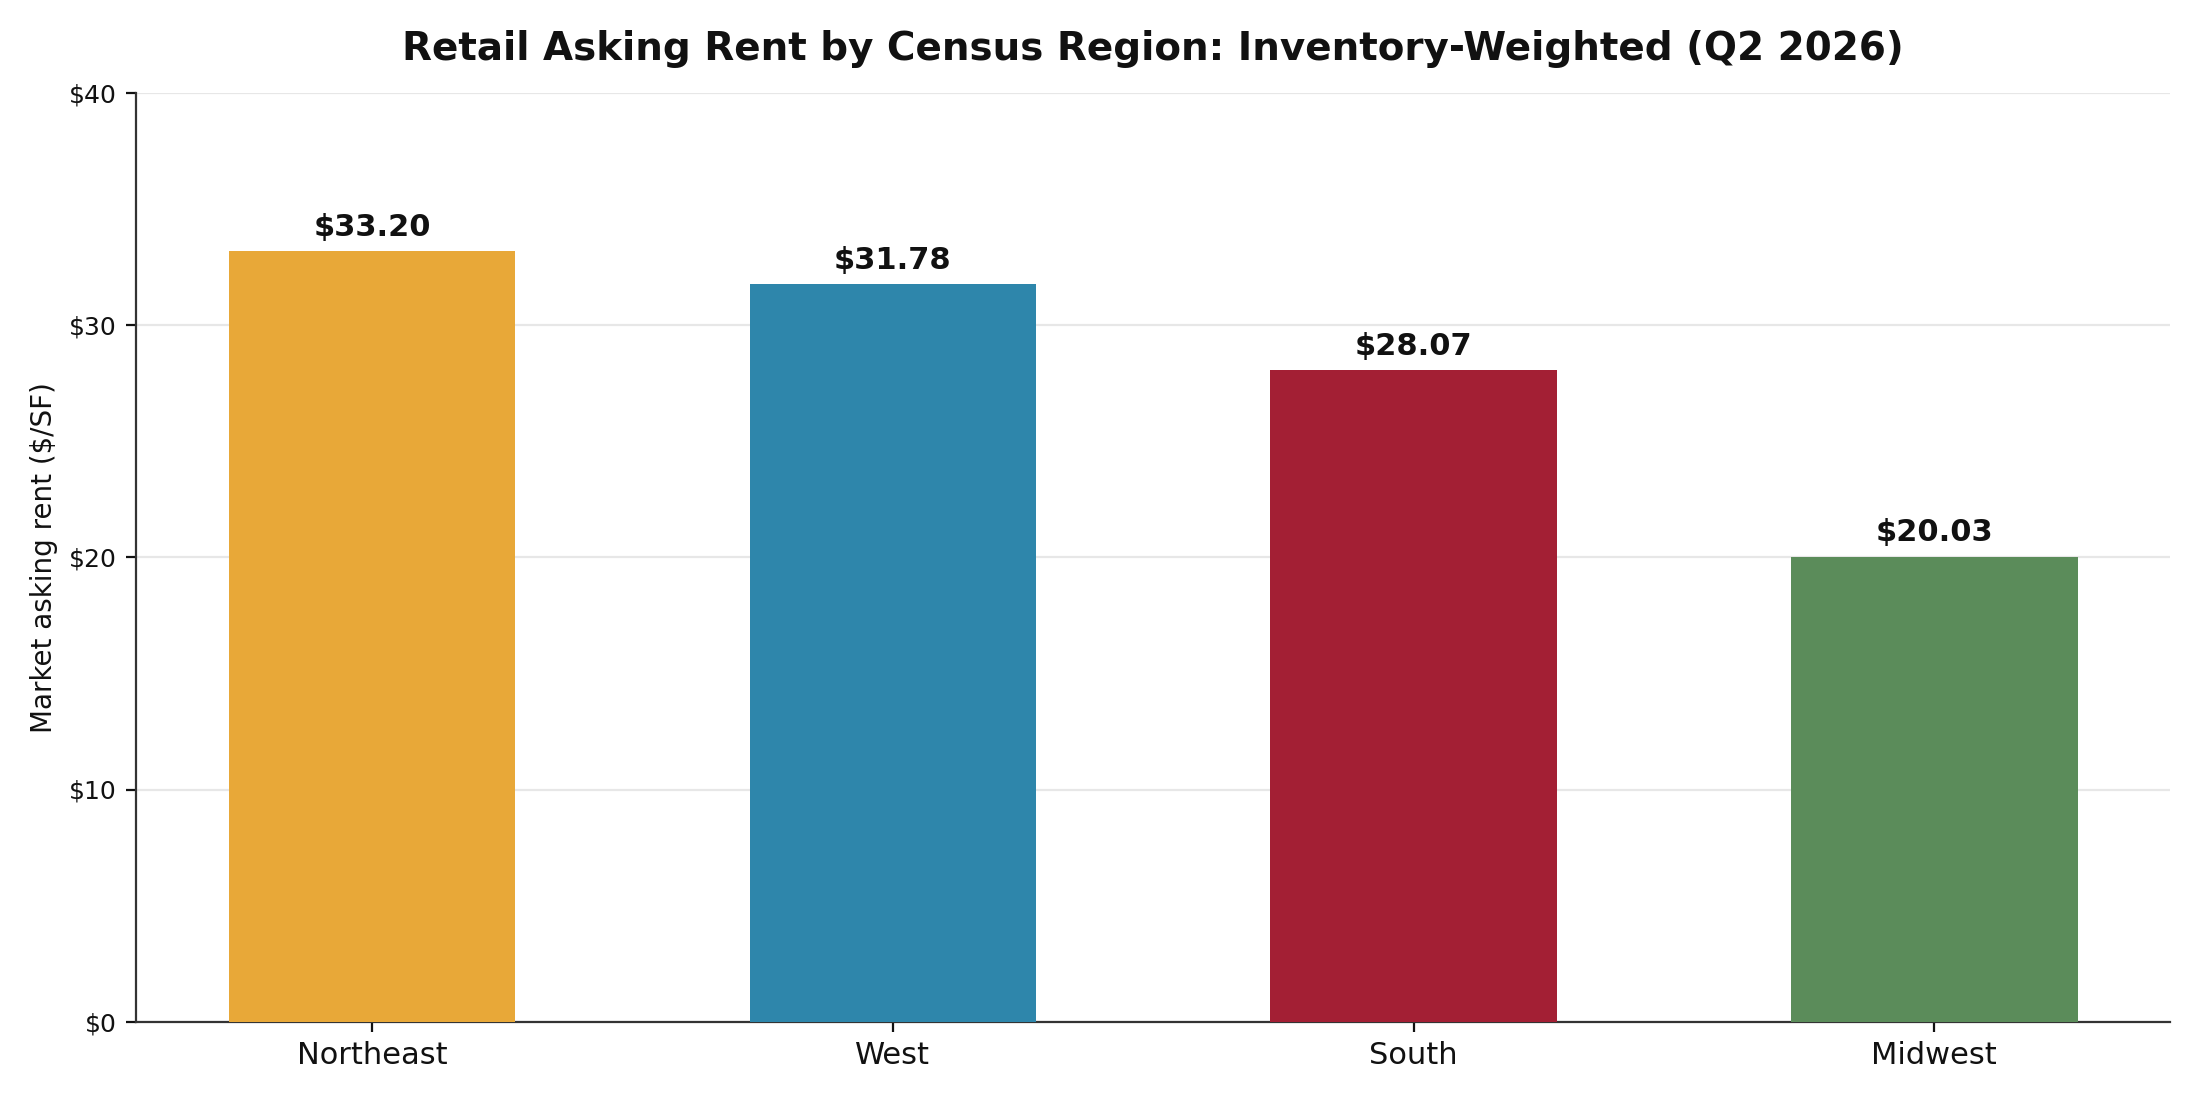
Source: CoStar, Q2 2026. Market asking rent per SF, weighted by inventory SF across 45 MSAs with 100M+ SF retail inventory.
Key Observations
What to Watch For in 2026 and Beyond
Sources to Track U.S. Retail Regional Dynamics in 2026:
| Source | Report / Series | Frequency | Notes |
|---|---|---|---|
| CoStar | Quarterly MSA-level retail update | Ongoing (subscription) | Vacancy, rents, deliveries, starts, and absorption for 394 MSAs |
| U.S. Census Bureau | Population Estimates Program, metro areas | Annual, March | Metro population change, the demand driver behind regional retail construction |
| Coresight Research | Store Tracker | Weekly, with annual reviews | U.S. store openings and closures by retailer |
Notes
[1] CoStar. U.S. Retail Market Data, All MSAs (as of Q2 2026; quarterly history 2016 Q1 through 2026 Q2, exported August 2026). costar.com. Includes trailing-twelve-month data for all 394 CoStar metros; the regional charts use the 45 MSAs with 100 million+ SF retail inventory. Regional aggregations by CRE42 using Census region definitions (Northeast, Midwest, South, West). Vacancy and availability rates are inventory-weighted. Washington, D.C. and Baltimore are classified as South per Census convention. ↩
[2] Flow figures on this page (deliveries, net absorption, construction starts) are trailing twelve months to June 30, 2026, unless a chart or table says otherwise; stocks and rates (inventory, vacancy, availability, under construction, asking rent, occupancy, sale price) are the Q2 2026 quarter-end readings. Gross deliveries are completions; net deliveries subtract demolished and converted SF. ↩
Companion workbook. retail-regional-divergence.xlsx: regional summary, 45-market detail (vacancy, availability, rents, gross and net deliveries, sale prices), all 394 metros at Q2 2026, and the 2016–Q2 2026 annual history behind the market explorer. CoStar, Q2 2026.
Methodology & Data Notes
Data Source & Regional Classification
Market-level data sourced from CoStar’s U.S. Retail dataset as of Q2 2026 (quarter ended June 30, 2026), the same vintage as the national supply cycle page. The dataset includes 394 metros; the regional charts filter to the 45 MSAs with retail inventory of 100 million+ SF each, representing approximately 8.8 billion SF, while the market explorer carries all 394. CoStar’s metro-level retail universe is broader than its national retail series, so metro inventories are not summed against the national total. Markets were assigned to Census regions (Northeast, Midwest, South, West) by CRE42 based on the primary state of each MSA. Washington, D.C. and Baltimore are classified as South per Census convention.
Weighted Averages
Regional vacancy and availability rates are calculated as inventory-weighted averages: the sum of (rate × inventory SF) for all markets in the region, divided by total regional inventory SF. Regional rents and sale prices are calculated using the same inventory-weighted approach. This methodology ensures that larger markets exert proportionally greater influence on regional averages.
Gross vs. Net Deliveries
The deliveries-by-region chart plots gross deliveries (completions) over the trailing twelve months. CoStar’s net delivered SF subtracts demolished and converted space; across the 45 markets, 12.3 million SF was removed against 35.5 million SF completed, so net deliveries were 23.2 million SF. The explorer table and chart use net delivered SF. Both series are on the Market Detail and Quarterly Deliveries tabs of the companion workbook.
Market Explorer
Table values are CoStar figures at Q2 2026; “TTM” columns are the trailing twelve months to June 30, 2026. Net delivered SF is gross deliveries less demolitions and conversions. Under construction as a percentage of inventory is under-construction SF divided by inventory SF. The chart plots each calendar year 2016–2025 as the trailing twelve months to Q4 (so deliveries and absorption are full-year flows, and vacancy and the pipeline are year-end readings), plus the trailing twelve months to Q2 2026. The aggregate chart combines ticked markets by summing square feet and recomputing vacancy, occupancy, and the pipeline share on the combined inventory, with asking rent inventory-weighted; the comparison chart draws one line per market, up to five, on the chosen metric. Both series and the chart’s inputs are on the All Metros Q2 2026 and Annual History tabs of the companion workbook.