Overview
Physical automation has been displacing blue-collar workers for over sixty years. Mechanized equipment started augmenting and replacing farm labor generations ago, industrial robot arms have welded car frames since 1961, and autonomous mobile robots have moved warehouse inventory since 2012.
Manual labor automation has been gradual but consistent over the last fifty years or so, but may be on the precipice of an accelerated growth cycle as robotics engineers make progress using generative AI to confront age-old constraints. This process is in its early stages and the timing and trajectory of this advancing technology remain uncertain.
Physical AI is running several years behind AI’s impact on knowledge work, mainly due to the relative lack of training data and the limitations on scale inherent in physical operations. Companies such as DoorDash, Uber, and Sunday Robotics are attempting to close the training data gap by paying gig workers to film themselves doing household chores, wearing sensor gloves, and recording physical tasks to generate this training data at scale.[1]
Significant progress in robotic AI suddenly seems possible with the AI revolution in full swing, leading to a rapid escalation in VC investment in the field. Annual humanoid VC ranged between $0.1 billion and $1.7 billion for nine years (2016 through 2024), then jumped to $4.8 billion in 2025, nearly triple the prior record. The first four months of 2026 alone brought $5.1 billion, already exceeding all of 2025 (PitchBook, data as of April 29, 2026). The broader robotics and physical AI sector attracted $27.7 billion across 1,009 deals in 2025, double the 2024 total, putting humanoids at roughly one in six sector dollars.[17][6][11]
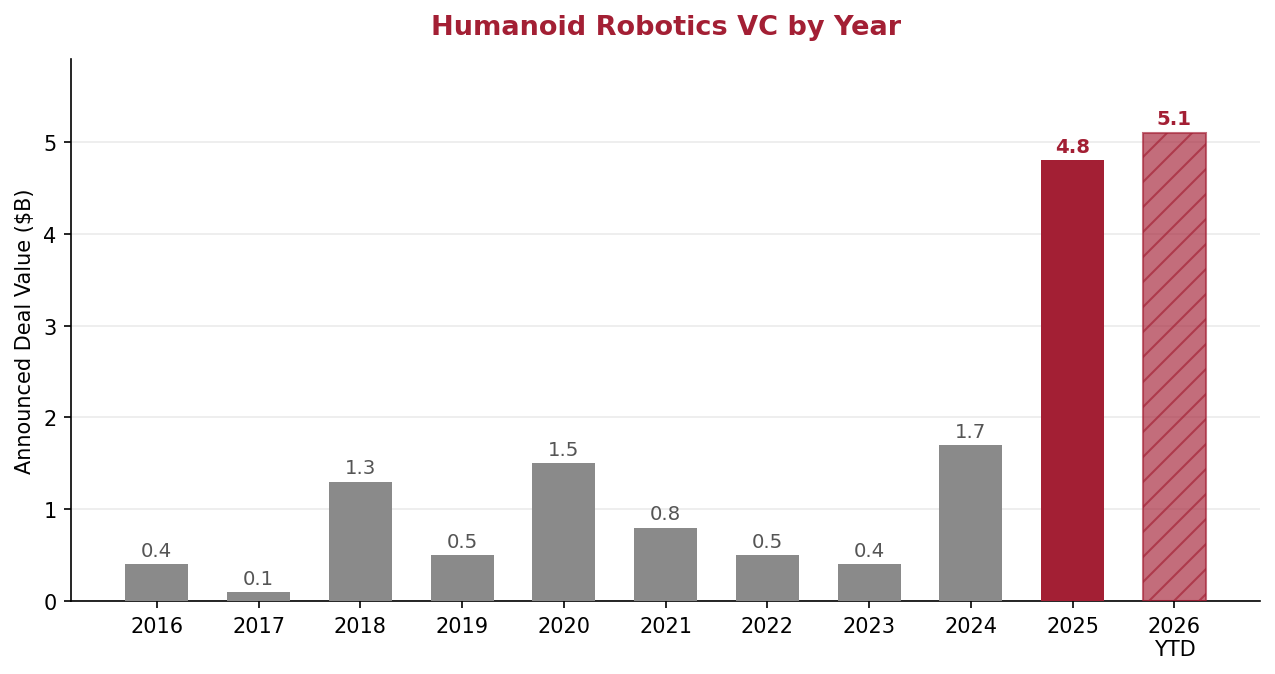
Humanoid Robotics VC by Year, 2016–2026 YTD (announced deal value, $B, global) | Source: PitchBook, as published in “The limits of VC’s humanoid bet”; data as of April 29, 2026. 2026 bar is partial year. Values transcribed from PitchBook’s published chart.
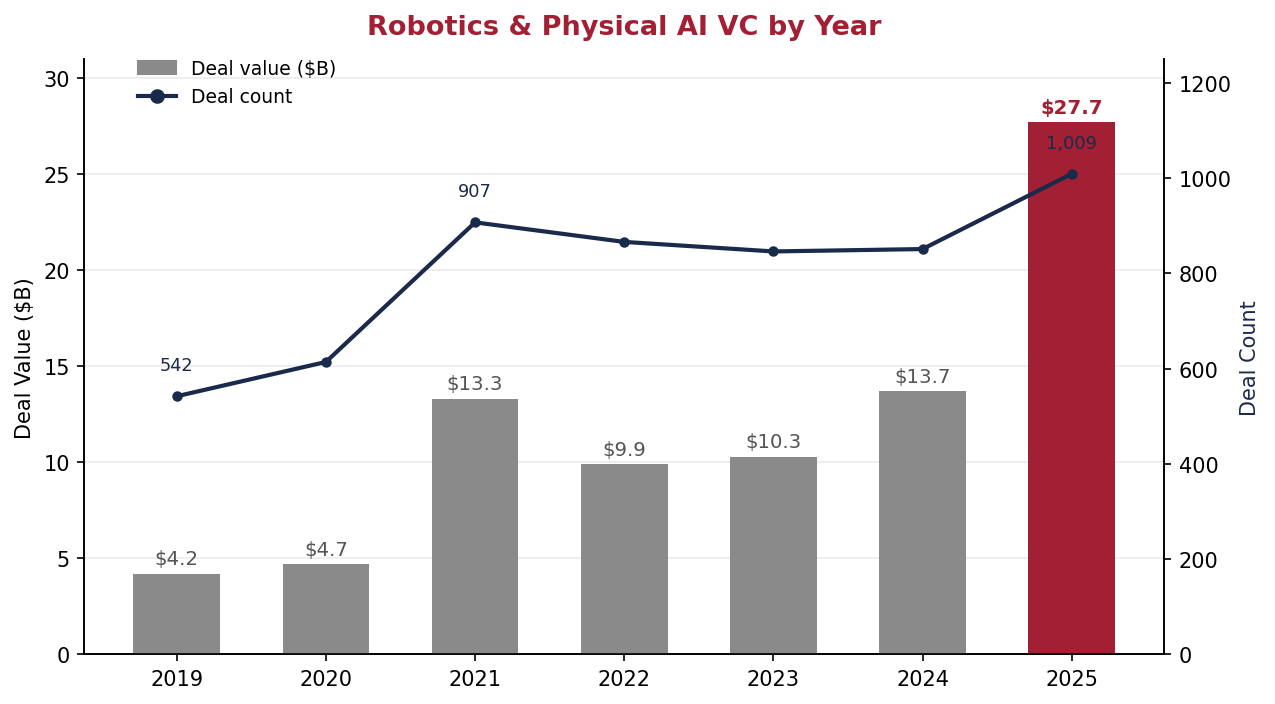
Robotics & Physical AI VC by Year, 2019–2025 (deal value $B and deal count, global) | Source: PitchBook, Q4 2025 Robotics & Physical AI VC Trends (published Mar 19, 2026); data as of December 31, 2025.
Within the 2025 total, defense and security robotics led with $8.0 billion across 234 deals, including $6.2 billion for uncrewed aerial systems. Industrial robotics followed at $5.9 billion, up 70% year over year, led by assembly and manufacturing robots at $4.2 billion. Robotics software and AI raised $3.4 billion, including $2.5 billion for AI autonomy platforms, anchored by Physical Intelligence’s $600 million round at a $5.4 billion post-money valuation. Logistics and warehousing robotics declined 28.5% to $1.2 billion, a notable rotation of venture capital away from the maturing warehouse AMR category even as deployed systems scale.[17]
Document Links
technology-ai-blue-collar.xlsx — Robotics timeline, IFR installation data, robot density by country, humanoid company landscape, technical constraints scorecard, job displacement data, occupation automation risk matrix, demographics–technology race data, humanoid VC investment sources
Robotics & Physical AI: Binding Constraints[10]
Why is physical AI years behind software AI? The constraints are not primarily computational — the same GPU clusters that train language models can train robot policies. The constraints are physical and institutional, and they cluster around three core problems.
- Bipedal locomotion on structured surfaces (factory floors, flat warehouses) is largely solved — Boston Dynamics’ Atlas can run, jump, and perform dynamic maneuvers, and multiple commercial platforms navigate indoor environments reliably.
- Pattern recognition and perception in controlled settings have improved dramatically through foundation models like RT-2 and π0, enabling robots to identify and interact with novel objects without explicit programming.
- Communication between robots and human operators through natural language is functional, powered by the same LLM architectures that drive ChatGPT and Claude.
The unsolved problems are primarily about physical interaction with unpredictable environments — the domain where the real world is most different from the digital one (see LLMs, World Models, and VLA Models below).
Measuring Physical AI Progress: Early Milestones and Task Benchmark Results
There is no standard scoreboard for humanoid robots. Software AI has benchmark suites such as MMLU and GPQA and independent aggregators that test every major model the week it ships. Nothing comparable exists for physical AI: testing a robot requires possessing the hardware, a lab, and weeks of work per platform, and most leading humanoids are not for sale. The result is that after four years and tens of billions of dollars of investment, the first independent measurement efforts all appeared within a six-week window in May and June 2026. The field today resembles LLM benchmarking circa 2020, before standard leaderboards existed: capability claims are press releases and demonstration videos, and apples-to-apples comparison across robots is not yet possible.
The individual measured results that do exist are presented below as standalone data points, each with its own source and test conditions. They should not be combined into a single comparison.
Market Forecasts and Timeline Estimates
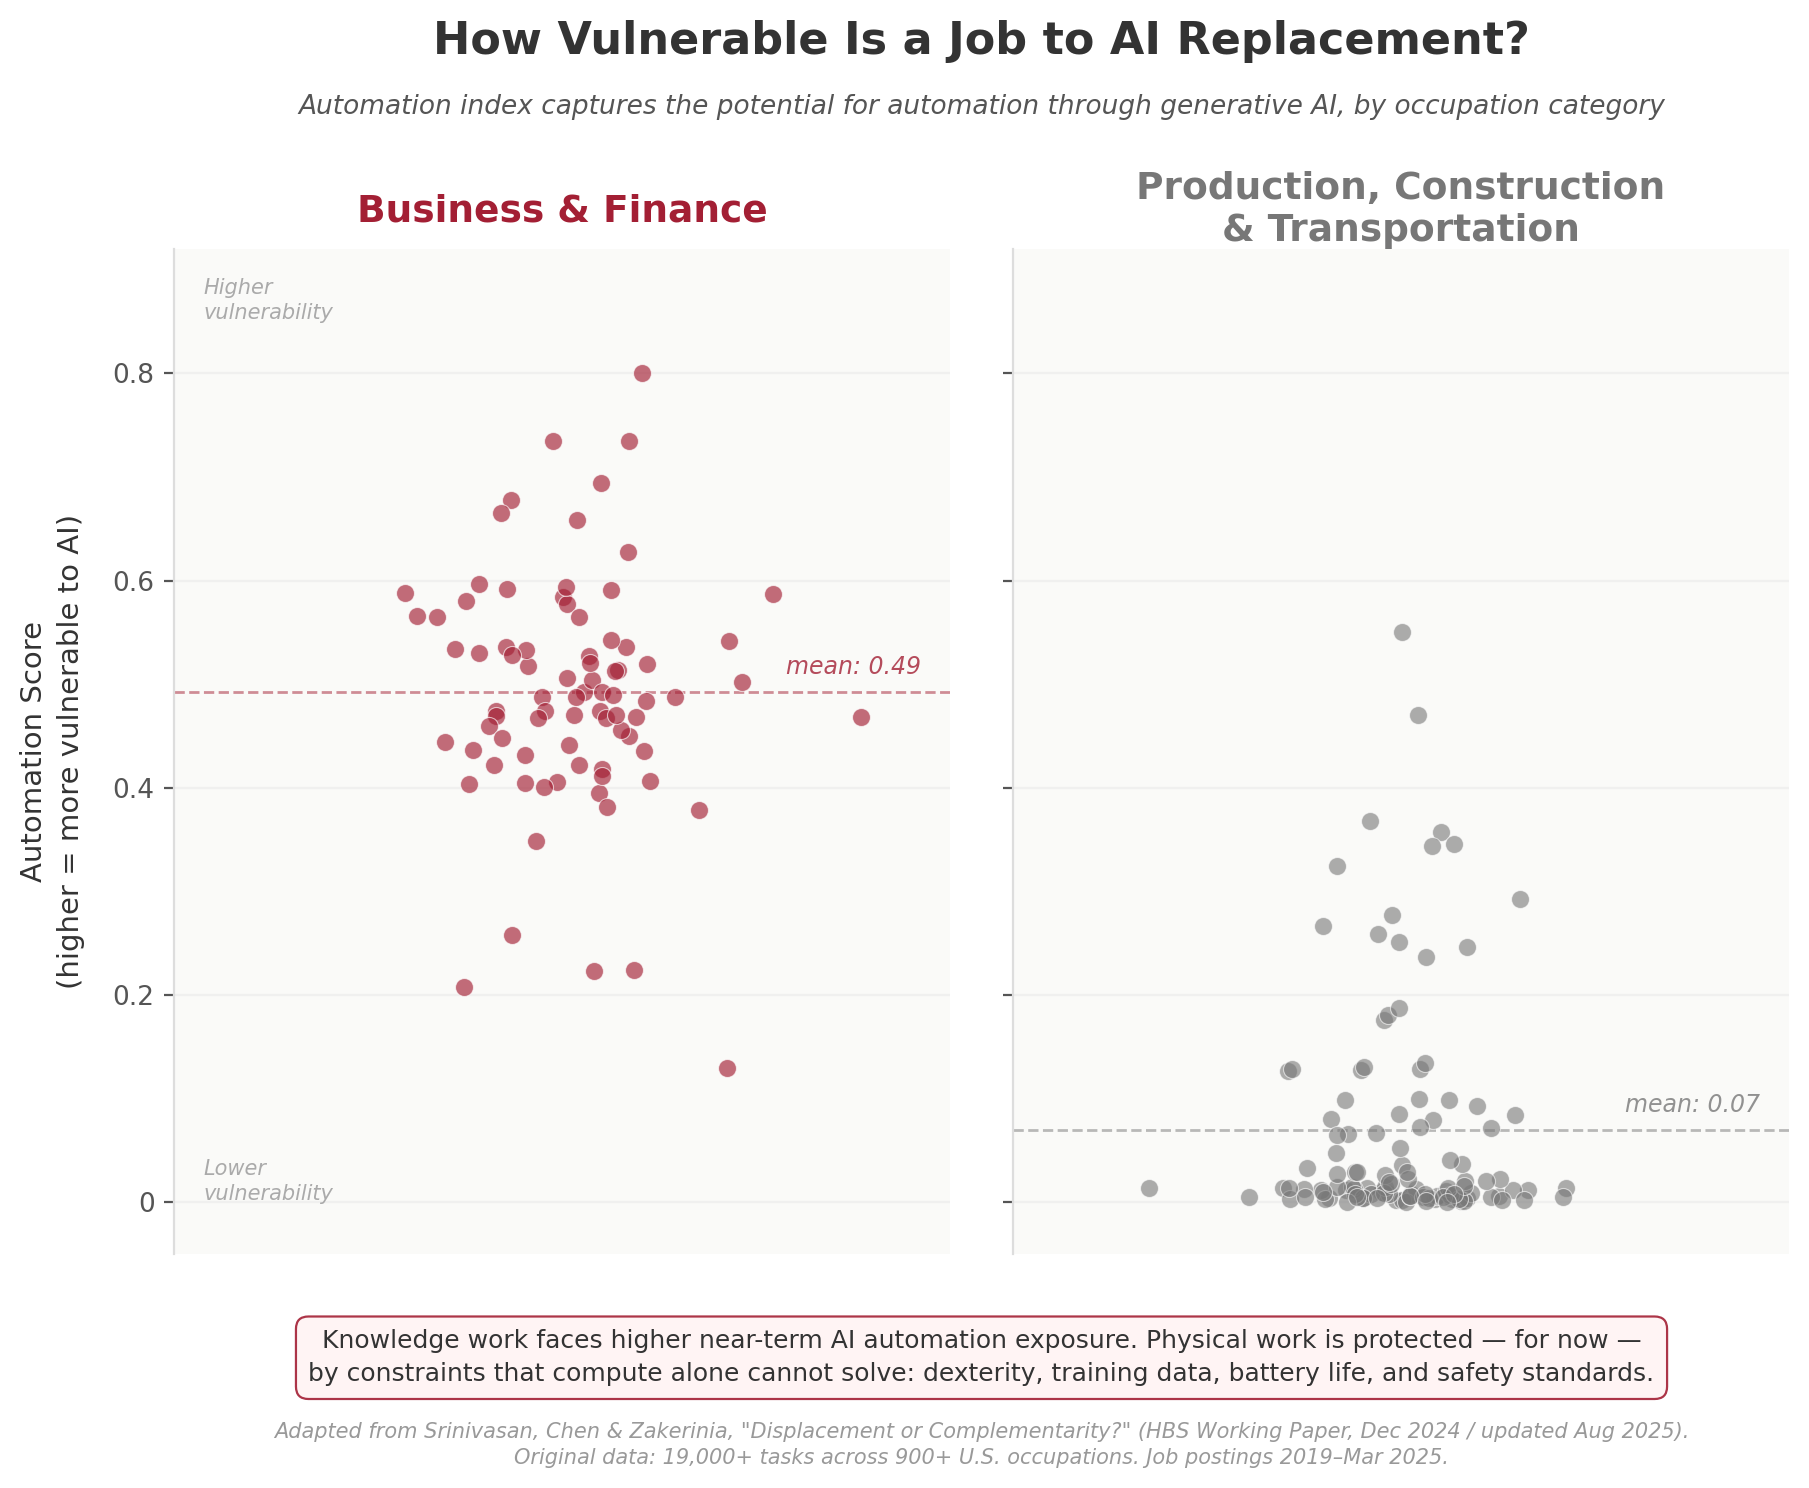
AI Automation Vulnerability by Occupation Category | Adapted from Srinivasan, Chen & Zakerinia, “Displacement or Complementarity? The Labor Market Impact of Generative AI” (HBS Working Paper, Dec 2024 / updated Aug 2025). Original data: 19,000+ tasks across 900+ U.S. occupations scored using OpenAI ChatGPT. Job postings 2019–Mar 2025.
Knowledge work appears to be more exposed to AI automation than physical work based on currently available technology. An HBS study scoring 19,000+ tasks across 900+ U.S. occupations found that business and finance roles average 0.49 on its automation index, while production, construction, and transportation roles average 0.07.[9] The reason is the set of physical constraints described above: dexterity, training data, battery life, safety standards, and maintenance infrastructure.
The chart above illustrates the high potential exposure business and finance jobs have to AI based automation compared to the much lower current exposure levels for more physically focused jobs in the production, construction, and transportation sectors.
What the HBS score does and does not measure. The study scores each occupation’s tasks on whether generative AI software can perform them. A model’s outputs are text, code, images, and analysis, so a task like preparing financial statements scores high, while a task like laying a weld bead scores near zero: no software output can actuate in the physical world. The score is therefore a faithful measure of software exposure, not a general measure of automation risk. Three occupations make the distinction concrete. Welders score 0.04 on the HBS index despite being the most thoroughly automated occupation of the twentieth century, with robotic arms welding in every major auto plant since the 1980s. Industrial truck operators score 0.00 while automated guided vehicles displace forklift drivers in warehouses today. Stockers and order fillers score 0.33, well above welders, because the index detects the clerical fraction of their work, the inventory records and scheduling, not the physical picking.
This is Moravec’s Paradox in a 2025 dataset: tasks humans find hard, such as tax analysis, are easy for AI, while tasks a toddler finds easy, such as picking up an oddly shaped object, remain hard for machines. The software wave and the physical wave are different technologies on different timelines. This page covers the second one, and the constraints and measurements above describe where it actually stands.
Select Estimates and Projections – Robotics and Physical AI Automation
| Source | What They Estimate | Market / Shipment Figures | Labor Impact Estimate | Horizon | Key Caveat |
|---|---|---|---|---|---|
| HBS (Srinivasan et al., Dec 2024 / Aug 2025) | AI automation vulnerability by occupation (19,000+ tasks, 900+ occupations) | N/A | Post-ChatGPT: automation-prone job postings −13%; augmentation-prone postings +20%. Business & finance automation score: 0.49 mean. Production/construction/transport: 0.07 mean. | 2019–Mar 2025 | Empirical observation, not forecast. Measures actual job posting changes. Focuses on generative AI (software), not physical robotics. Physical work scores near zero because the technology to automate it at scale doesn’t exist yet. |
| iCapital / Multi-Bank Consensus (Aug 2025) | Humanoid adoption & TAM (average of BofA, Citi, Morgan Stanley, UBS base cases) | TAM ~$4.5T by 2050; ~1M units by 2030; ~25M by 2035; ~800M by 2050. BoM ~$40K by 2026, ~$10K by 2040. | 5 in 10 U.S. manufacturing positions expected vacant through 2033; China faces 22% labor force decline by 2050. Humanoids could boost manufacturing efficiency 20–30% in 5 years. | 2025–2050 | Consensus average across four major banks. Three adoption phases: industrial (2025–2030), services & healthcare (2031–2035), household/societal (2036+). VC: $3.1B in H1 2025 > $2.9B entire 2010–2024 period. ~10% U.S. household adoption by 2050. |
| Goldman Sachs (Jan 2024 + Mar 2026) | Humanoid robot market; AI labor impact | $38B market by 2035; 250K+ units by 2030; 1.4M units by 2035; 70% CAGR | 6–7% of U.S. workers displaced over ~10 years; AI can automate 25% of U.S. work hours; 0.6pp unemployment increase if adoption spread over a decade[5] | 2024–2035 | Market estimate revised 6× upward from prior $6B estimate after costs declined 40%. Mar 2026 update: displaced knowledge workers may be poorly suited for the labor most needed (HVAC, electricians, construction). Data center build-out has already created 216,000 construction jobs since 2022. |
| Morgan Stanley (Apr 2025) | Total humanoid ecosystem (hardware + supply chain + services) | $5T by 2050; 1B+ units; 13M units by 2035 | U.S.: 8M humanoid workers by 2040 ($357B wage impact); 63M by 2050 ($3T payroll, 75% of occupations, 40% of employees affected) | 2025–2050 | 25-year forecast. Adoption “relatively slow” until 2035, then accelerating. $5T includes entire ecosystem. Consumer home applications a decade away. 10% of U.S. households may own a humanoid by 2050. |
| IFR (Sep 2025) | Industrial robots (all types — not just humanoid) | 542K annual installs (2024); 4.66M operational stock; 575K projected for 2025; 700K+ by 2028 | N/A — IFR reports installations, not labor impact | Actual through 2024 | Measured, not forecasted. Humanoids are ~3% of annual volume. This is the installed base doing real work in factories today. |
| Counterpoint Research (Jan 2026) | Humanoid robot shipments | ~16K units in 2025; China = 80%+; 100K+ cumulative by 2027; 69.7% CAGR to 2030 | N/A | 2025–2030 | Most 2025 units are developer kits, research platforms, and entertainment deployments — not robots doing productive autonomous work. “Units shipped” ≠ “units deployed productively.” |
| ABI Research (Jul 2025) | Humanoid market size & units | $6.5B by 2030; 138% CAGR; 115K units by 2027 | N/A | 2024–2030 | More conservative near-term than Goldman. Market “heats up” in 2027, not 2025–2026. Inflection depends on regulatory, safety, and ROI issues being resolved. |
| Deloitte (Nov 2025) | Industrial robot installed base (all types) | 5M+ cumulative by 2025; 5.5M by 2026 | N/A | 2025–2026 | Conservative. Growth stays “relatively modest” without solving data quality, integration, and cybersecurity bottlenecks. |
Constraints, Timelines, and Jobs at Risk
The path to mass robotic deployment includes the physical and informational constraints described above, as well as unit economics, safety certification, maintenance infrastructure, and regulatory framework. The table below summarizes some of the key hurdles to large-scale robotic utilization as well as projected solution timelines from select organizations covering the ongoing development of this field.
The Demographics–Technology Race
In rapidly aging economies, labor shortages may accelerate robot adoption faster than pure cost economics would predict. Acemoglu & Restrepo (2020) found “greater robot adoption in countries with more rapid demographic change” — countries aging fastest are automating fastest, not because robots are cheap but because workers are scarce. South Korea, with the world’s lowest total fertility rate (0.72 in 2023), leads the world in robot density at 1,012 robots per 10,000 manufacturing workers. Japan (median age 49, TFR 1.2) and Germany (median age 46.6, TFR 1.46) follow. China, entering the same demographic trap as Japan and Korea but at lower per-capita income, has responded with the most aggressive government robotics policy (MIIT 2023–2025 humanoid plan). In May 2026, China’s 15th Five-Year Plan placed robotics at the center of its industrial strategy; China’s operational robot stock of roughly 2 million units is about 4.5 times Japan’s, the global number two.[16]
The United States (median age 38.9, TFR 1.62) ranks 10th globally in robot density at 295 per 10,000 workers. Baby Boomer retirements (roughly 10,000 Americans per day reaching age 65 from 2010 through 2030) combined with post-2025 immigration policy uncertainty create labor supply risk concentrated in sectors that already struggle to fill positions: agriculture, food processing, construction, and warehouse logistics. Whether the U.S. fills these gaps through immigration policy, automation, or some combination will be among the most consequential labor market questions of the next decade — with direct implications for CRE demand across industrial, retail, and multifamily property types.
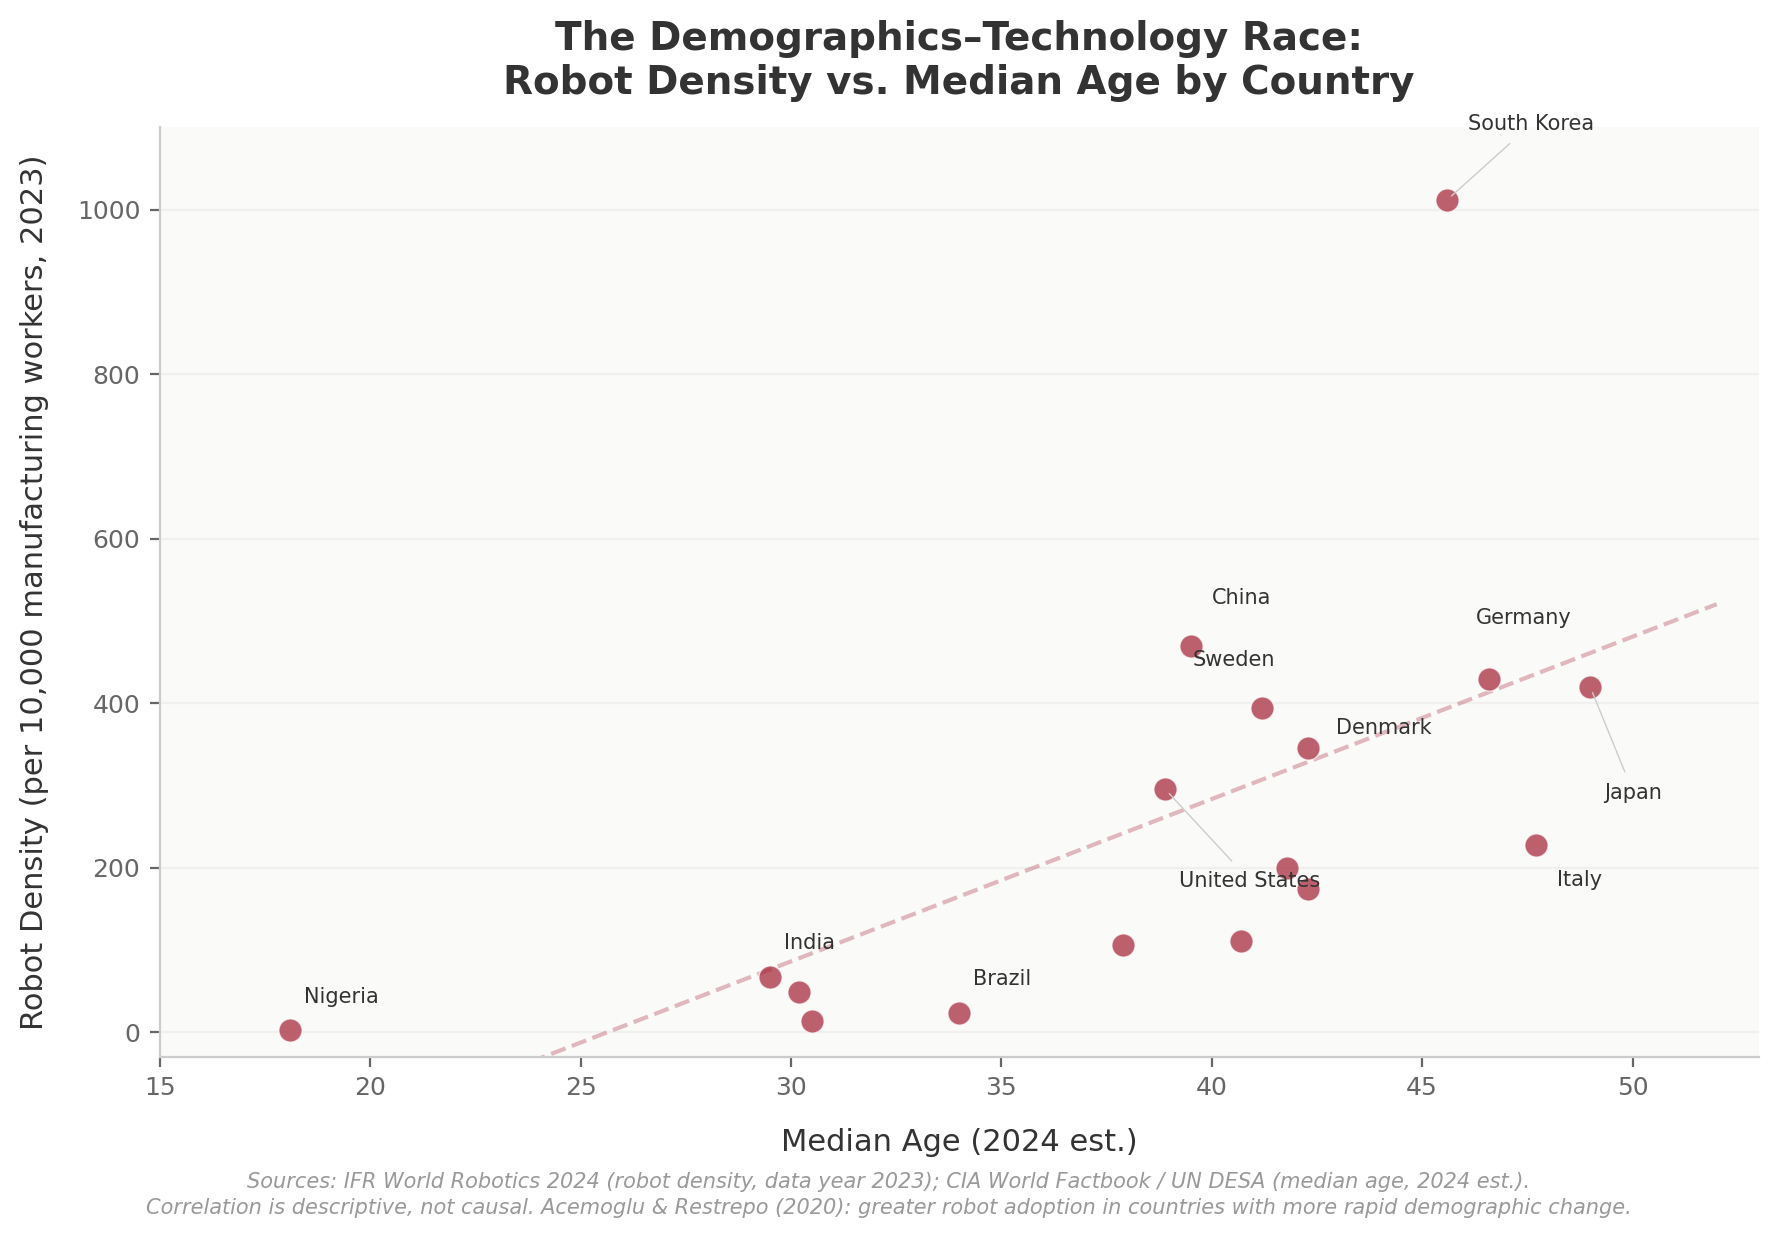
The Demographics–Technology Race: Robot Density vs. Median Age by Country | Sources: IFR World Robotics 2024 (robot density, data year 2023); CIA World Factbook / UN DESA (median age, 2024 est.)
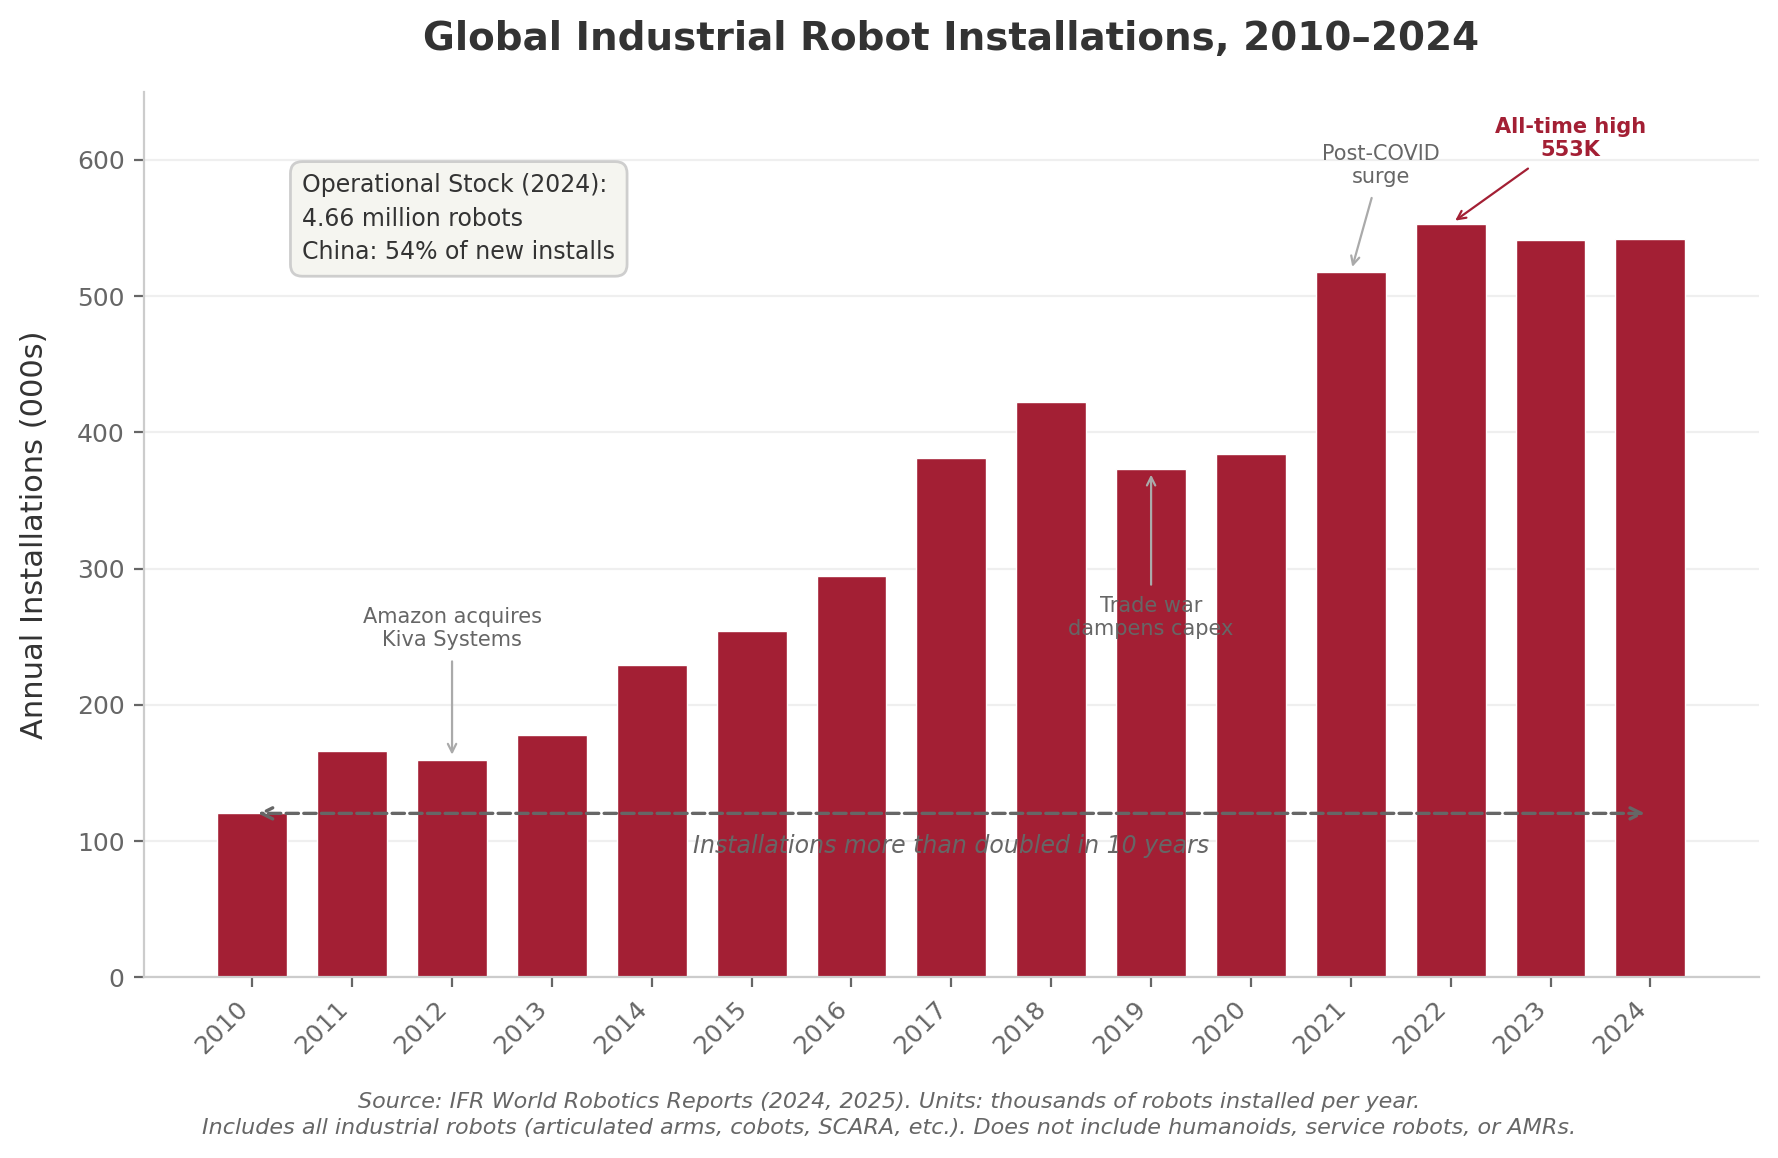
Global Industrial Robot Installations, 2010–2024 (000s of Units) | Source: IFR World Robotics Reports (2024, 2025). Includes all industrial robots (articulated arms, cobots, SCARA, etc.). Does not include humanoids, service robots, or AMRs.
While humanoid investment surges, conventional industrial robots are the machines actually reshaping labor markets today. Annual installations more than doubled over the past decade, reaching 542,000 units in 2024 — the second-highest year on record and the fourth consecutive year above 500,000. The total operational stock reached 4.66 million robots worldwide, up 9% year-over-year, with China accounting for 54% of new installations.[8] For comparison, total global humanoid shipments in 2025 were approximately 16,000 units (Counterpoint Research) — roughly 3% of a single year’s industrial robot installations. The IFR projects installations will reach 575,000 in 2025 and surpass 700,000 by 2028. Electronics overtook automotive as the largest customer industry for the first time in 2024, with 128,900 units installed.
What to Watch in 2026
| Subject | Key Source(s) | Expected Next Release |
|---|---|---|
| Global industrial robot installations | IFR World Robotics Report | Annual; next release Sep 2026 (2025 data) |
| Humanoid robot shipments & market share | Counterpoint Research Humanoid Tracker | Periodic; last published Jan 2026. Watch for mid-year update |
| Tesla Optimus Gen 3 deployment data | Tesla quarterly earnings calls | Q2 2026 results: late Jul 2026. Key questions: Fremont start of production (late Jul/Aug target) and transition from “data collection” to “useful work” |
| Humanoid robot market forecasts | Goldman Sachs Research | Periodic updates; last major labor report Mar 2026. Watch for revised humanoid market estimates based on 2025 actual data |
| Robot density by country | IFR Robot Density Data | Annual; 2024 data expected late 2026. Key: whether U.S. density is accelerating vs. Asia |
| Physical AI foundation models | Physical Intelligence (π) / NVIDIA Cosmos | Continuous; watch for cross-embodiment generalization milestones and commercial licensing |
| Independent humanoid benchmarks (new field) | NIST baseline benchmark; Fraunhofer IPA test program; DexBench (RLWRLD + NVIDIA); AGIBOT World Challenge sim leaderboard | All launched May–Jun 2026. Watch for first NIST cross-robot results and Fraunhofer tests of additional platforms; these become the field’s first comparable time series |
| Unitree Shanghai IPO | Shanghai Stock Exchange filings; company announcements | In preparation as of mid-2026. First major pure-play humanoid public listing; prospectus will provide audited unit and revenue data for the sector |
| Robotic training data investment | DoorDash Tasks, Uber AI Solutions, Scale AI | Ongoing; watch for scale of gig-worker data programs and whether data costs decline as world models mature |
[1] DoorDash launched its “Tasks” app on March 19, 2026, paying couriers to record household chores for AI/robotics training. Uber launched a comparable initiative in late 2025. Sunday Robotics ships sensor gloves to volunteers for motion data collection. Instawork recruits workers to clean homes wearing headband-mounted cameras. Sources: NBC News (Mar 20, 2026); Bloomberg (Mar 19, 2026); PYMNTS (Mar 25, 2026). ↩
[2] Bessemer Venture Partners, “Can World Models Unlock General Purpose Robotics?” (Mar 2026). ↩
[3] World Labs raised $1B at $5.4B valuation (Feb 2026); AMI Labs (Yann LeCun) raised $1.03B at $3.5B valuation (Mar 2026). Sources: Not Boring newsletter (Mar 2026); company announcements. NVIDIA Cosmos platform released progressively from CES 2025 through Feb 2026. ↩
[4] Physical Intelligence, “Our First Generalist Policy” (Oct 2024); open-sourced Feb 2025. $600M raised Nov 2025 at $5.6B valuation. The Robot Report (Nov 26, 2025). ↩
[5] Goldman Sachs Research, “How Will AI Affect the US Labor Market?” (Mar 18, 2026). Joseph Briggs, co-lead of the global economics team. Base case: 6–7% of workers displaced over ~10 years; 0.6pp unemployment increase; construction jobs exposed to data center build-out increased 216,000 since 2022; ~500,000 net new jobs needed for power demand by 2030. ↩
[6] PitchBook humanoid startup VC, global, announced deal value, data as of April 29, 2026, as published in “The limits of VC’s humanoid bet” (2026). Annual values ($B): 2016: 0.4; 2017: 0.1; 2018: 1.3; 2019: 0.5; 2020: 1.5; 2021: 0.8; 2022: 0.5; 2023: 0.4; 2024: 1.7; 2025: 4.8; 2026 YTD (Apr 29): 5.1. pitchbook.com ↩
[7] Superseded vintage, retained for the record: iCapital Market Pulse (Aug 2025) cited PitchBook at $2.9B cumulative 2010–2024 and $3.1B in H1 2025. PitchBook’s current series (as of Apr 29, 2026; see [6]) shows 2016–2024 alone at $7.2B, indicating substantial backward revision or definitional broadening between vintages. This page uses the current vintage. Largest individual rounds in 2025: Figure AI Series C ($1B+ at $39B post, Sep 2025); Apptronik Series A ($415M Feb 2025, extended by $520M Feb 2026 to $935M+). ↩
[8] IFR World Robotics Report 2025 (Sep 25, 2025). 542,000 industrial robots installed in 2024; 4.66 million operational stock worldwide; China 54% of new installations (295,000 units). Projections: 575,000 units in 2025; 700,000+ by 2028. Electronics overtook automotive as largest customer industry in 2024 (128,900 units). Global robot density: 162 per 10,000 manufacturing workers (2023 data), more than double the 2017 level (74). ↩
[9] Srinivasan, Suraj, Wilbur Xinyuan Chen, and Saleh Zakerinia. “Displacement or Complementarity? The Labor Market Impact of Generative AI.” Harvard Business School Working Paper (Dec 2024, updated Aug 2025). Study scored 19,000+ tasks across 900+ U.S. occupations using OpenAI ChatGPT to categorize automation vs. augmentation potential. Job postings 2019–Mar 2025. After ChatGPT’s launch, postings for automation-prone roles decreased 13%; postings for augmentation-prone roles grew 20%. Skills required for automation-prone roles shrank 7%. hbs.edu ↩
[11] Cross-references: BofA Global Research put FY2025 humanoid VC at $4.3B (via Fortune, Mar 13, 2026), close to PitchBook’s $4.8B under a different cut. All-robotics VC: ~$14B in 2025, up 70% from 2024 (Crunchbase News, Feb 2026); humanoids therefore represent roughly a quarter to a third of robotics VC depending on tracker, consistent with PitchBook’s “1 in every 4 dollars” (2026). ↩
[12] Tesla Q4 2025 earnings call (Jan 28, 2026): Model S/X programs ended to free Fremont capacity for Optimus; Musk acknowledged zero Optimus units doing useful work. Tesla Form 8-K (Jan 28, 2026) lists Robotics/California/Optimus capacity status as “Construction.” Q1 2026 earnings call (Apr 22, 2026): last Model S/X early May 2026; Optimus start of production late July or August 2026; initial output “quite slow”; no 2026 production target. Second Optimus factory at Giga Texas targeted for ~summer 2027. ir.tesla.com ↩
[13] Fraunhofer IPA humanoid robot benchmark, first published results (May 2026): six application-relevant criteria; Unitree G1 measured walking speeds 0.49 m/s (normal) and 0.84 m/s (fast); 3-kg payload did not reduce walking speed but slowed acceleration by tenths of a second. Human reference walking speed ~1.4 m/s. ipa.fraunhofer.de ↩
[14] Humanoid Everyday benchmark (arXiv, Oct 2025): 260 everyday tasks evaluated on real robot hardware; approximately 51% average task success across baseline systems; 0% success on high-precision insertion tasks. ↩
[15] NIST proposed baseline humanoid performance benchmark (May 2026), the first U.S. humanoid standardization effort since the 2015 DARPA Robotics Challenge. RLWRLD + NVIDIA DexBench launch (Jun 9, 2026). AGIBOT World Challenge 2026 at ICRA Vienna (Jun 2026): 526 teams from 27 countries; online simulation evaluation plus real-robot finals; public simulation leaderboard planned. ↩
[16] China 15th Five-Year Plan (May 2026), robotics positioned at the center of industrial strategy; operational stock ~2 million units, ~4.5x Japan. As reported by IFR coverage; confirm against plan text at next update. ↩
[17] PitchBook, Q4 2025 Robotics & Physical AI VC Trends (Emerging Tech Research, published Mar 19, 2026; data as of Dec 31, 2025). Annual deal value ($B) / deal count: 2019: 4.2 / 542; 2020: 4.7 / 614; 2021: 13.3 / 907; 2022: 9.9 / 866; 2023: 10.3 / 846; 2024: 13.7 / 851; 2025: 27.7 / 1,009. 2025 segment leaders: defense & security $8.0B (234 deals; UAS $6.2B); industrial $5.9B (+70% YoY; assembly & manufacturing $4.2B); software & AI $3.4B (AI autonomy platforms $2.5B); logistics & warehousing $1.2B (−28.5% YoY). Humanoid share computed: $4.8B of $27.7B = ~17%. ↩
[10] Two additional constraints — regulatory/liability vacuum and maintenance/field support infrastructure — also impede deployment. No ISO standard exists for dynamically balancing legged robots working near humans, and the liability question (manufacturer vs. deployer vs. AI provider) is unresolved in all jurisdictions. Maintenance infrastructure (trained technicians, spare parts, 24/7 support) does not exist at scale for humanoids. These constraints are institutional rather than technical, but they may prove equally binding in practice. ↩
Document Links
technology-ai-blue-collar.xlsx — Robotics timeline, IFR installation data, robot density by country, humanoid company landscape, technical constraints scorecard, job displacement attribution, occupation automation risk matrix, demographics–technology race data
Sources
[1] IFR, World Robotics Report 2025 (Sep 2025); World Robotics Report 2024 (Sep 2024). ifr.org
[2] Acemoglu, Daron, and Pascual Restrepo. “Robots and Jobs: Evidence from US Labor Markets.” Journal of Political Economy 128, no. 6 (2020): 2188–2244. journals.uchicago.edu
[3] Autor, David H., David Dorn, and Gordon H. Hanson. “The China Syndrome: Local Labor Market Effects of Import Competition in the United States.” American Economic Review 103, no. 6 (2013): 2121–68.
[4] Goldman Sachs Research, “Humanoid Robot: The AI Accelerant” (Jan 8, 2024). goldmansachs.com
[5] Goldman Sachs Research, “How Will AI Affect the US Labor Market?” (Mar 18, 2026). goldmansachs.com
[6] Morgan Stanley Research, “A $5 Trillion Global Market” (Apr 29, 2025). morganstanley.com
[7] McKinsey Global Institute, “Agents, Robots, and Us: Skill Partnerships in the Age of AI” (Nov 2025). mckinsey.com
[8] Counterpoint Research, “Global Humanoid Robot Installations Reach 16,000 Units” (Jan 14, 2026). counterpointresearch.com
[9] ABI Research, “Humanoid Robot Market Size, 2024 to 2030” (Jul 2025). abiresearch.com
[10] Deloitte, “AI for Industrial Robotics, Humanoid Robots, and Drones” (Nov 2025). deloitte.com
[11] Physical Intelligence, π0 blog post (Oct 2024); open-sourced (Feb 2025); $600M Series B (Nov 2025). pi.website
[12] NVIDIA, Isaac GR00T N1 announcement (Mar 18, 2025); updated to N1.6 (2026). nvidianews.nvidia.com
[13] Open X-Embodiment Collaboration, “Robotic Learning Datasets and RT-X Models” (2023, updated 2025). Google DeepMind + 33 institutions, 22 robot types, 1M+ trajectories. robotics-transformer-x.github.io
[14] Bain & Company, Technology Report 2025.
[15] IEEE Spectrum, “Humanoid Robot Challenges” (Oct 2025).
[16] Bessemer Venture Partners, “Can World Models Unlock General Purpose Robotics?” (Mar 2026). bvp.com
[17] BLS, FRED MANEMP series (U.S. manufacturing employment).
[18] Acemoglu, Daron, and Pascual Restrepo. “Robots and Jobs: Evidence from US Labor Markets.” Journal of Political Economy 128, no. 6 (2020): 2188–2244. journals.uchicago.edu
[19] Srinivasan, Chen & Zakerinia, “Displacement or Complementarity? The Labor Market Impact of Generative AI” (HBS Working Paper, Dec 2024, updated Aug 2025). hbs.edu
[20] BofA Global Research, Humanoid Robotics report (Mar 2026). bankofamerica.com
[22] Tesla, Inc. Form 8-K and Q4 2025 / Q1 2026 earnings calls (Jan 28 and Apr 22, 2026). ir.tesla.com
[23] PitchBook, “The limits of VC’s humanoid bet” (May 2026). pitchbook.com
[24] BofA Global Research humanoid VC data via Fortune (Mar 13, 2026); Crunchbase News robotics funding data (Feb 2026). news.crunchbase.com
[25] Fraunhofer IPA, humanoid robot benchmark first results (May 2026). ipa.fraunhofer.de
[26] NIST, proposed baseline humanoid performance benchmark (May 2026). nist.gov
[27] RLWRLD + NVIDIA, DexBench launch (Jun 9, 2026); AGIBOT World Challenge 2026, ICRA Vienna (Jun 2026).
[28] Humanoid Everyday benchmark (arXiv, Oct 2025).
[30] PitchBook, “Q4 2025 Robotics & Physical AI VC Trends” (Emerging Tech Research report preview, published Mar 19, 2026). pitchbook.com
[29] Apptronik funding announcement via Crunchbase News (Feb 11, 2026); Figure AI Series C via Reuters (Sep 2025). news.crunchbase.com
[21] iCapital Market Pulse, “AI Gets a Body — The Coming Rise of Humanoids” (Aug 2025). PitchBook “Humanoid Robotics” emerging space vertical data. icapital.com