AI Automation Exposure: Geographic and CRE Implications
Sources: BLS OEWS May 2025 (state cross-industry) · Harvard Business School automation scores · national exposure & displacement
AI automation exposure tracks where white-collar work concentrates, but the most immediate clerical-automation risk sits in a different, more dispersed set of states.
Each occupation carries a single automation-exposure score; a state's exposure is a function of its occupation mix, since the scores are identical everywhere and only the mix varies. The map below covers knowledge-work occupations only (management, business and finance, computer and math, engineering, legal, the sciences, and office support).
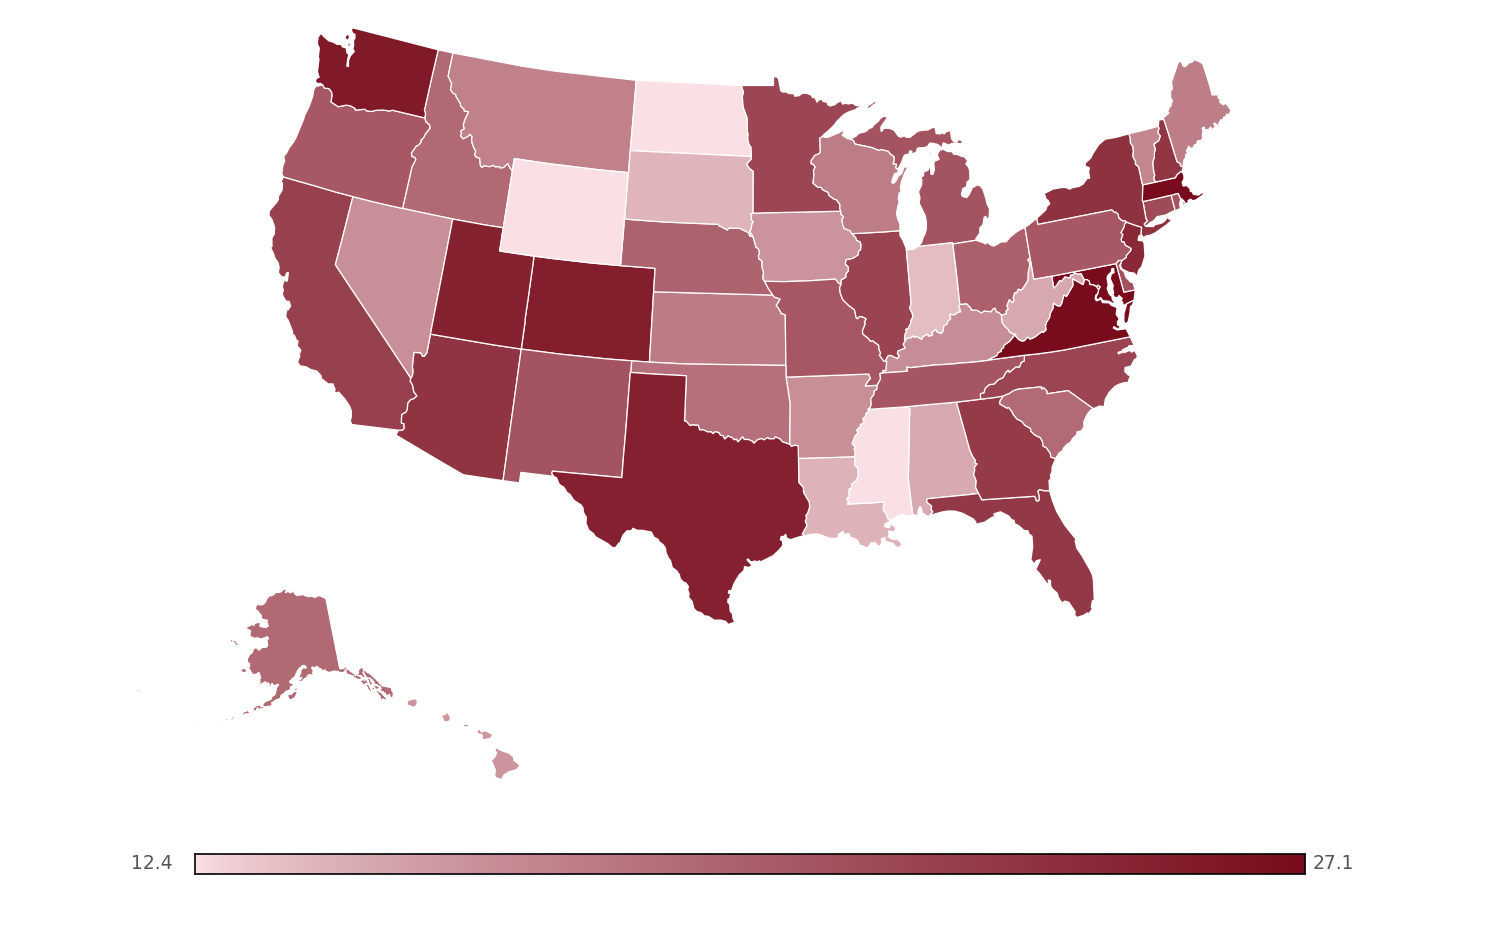
Weighted automation score by state
Sum of (occupation % of state jobs × automation score) over knowledge-work occupations only. Color scale capped near the extremes to show variation across the middle. Scale: 12.4 (Mississippi) to 27.1 (District of Columbia).
Key Observations
- Traditional white-collar concentration states are highly exposed to AI automation. The District of Columbia stands alone (weighted automation score 27.1, more than double any state), because over half its workforce is knowledge work skewed toward highly automatable business-operations and analyst roles. The next tier, Maryland, Virginia, Massachusetts, Washington, and Colorado, are large professional, technology, and government economies.
- A different, more dispersed set is exposed through office support alone. Measured as office-support jobs as a share of the entire workforce, the leaders are New Mexico, Tennessee, Kentucky, Oklahoma, South Carolina, and Idaho, each 12.3 to 12.7 percent. These states have smaller knowledge economies but a heavy clerical and back-office base, the work being automated first.
- Some states carry both. Texas, Utah, New Jersey, Arizona, New Hampshire, and Florida sit in the top tier on overall concentration and on office-support share.
- Within office support, the risk localizes by occupation, as the next chart shows for Customer Service Representatives. Explore state-by-state AI automation exposure by occupation and job family in the interactive tool below.
Certain back office functions are concentrated in low wage states.
Customer Service Representatives: weighted automation score by state
Weighted automation score is each state's share of jobs in this occupation times its 0.57 automation score; location quotient shown beside each bar. 2.6M US jobs.
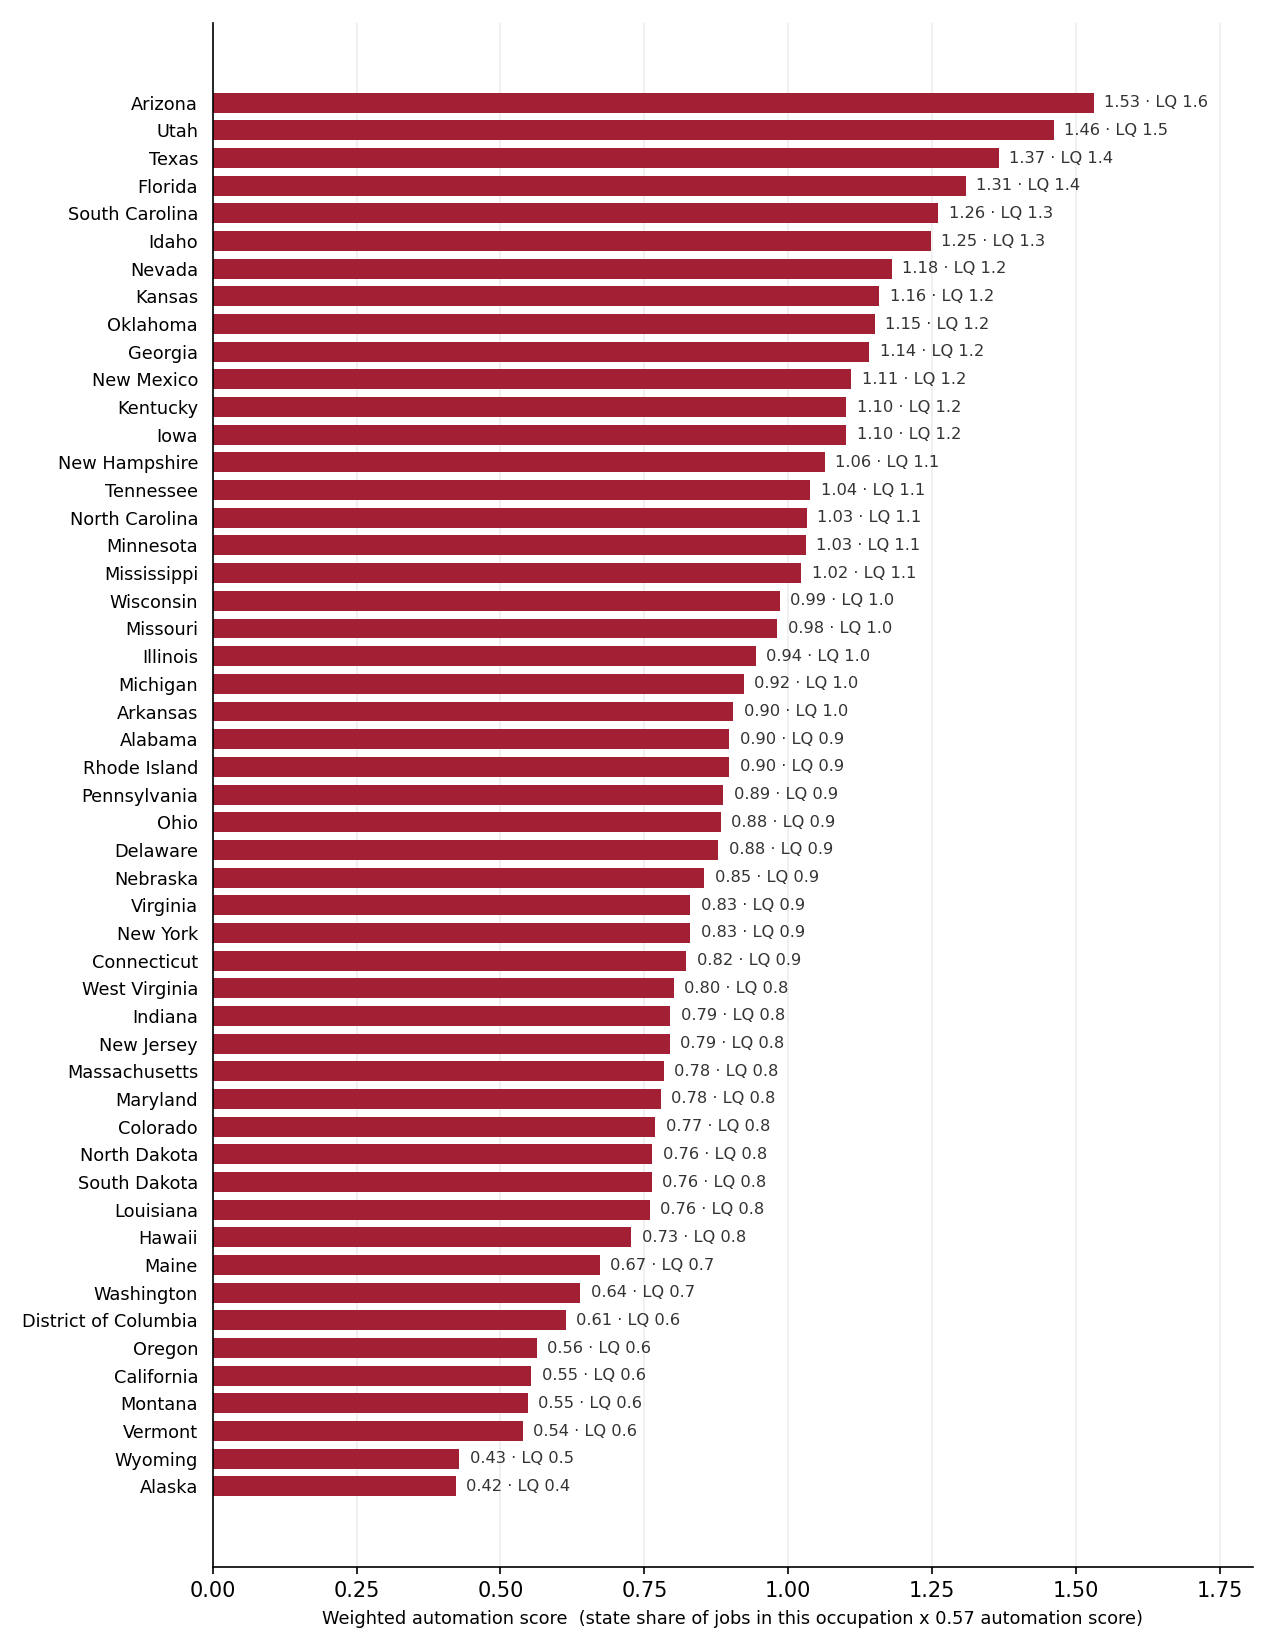
- Concentration follows the call-center belt. Customer Service Representatives cluster in Arizona, Utah, Texas, Florida, South Carolina, Idaho, Nevada, Kansas, and Oklahoma, lower-cost, lower-wage states that have long attracted contact-center and back-office operations.
- This is the work AI is automating first. Customer service, claims handling, and scheduling are the front line of current voice and chat automation, so the labor effect concentrates in the states that built employment on hosting these functions.
- CRE read. Contact-center and back-office real estate in these markets faces the most direct near-term demand risk, while ubiquitous front-office roles pressure administrative space broadly across all markets.
Explore the data
Rank states two ways, drill into one state's occupations, or trace where a single occupation concentrates. Filter by job family and automation score. The map and charts update live.
Controls
Rank states by
Job families
Automation score
Weighted automation score by state
How two of the measures are calculated
Location quotient (LQ): a state's share of its own jobs in an occupation divided by that occupation's share of national employment. An LQ above 1.0 means the state is over-indexed in that work; 2.0 means twice the national concentration.
Weighted automation score: an occupation's share of a state's jobs multiplied by its automation score. An occupation that is 2.0% of a state's jobs at a 0.60 score gives 2.0 × 0.60 = 1.20. Summed across occupations, this recovers that state's overall automation index.
Methodology and how to read this
Exposure here is structural, not realized. Each occupation carries one Harvard Business School automation score; a place's exposure is its occupation mix weighted by those fixed scores. The honest reading is which regions are most exposed, not which have been most affected. At the national level the correlation between automation score and 2022 to 2025 employment change is near zero, so this measures the shape of the workforce, not job loss to date.
The weighted automation score is the sum of each occupation's share of a state's jobs times its automation score; for a single occupation it is that occupation's share times its score. A location quotient (LQ) above 1.0 means a state is over-indexed in an occupation relative to the national rate.
Employment comes from the BLS OEWS May 2025 state cross-industry file; scores cover roughly 98 percent of state employment, with suppressed cells excluded and territories omitted from the map. OEWS is a point-in-time estimate and is not designed for year-over-year comparison.