Mexico became America’s largest goods trading partner in 2023.
Total U.S.–Mexico goods trade reached $797 billion in 2023, ahead of Canada ($772B) and China ($575B), and the lead has widened every year since. 2026 is tracking roughly $988 billion annualized, within reach of the first $1 trillion bilateral goods trade relationship in U.S. history. Source: U.S. Census Bureau, FT-900 country series (census.gov/foreign-trade/balance).
U.S.–China trade peaked in 2022 and has fallen sharply since.
Total U.S.–China goods trade peaked at $690 billion in 2022, fell 40% to $415 billion by 2025, and is tracking about $370 billion in 2026, below its 2012 level in nominal dollars. Source: U.S. Census Bureau, FT-900 country series (census.gov/foreign-trade/balance).
U.S.–Mexico trade has grown twice as fast as U.S. trade overall since NAFTA.
Since 1992, on the eve of NAFTA, U.S.–Mexico trade has grown 11.5x, roughly double the 5.7x growth of total U.S. goods trade over the same period. Source: U.S. Census Bureau, FT-900 country series (census.gov/foreign-trade/balance).
Vietnam is now the #4 U.S. trading partner.
From essentially zero U.S. trade in 1992, Vietnam passed both Japan and Germany in the first half of 2026 to become the fourth-largest U.S. trading partner. Source: U.S. Census Bureau, FT-900 country series (census.gov/foreign-trade/balance).
The great reallocation is a North America and Southeast Asia story.
Japan and Germany have been roughly flat for three decades. The share China lost went to Mexico, Vietnam, and other connector economies, not to the older industrial partners. Source: U.S. Census Bureau, FT-900 country series (census.gov/foreign-trade/balance).
U.S. Goods Imports
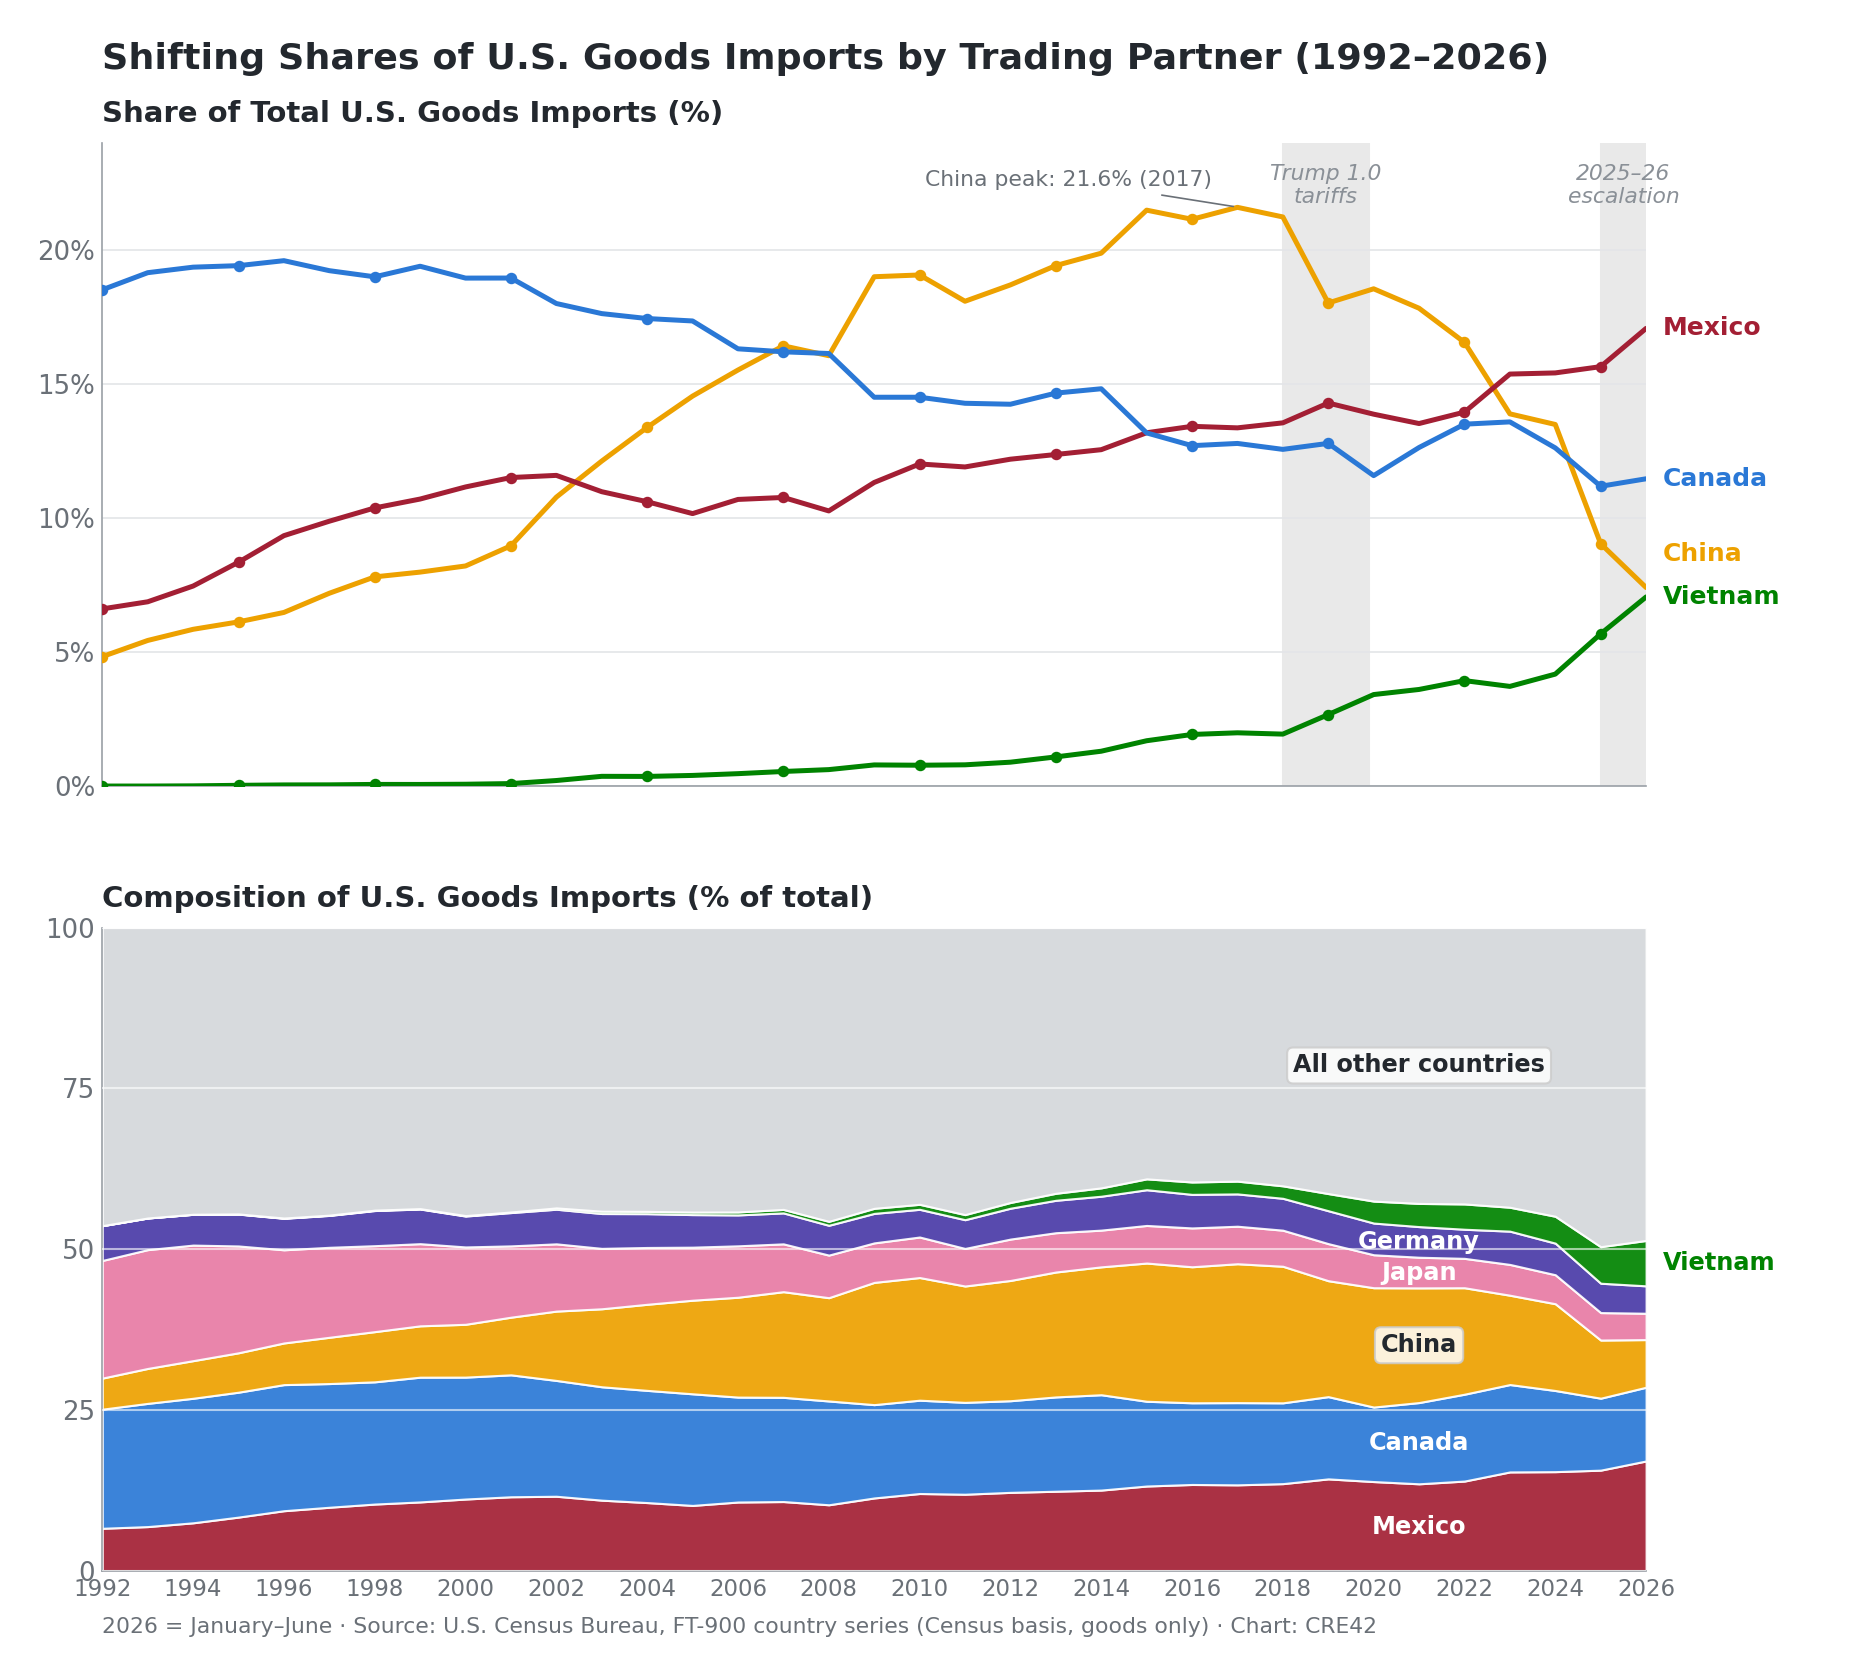
Shifting Shares of U.S. Goods Imports by Trading Partner, 1992–2026. Top: share of total U.S. goods imports. Bottom: full import composition. 2026 = January–June. | Source: U.S. Census Bureau, FT-900 country series (Census basis, goods only) | Chart: CRE42
China’s import share has collapsed to 1990s levels.
China ran from 4.8% of U.S. goods imports in 1992 to a 21.6% peak in 2017, then fell to 9.0% in 2025 and 7.4% in the first half of 2026. One decade of tariffs unwound two decades of gains. Source: U.S. Census Bureau, FT-900 country series (census.gov/foreign-trade/balance).
Mexico’s import share is at an all-time high.
Mexico supplied 17.1% of U.S. goods imports in the first half of 2026. Mexico plus Canada supply 28.5%, nearly double China and Vietnam combined. Source: U.S. Census Bureau, FT-900 country series (census.gov/foreign-trade/balance).
The 2023 crossover ended a 20-year run.
Mexico out-supplied China in 2023 for the first time since 2002. China had first overtaken Mexico in 2003, two years after joining the WTO. Source: U.S. Census Bureau, FT-900 country series (census.gov/foreign-trade/balance).
Vietnam is nearly tied with China.
Vietnam’s share grew from 1.7% in 2015 to 7.1% in the first half of 2026. A meaningful part of that reflects “China+1” relocation and transshipped Chinese content rather than purely Vietnamese production. Source: U.S. Census Bureau, FT-900 country series (census.gov/foreign-trade/balance).
Concentration has not changed; composition has.
The six partners shown have supplied a steady 52% to 54% of U.S. imports since 1992. What changed is who supplies them, not how concentrated supply is. Source: U.S. Census Bureau, FT-900 country series (census.gov/foreign-trade/balance).
U.S. Port Trade
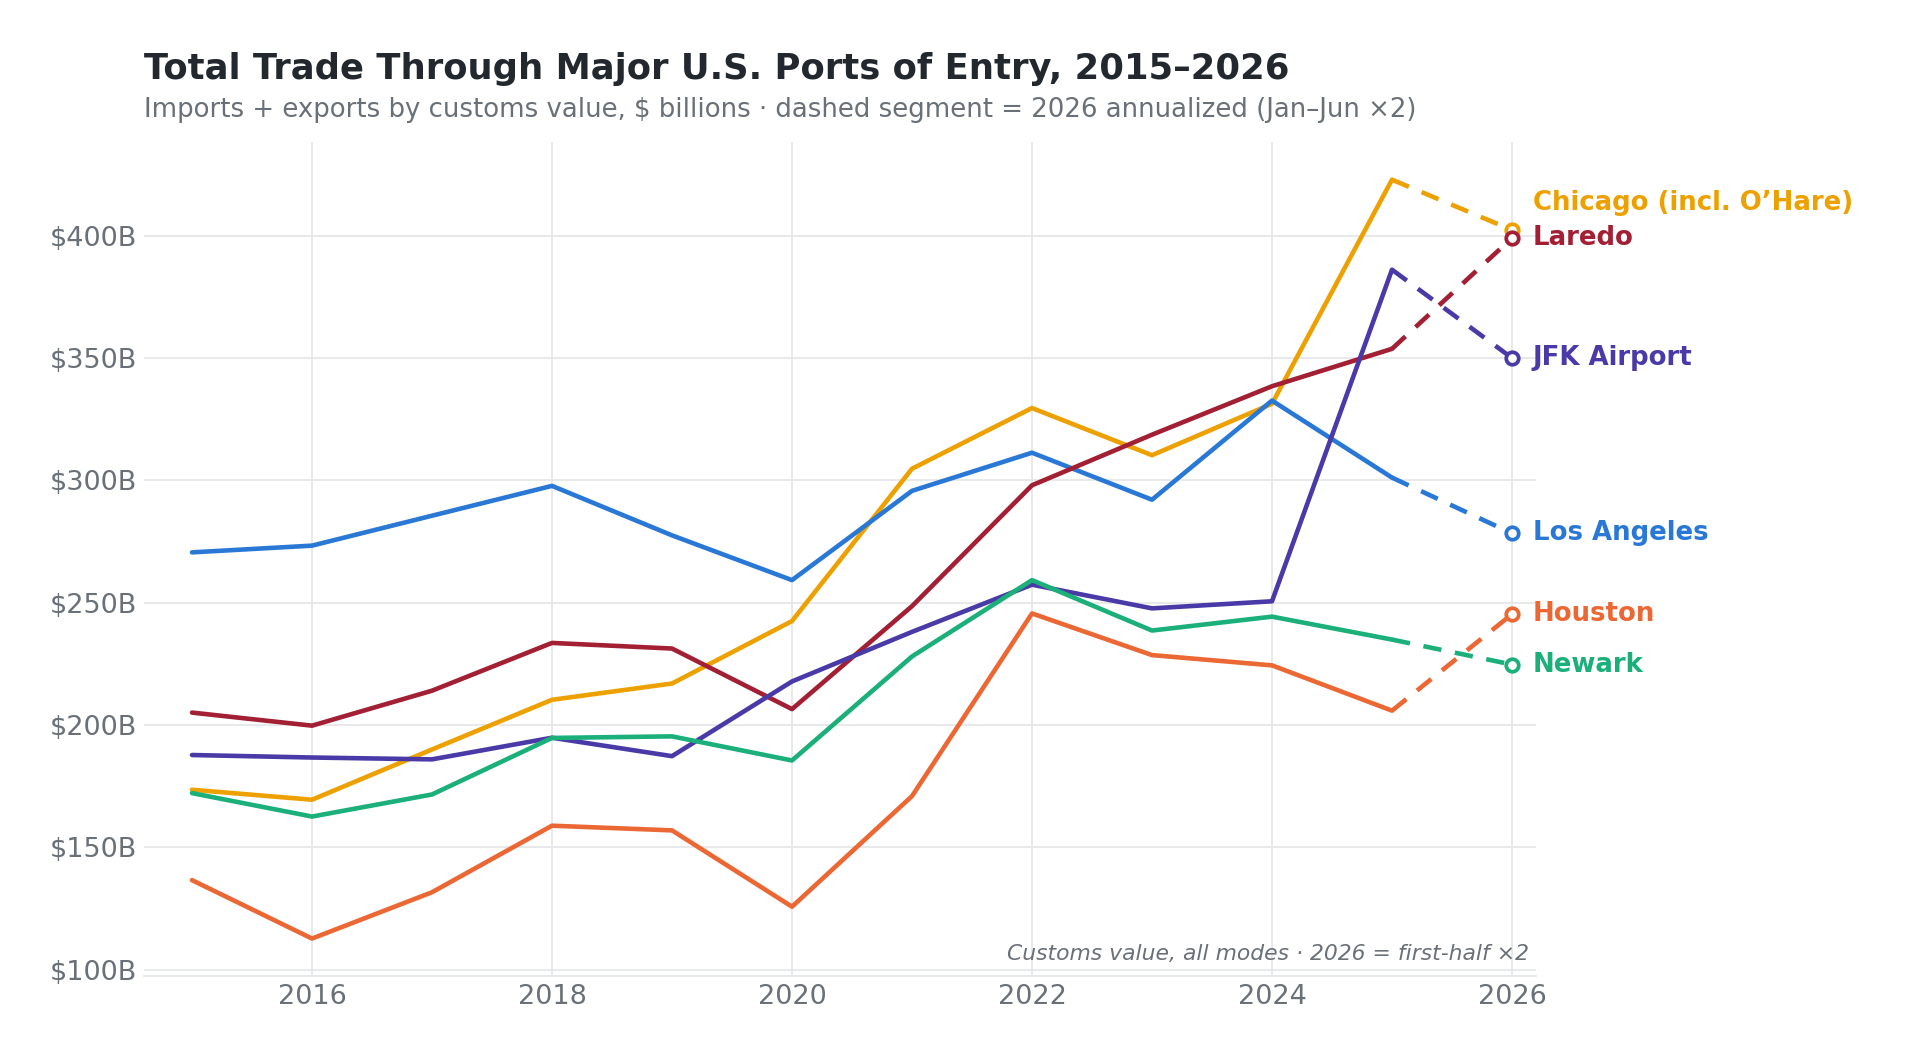
Total Trade Through Major U.S. Ports of Entry, 2015–2026: imports plus exports by customs value, all modes. 2026* = January–June ×2 (annualized). | Source: U.S. Census Bureau, USA Trade Online | Chart: CRE42
Laredo is the only major port rising every single year.
From 2020 through today, Laredo’s trade rose every year: $207B, $249B, $298B, $319B, $339B, $354B, and roughly $399B annualized in 2026, while every other top port has zig-zagged. Los Angeles, Newark, and Houston all remain below their 2022 peaks. Source: U.S. Census Bureau, USA Trade Online.
Laredo passed Los Angeles in 2023 to become the #1 conventional port of entry.
Trucks crossing from Monterrey now carry more value than containers arriving from Asia at any single U.S. gateway. Source: U.S. Census Bureau, USA Trade Online.
Los Angeles has flatlined.
Los Angeles is tracking roughly $278B in 2026, barely 3% above its 2015 level, while total U.S. goods trade grew about 50% over the same period. The China decoupling has a physical address. Source: U.S. Census Bureau, USA Trade Online.
The 2025 air-cargo spike was tariff front-running.
Chicago (including O’Hare) jumped 28% in 2025 to $423B and JFK jumped 54% to $386B as importers front-ran tariffs on high-value goods (semiconductors, pharmaceuticals, gold). Both are cooling in 2026. Source: U.S. Census Bureau, USA Trade Online.
Houston’s rise is an export story.
Energy shipments drove Houston’s 2022 peak of $246B, a thread that continues on the Gulf Coast line of the gateway comparison below. Source: U.S. Census Bureau, USA Trade Online.
U.S. Trade Entry Comparison
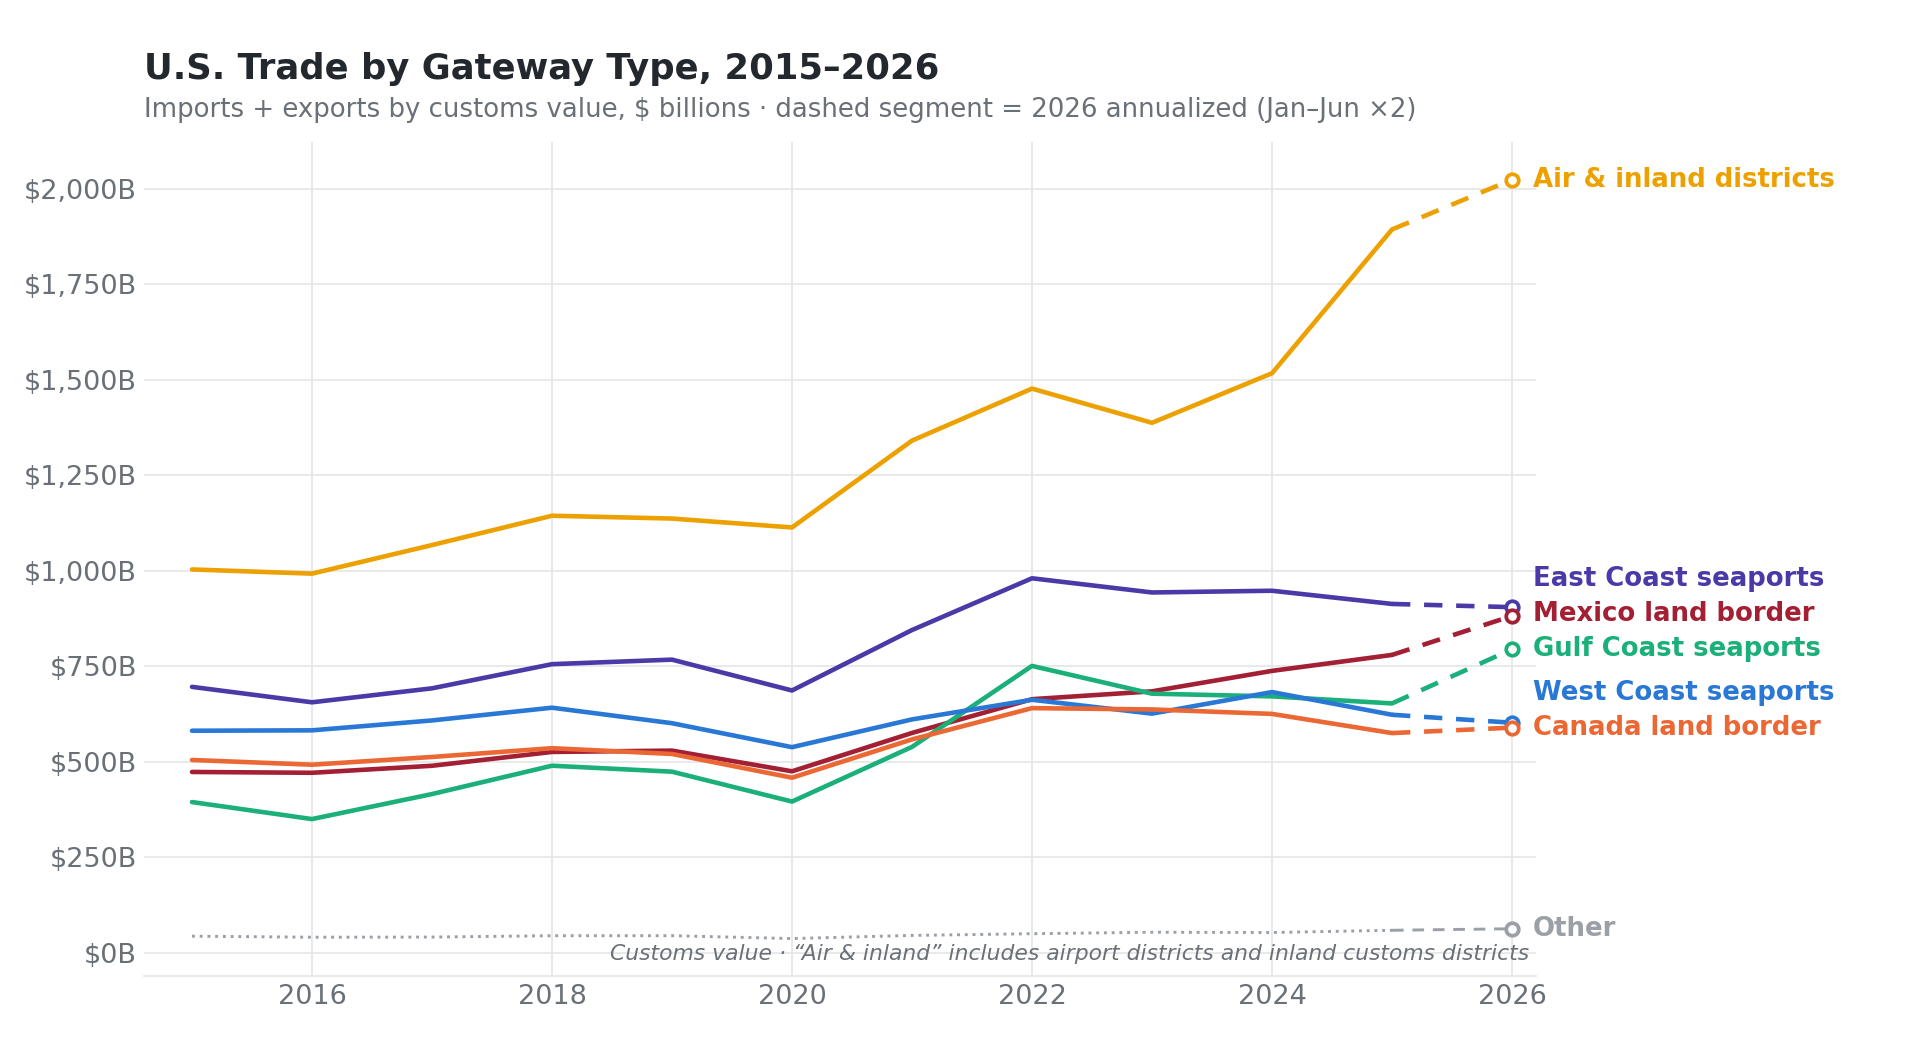
U.S. Trade by Gateway Type, 2015–2026: all 438 Census ports of entry classified into six gateway groups. 2026* = January–June ×2 (annualized). | Source: U.S. Census Bureau, USA Trade Online; gateway classification: CRE42 | Chart: CRE42
The Mexico land border is now the #2 surface gateway and closing on #1.
It passed the Canada border in 2019 and the West Coast seaports in 2023, and is tracking $882B in 2026: 1.5x the Canada border and closing on the East Coast seaports ($905B). Source: U.S. Census Bureau, USA Trade Online. Gateway classification: CRE42.
West Coast stagnation is China’s share loss made physical.
West Coast seaports handled less trade in 2025 ($623B) than in 2018 ($642B), and 2026 is tracking lower still. Source: U.S. Census Bureau, USA Trade Online.
Gulf Coast seaports passed the West Coast in 2022.
Gulf ports moved $751B in 2022 against the West Coast’s $662B, powered by the LNG and crude export boom, and have stayed ahead since. Source: U.S. Census Bureau, USA Trade Online.
The Canada border is the slowest-growing gateway.
Canada border crossings went from $505B in 2015 to $575B in 2025, a fraction of overall trade growth. The reallocation is running through Mexico, not Canada. Source: U.S. Census Bureau, USA Trade Online.
Air and inland districts are the largest gateway of all.
Air and inland customs districts rose 25% in 2025 to $1.89 trillion on the tariff front-running air-cargo surge, and are tracking roughly $2.0 trillion in 2026. Source: U.S. Census Bureau, USA Trade Online.
Laredo Texas - Prime Beneficiary of U.S. Nearshoring Growth
- 40.6% of U.S.–Mexico goods trade crosses in Laredo, TX
- Laredo’s trade has grown 71% since 2020, outpacing the 63% growth of total U.S.–Mexico trade
- Laredo’s World Trade Bridge connects Mexico’s industrial heartland for autos, parts, appliances, and electronics (the Monterrey–Saltillo manufacturing corridor) to Interstate 35, feeding the San Antonio, Austin, and Dallas–Fort Worth distribution markets.
- Nearly 90% of U.S.–Mexico trade value moves over the land border rather than by sea or air, which means nearshoring’s gains translate almost one-for-one into truck crossings, cross-dock demand, and warehouse absorption on both sides of the river. The El Paso–Juárez complex ($144B in 2025) plays the same role for the maquiladora electronics belt, a distant but fast-growing second.
What to Watch For in 2026 and Beyond
Sources to Track Shifting Trade Partners in 2026:
| Source | Report or Series | Frequency | Notes |
|---|
| U.S. Census Bureau | FT-900 Trade in Goods by Country | Monthly, ~5-week lag | Partner-level imports and exports; the Mexico vs. China race and Vietnam’s climb |
| U.S. Census Bureau | USA Trade Online, port-level detail | Monthly | Port of entry values; Laredo vs. Los Angeles and the land border vs. the coasts |
| USTR | USMCA Joint Review proceedings | Ongoing; annual reviews | Review initiated July 2026; tariff treatment of USMCA-compliant goods drives the Mexico advantage |
| Bureau of Transportation Statistics | TransBorder Freight Data | Monthly | Truck and rail mode detail at individual border crossings |
Sources
- U.S. Census Bureau, Trade in Goods by Country (census.gov/foreign-trade/balance): Mexico (c2010), China (c5700), Canada (c1220), Japan (c5880), Germany (c4280), Vietnam (c5520), World total (c0015). Census basis, goods only, nominal dollars. Retrieved August 2026.
- U.S. Census Bureau, USA Trade Online (usatrade.census.gov): customs value (general imports) and total exports value by Census port of entry, all modes, 2015–June 2026. Retrieved August 2026.
- Office of the U.S. Trade Representative, statement on the USMCA Joint Review, July 2026 (ustr.gov).
Methodology & Data Notes
Data Basis
All partner-level figures are U.S. Census Bureau FT-900 country series on a Census basis, goods only, in nominal dollars. These differ from Balance of Payments basis totals used elsewhere on this site. Figures reflect the Census vintage retrieved in August 2026 and may differ 1–2% from earlier vintages.
2026 Partial-Year Handling
2026 figures cover January through June. Dollar charts annualize as first-half ×2, flagged “2026*” and drawn dashed; this simple method assumes no seasonality, and goods trade normally skews slightly toward the second half. Share calculations use the first half as-is, since shares are unaffected by the partial year.
Gateway Classification
All 438 ports of entry in the USA Trade Online pull are classified into six gateway groups (West Coast seaports, East Coast seaports, Gulf Coast seaports, Mexico land border, Canada land border, air and inland districts) plus a residual “Other” equal to 1.1% of total value (Puerto Rico, Hawaii, and low-value shipments). Airports and courier hubs are assigned by name; inland customs districts (Chicago, Atlanta, Dallas-Fort Worth, and similar) are grouped with air because their trade is dominated by air cargo and courier entries. The full port-by-port mapping is in the companion workbook.
Known Data Caveats
The Census “Chicago, IL” port district includes O’Hare air cargo and is labeled “Chicago (incl. O’Hare)” throughout. The “Ysleta, TX” district (El Paso) rises from roughly zero in 2015 to $77B of imports in 2025, which likely reflects a district coding change; it sits inside the Mexico land border group either way. The 2025 jump in air and inland trade is consistent with tariff front-running of high-value goods (semiconductors, pharmaceuticals, gold).
Customs Value vs. Container Volume
Port figures are dollar customs values across all modes, not container counts. TEU container volumes are covered separately on the Ports & Container Volumes page when it is published.
