
The four large U.S. technology companies known as hyperscalers due to their massive data center expenditures (Alphabet, Amazon, Meta, Microsoft) spent $411 billion on capital expenditure in 2025 and have guided to $720–745 billion for 2026, an annual rate that by itself exceeds the inflation-adjusted cost of the Interstate Highway System.
This page measures the current AI & data center buildout against previous major capex booms in U.S. history and provides an overview of its financial impact on the companies funding the buildout. The Measuring the Data Center Construction Boom page explains what the capex figure contains.
There are no shortage of opinions related to the possible existence of a debt and equity bubble building around the “AI trade”. The statistics below will help the reader understand the actual magnitude of the AI & data center investment boom within the context of the U.S. economy and investment market.
Aggregate Hyperscaler Capex, 2014–2026
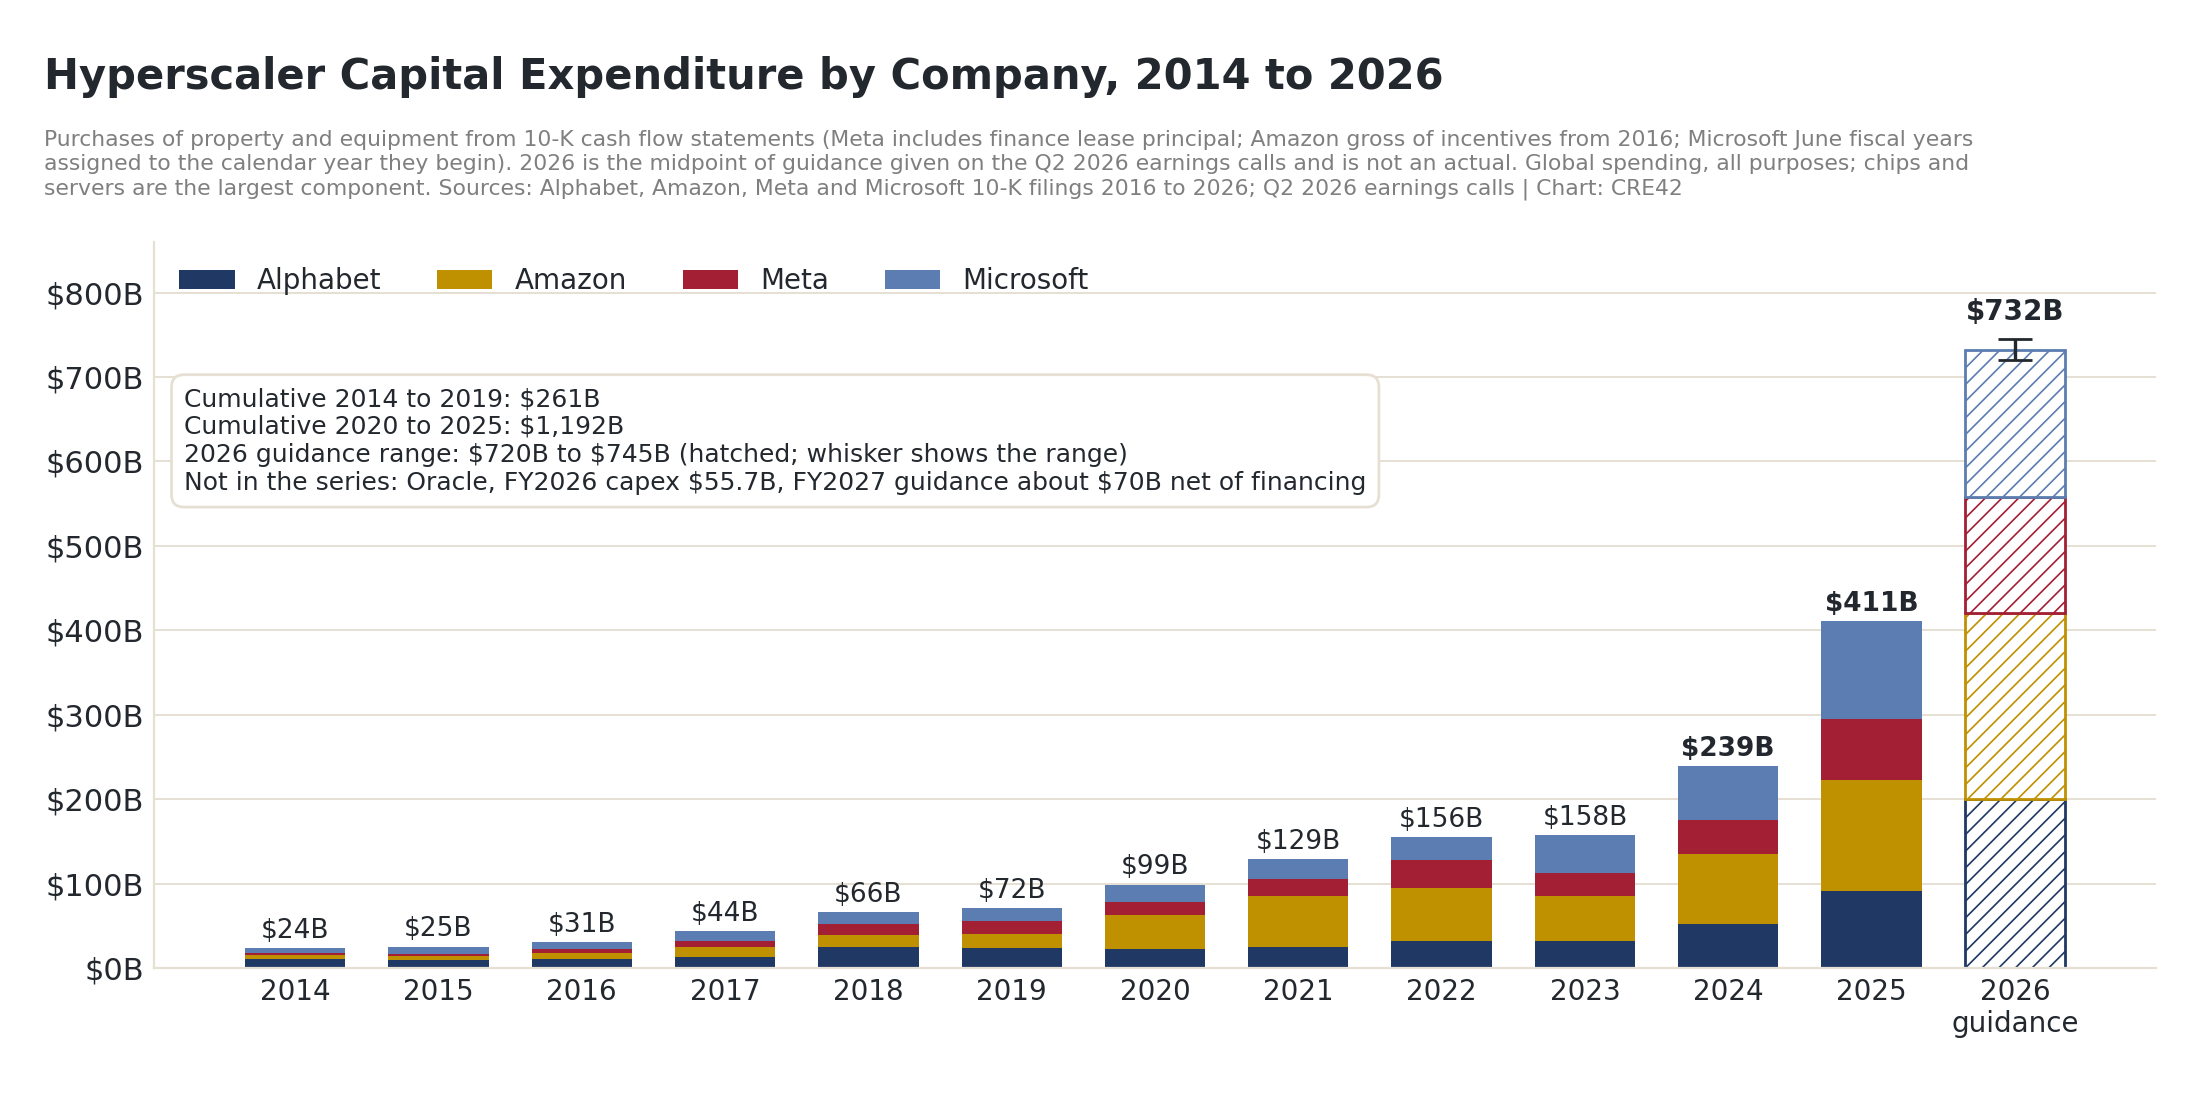
Hyperscaler Capital Expenditure by Company, 2014 to 2026 | Sources: Alphabet, Amazon, Meta, Microsoft 10-K filings 2016 to 2026; Q2 2026 earnings calls
- The series starts in 2014, the first year for which Amazon reported Amazon Web Services as a separate segment and the first year of the Census Bureau’s data center construction series. Spending from 2014 to 2023 is the cloud buildout, which began with the launch of AWS in 2006. The AI buildout appears in the 2024 figures, the first full year after the release of ChatGPT in November 2022.
- Alphabet, Amazon, Meta and Microsoft spent $411 billion on property and equipment in 2025, up 72% from 2024 and four times the 2020 figure. On their July 2026 earnings calls they guided to $720–745 billion for 2026, a further 78% at the midpoint.[1]
- The four companies spent $261 billion over 2014 to 2019 and $1,192 billion over 2020 to 2025. Everything before 2020 was the cloud buildout; the step-change begins in 2024.
- Capex is global and covers everything each company builds, from data centers to fulfillment centers and offices; chips and servers are roughly 60% of the current total. The 2026 bar is guidance, not a reported figure, and is drawn hatched with the range shown.
- Oracle is not in the series because it reports on a May fiscal year and quotes capex net of customer prepayments: FY2026 capex was $55.7 billion and FY2027 guidance is a net cash outlay of about $70 billion.[2]
AI Buildout Capex vs. Previous U.S. Capex Booms
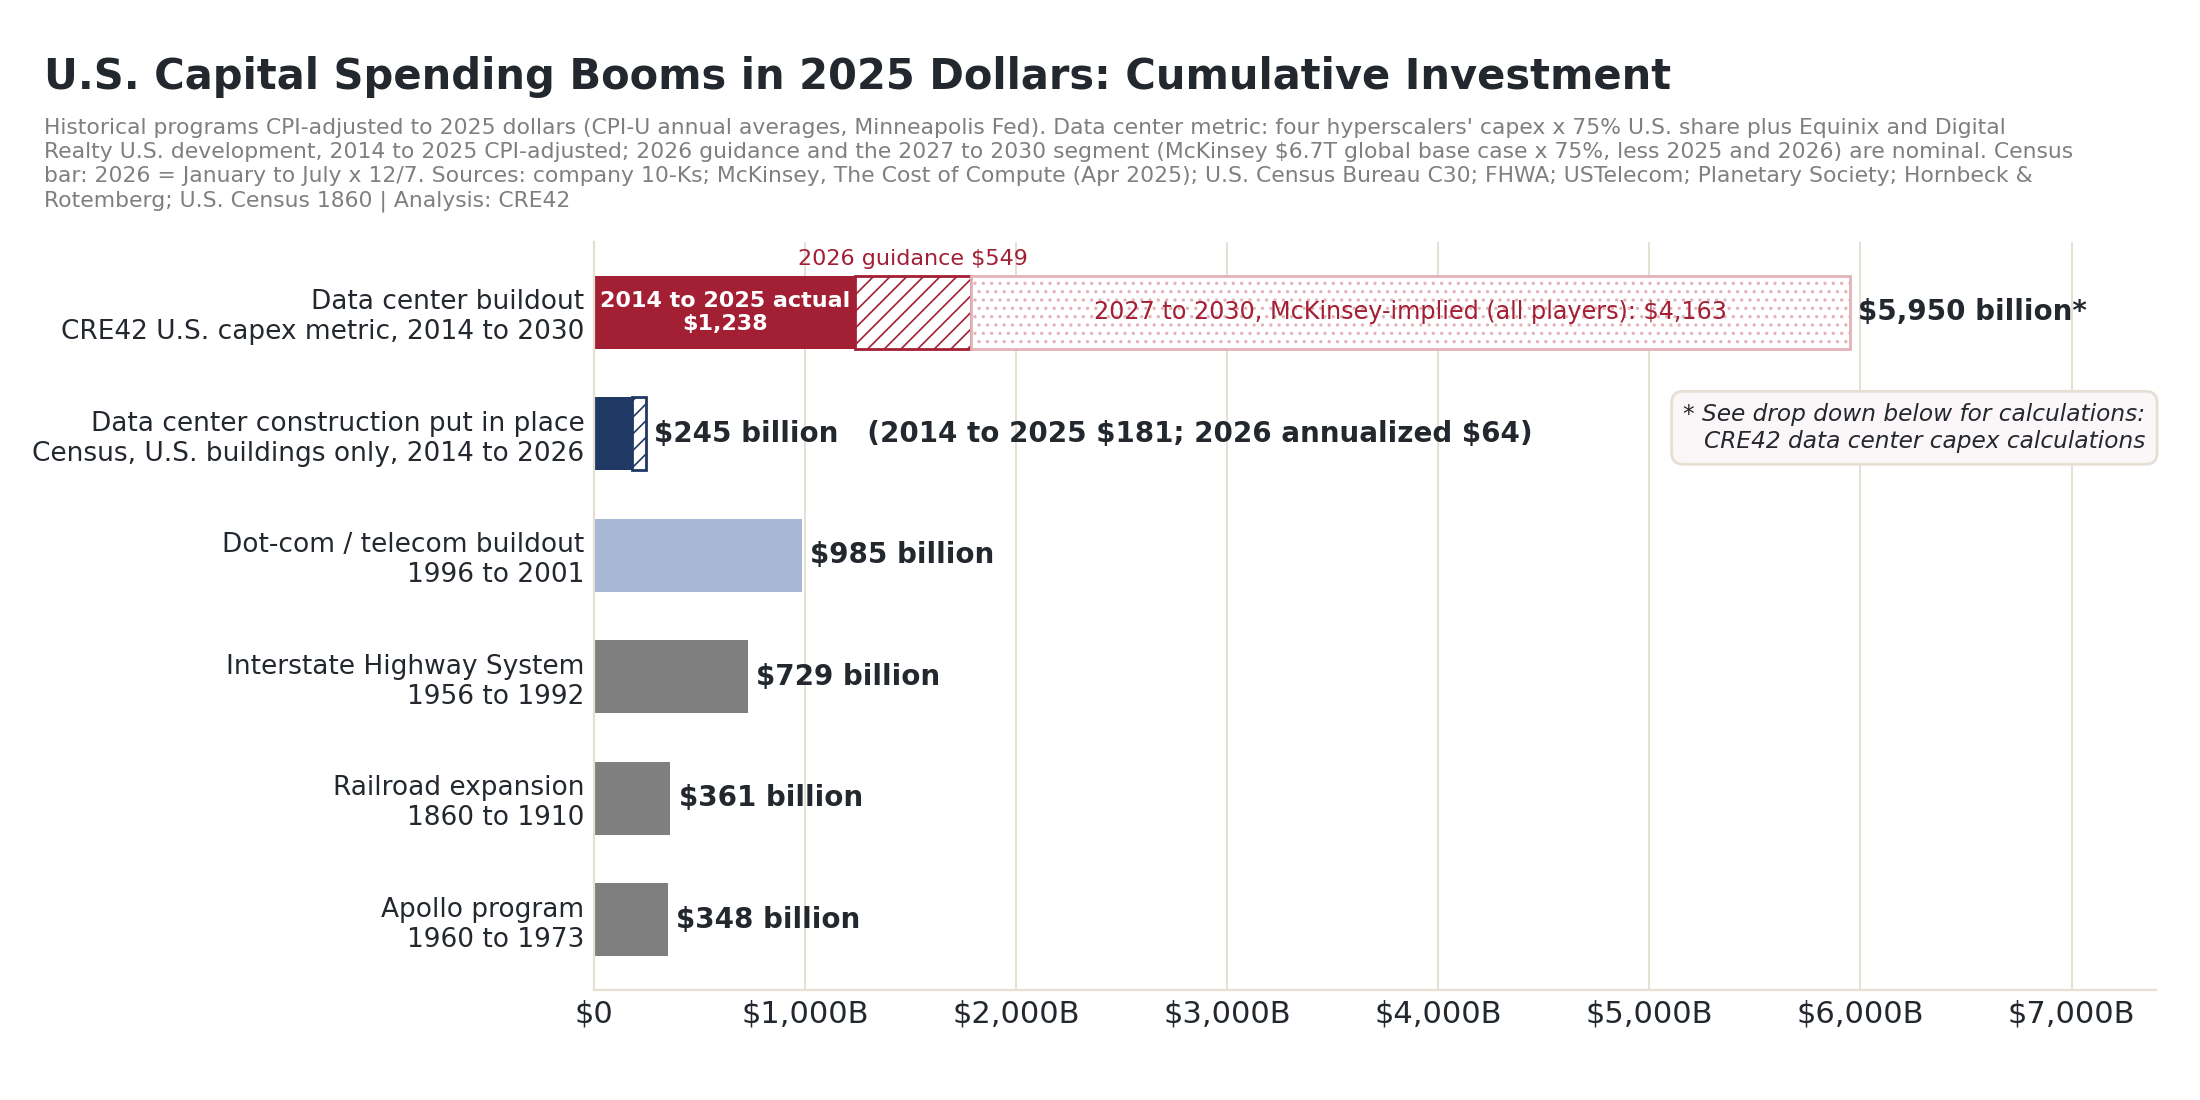
U.S. Capital Spending Booms in 2025 Dollars: Cumulative Investment | Sources: company 10-K filings; McKinsey; U.S. Census Bureau; FHWA; USTelecom; Planetary Society; Hornbeck & Rotemberg; U.S. Census 1860; Minneapolis Fed CPI
- The four historical capex booms listed above are adjusted to 2025 dollars with the annual-average CPI: railroads 1860 to 1910 ($361 billion), the Interstate Highway System 1956 to 1992 ($729 billion), Apollo 1960 to 1973 ($348 billion) and the dot-com telecom buildout 1996 to 2001 ($985 billion). Derivations are in the Methodology section below.[3]
- The top bar is a CRE42 estimate of capital spending landed in U.S. data centers. It is the four companies’ capex times a 75% U.S. share, which is the share of each company’s latest annual increase in long-lived assets located in the United States (73% Alphabet, 68% Microsoft, 92% Meta; Amazon does not disclose and is given the weighted average), plus the U.S. development spending of the two largest colocation REITs, Equinix and Digital Realty, which adds $1–4 billion a year. The solid segment is 2014 to 2025 actuals in 2025 dollars, $1,238 billion; the hatched segment is 2026 guidance at the same U.S. share, $549 billion.[4]
- The dotted segment is a projection from a single outside source. McKinsey’s base case is $6.7 trillion of global data center capex from 2025 through 2030. Applying the same 75% U.S. share gives about $5.0 trillion for the United States; subtracting what the metric already counts for 2025 and 2026 leaves $4,163 billion for 2027 to 2030, about $1.0 trillion a year. The step-up from $549 billion in 2026 to about $1.0 trillion a year has two causes. McKinsey counts every builder (the four hyperscalers, Oracle, the neoclouds, colocation developers and enterprises), so this segment is wider in scope than the two actual segments, which count only the four companies and two colocation REITs. And McKinsey’s total assumes spending keeps rising through 2030 rather than holding at the 2026 rate: $6.7 trillion over six years averages $1.1 trillion a year worldwide, against the four companies’ $732 billion of 2026 guidance (about $800 billion with Oracle), so its later years run above the current pace even after allowing for the other builders.[5]
- The second bar is what the Census Bureau counts as data center construction: on-site work on the buildings, no chips, no land: $245 billion from 2014 through 2026 (2026 annualized from January to July). It is the apples-to-apples comparison with the earlier programs, and the measuring page explains why it is so much smaller than capex.[6]
- Earlier booms were based almost solely on U.S.-based production, while this one includes a lot of imported foreign goods. The four earlier booms were built from domestic labor, steel, cement, fiber and aerospace work, so their bars are close to 100% U.S. content. The data center bars count everything landed in U.S. data centers, and roughly 60% of that is imported hardware. Through 2026 the CRE42 U.S. data center capex figure is $1,787 billion ($1,238 billion for 2014 to 2025 in 2025 dollars, plus $549 billion of 2026 guidance). The building side, 40% of it, is $715 billion of U.S. content, about the Interstate Highway System. The imported hardware carries a U.S. design margin (Nvidia’s, explained in the expandable section below) which on the hardware bought in the AI era (2024 to 2026) comes to $298 billion (60% hardware, two-thirds of it Nvidia-priced, at a 71% gross margin); for U.S. content of about $1,013 billion, roughly the telecom buildout.[7]
Capex as a Share of GDP
| Boom | Period | Total | Avg annual capex | Avg annual GDP | Adjusted U.S. content capex as % of GDP* |
|---|---|---|---|---|---|
| Data center buildout, adjusted U.S. content (CRE42)* | 2014–2026 | $1,013B | $78B | $23.7T | 0.3% |
| * See Reconciliation: from gross U.S. data center capex to U.S. content, through 2026 ($ billions) drop down section above (line J). Total is 2014 to 2025 in 2025 dollars plus 2026 guidance; average annual GDP is the 2014 to 2026 average of nominal GDP. | |||||
| Railroad expansion | 1860–1910 | $10.8B | ~$216M | ~$15B | ~1.4% |
| Dot-com / telecom | 1996–2001 | $513.6B | ~$85.6B | ~$9.6T | ~0.9% |
| Apollo program | 1960–1973 | $25.8B | ~$2.0B | ~$850B | ~0.2% |
| Interstate Highway | 1956–1992 | $128.9B | ~$3.6B | ~$2.5T | ~0.1% |
- Averaged over its thirteen years, the adjusted U.S. content of the data center buildout is 0.3% of GDP: above the Interstate and Apollo programs, below the telecom boom (0.9%) and the railroad era (1.4%). The average understates the current pace because the early years were small: on the same 68% U.S.-content basis, 2025 alone is 0.7% of GDP and 2026 guidance is 1.2%, approaching the railroad era’s share. The historical rows treat those programs as fully domestic.[8]
▶ Where the Hardware Comes From: imports, chips and the domestic-content adjustment
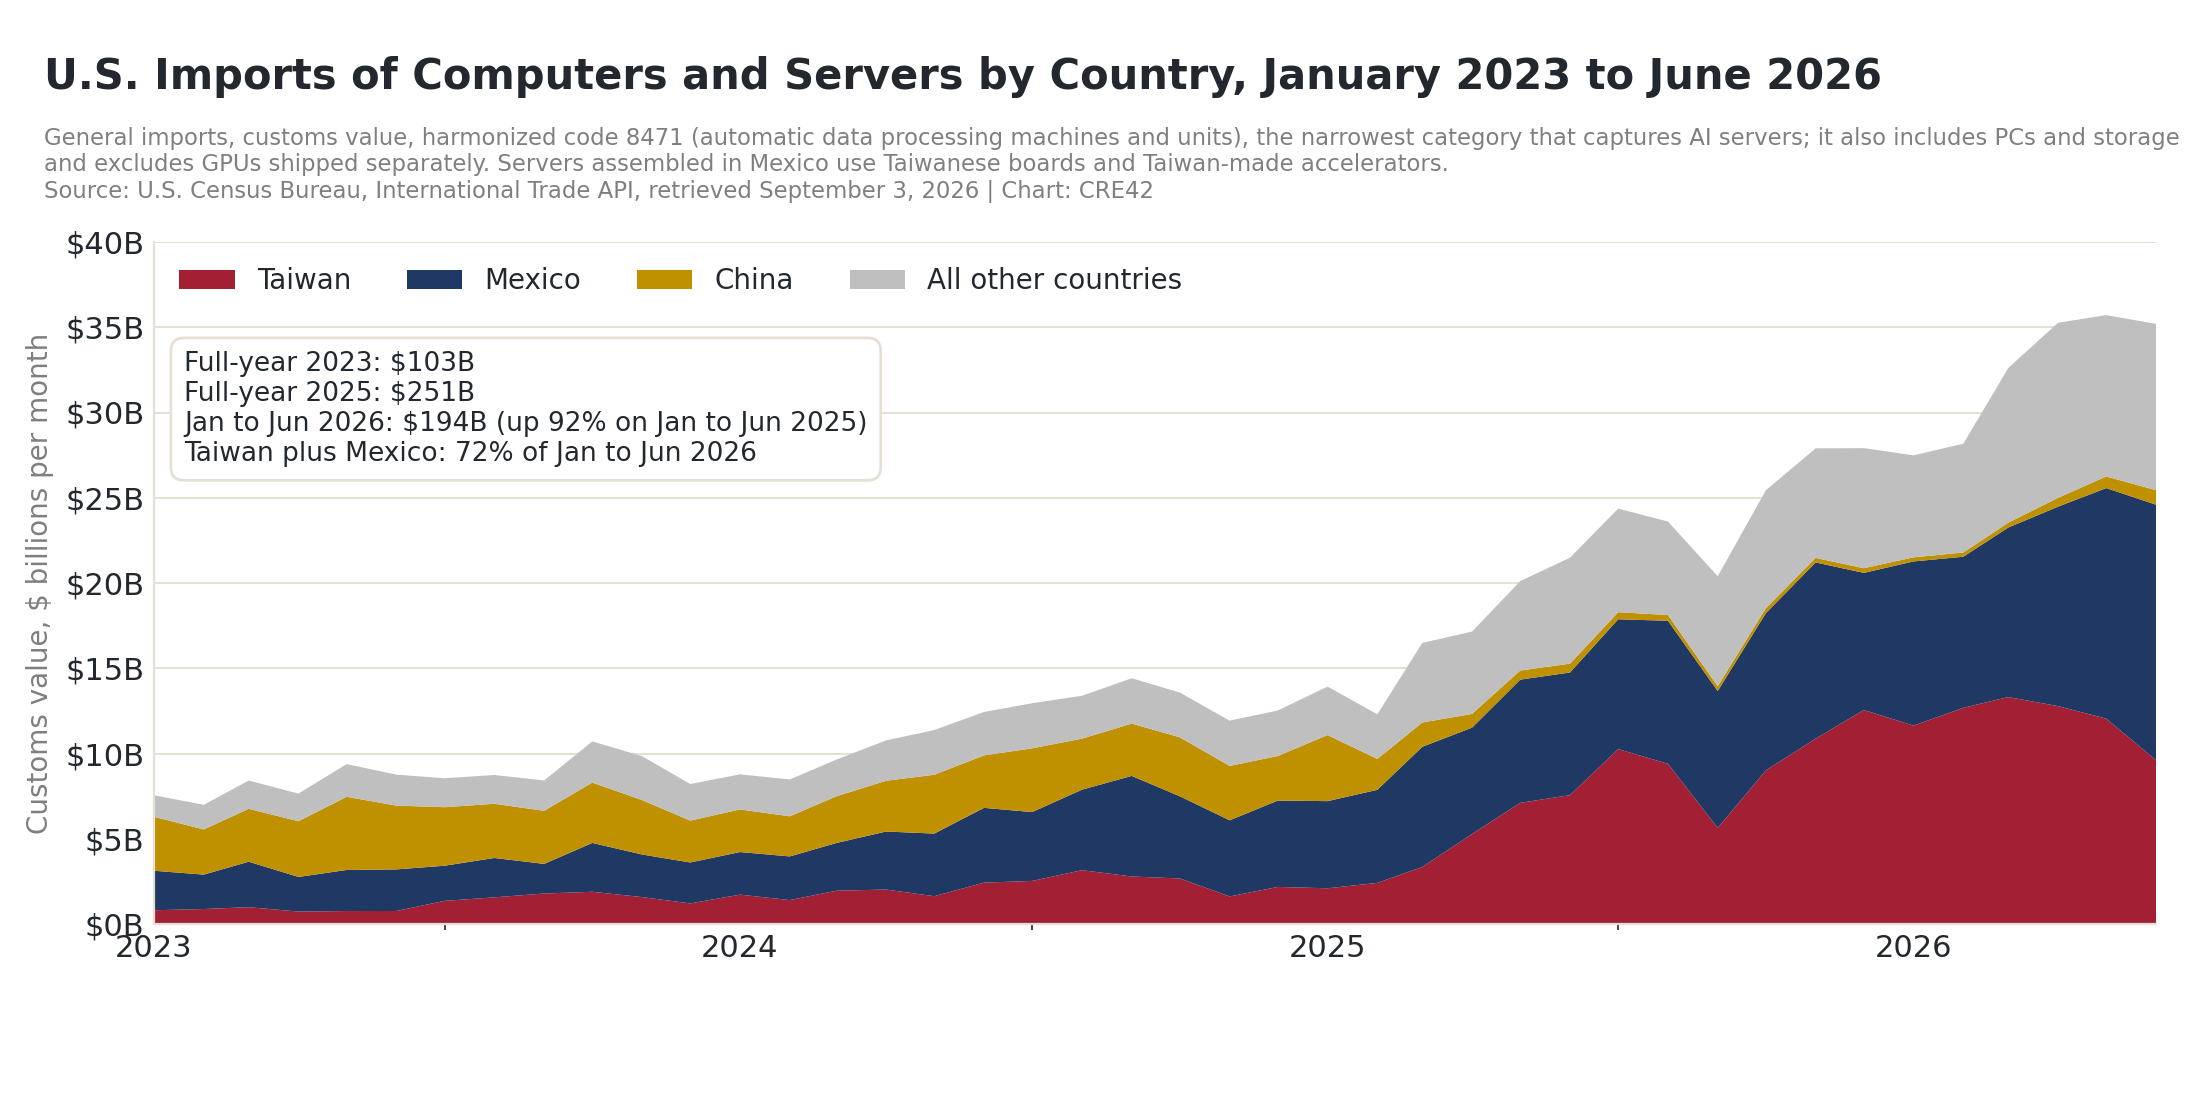
U.S. Imports of Computers and Servers by Country, January 2023 to June 2026 | Source: U.S. Census Bureau, International Trade API
- Hardware is about 60% of an AI campus. For a representative 1 GW campus the building side (land, shell, power, cooling, fit-out, soft costs) is about $20 billion and the chips and servers inside about $30 billion; McKinsey allocates 60% of AI data center investment to technology developers, and CSIS puts server chips alone at “at least 45 percent of total investment.”[9]
- Nearly all of that layer enters the country as finished servers. U.S. imports under customs code 8471 (computers and servers) were $103 billion in 2023, $140 billion in 2024, $251 billion in 2025 and $194 billion in the first half of 2026 alone, up 92% on a year earlier and about $389 billion annualized. Taiwan and Mexico supply 72% of it; China’s share fell from 38% in 2023 to under 2%. The increase over the flat 2023 baseline, the server-driven part, was 47% of the CRE42 U.S. metric in 2025 and 52% in 2026 so far; networking gear, transformers and switchgear are imported under other codes and are not in the figure.[10]
- Mexico is an assembly platform, not a second source. Servers built in Mexico by Taiwanese manufacturers use Taiwanese boards and Taiwan-made accelerators; design, integration and supply-chain coordination remain in Asia. The Mexico share overstates North American content.[11]
- The chips are designed here, increasingly fabricated here, and packaged, memoried and mostly assembled abroad. TSMC’s Arizona fab reached volume production of Nvidia Blackwell wafers in 2026, but every Arizona die is sent to Taiwan for advanced packaging, which is not expected in the United States before 2028; high-bandwidth memory is made in Korea, Taiwan and Japan; Foxconn in Houston and Wistron in Fort Worth assemble racks from Taiwan-packaged GPUs, which moves the customs entry point but not the origin of the value.[12]
- The customs value overstates foreign value added. An imported server’s price includes the margin of its U.S. designer. Nvidia’s gross margin was 71% in fiscal 2026 (75% in fiscal 2025) on $194 billion of data center revenue, so a large part of what enters the country as a Taiwanese or Mexican import is booked as U.S. income. Adding that margin back raises the U.S. share of AI-era data center capex from roughly 40% to roughly two-thirds; for the 2014 to 2023 cloud buildout, before Nvidia became the main supplier, no add-back is made. We stop there: the same logic would add Broadcom’s, AMD’s and Micron’s U.S. margins and subtract Taiwanese and Korean ones, but Nvidia’s margin dwarfs every other item in that category, and the rest are noted, not modeled.[13]
- Unlike rails, highways or fiber, the hardware layer does not last. The four hyperscalers depreciate servers over five to six years (Amazon shortened its estimate for a subset of servers and networking equipment from six years to five in 2025), and AI accelerators lose competitive value faster than that as each generation arrives. Maintaining competitive compute therefore requires continual replacement spending: a share of every year’s capex replaces capacity bought only a few years earlier, so the durable asset left behind is smaller than the cumulative dollars, and the buildout does not end when the campuses are finished.[14]
- The earlier booms were built at home. The Interstate and Apollo programs were domestic labor, cement, steel, asphalt and aerospace work; the telecom boom bought mostly domestic fiber and switching; the railroads imported British iron rail in their early decades before domestic steel took over. None approached the import share of the data center buildout.
How the adjustment is applied: U.S. content before the add-back is the 40% building side; the U.S.-booked design margin is estimated as the 60% hardware layer times an assumed two-thirds Nvidia-priced content times Nvidia’s 71% gross margin, about 28% of capex, giving U.S. content of about 68% for AI-era spending (2024 onward). The two-thirds figure is a CRE42 assumption, not a reported number. The reconciliation table under the booms chart applies the add-back only to the AI-era years and its line J feeds the GDP table; the arithmetic is on the Domestic Content tab of the workbook.
Hyperscaler Capex Against Operating Cash Flow
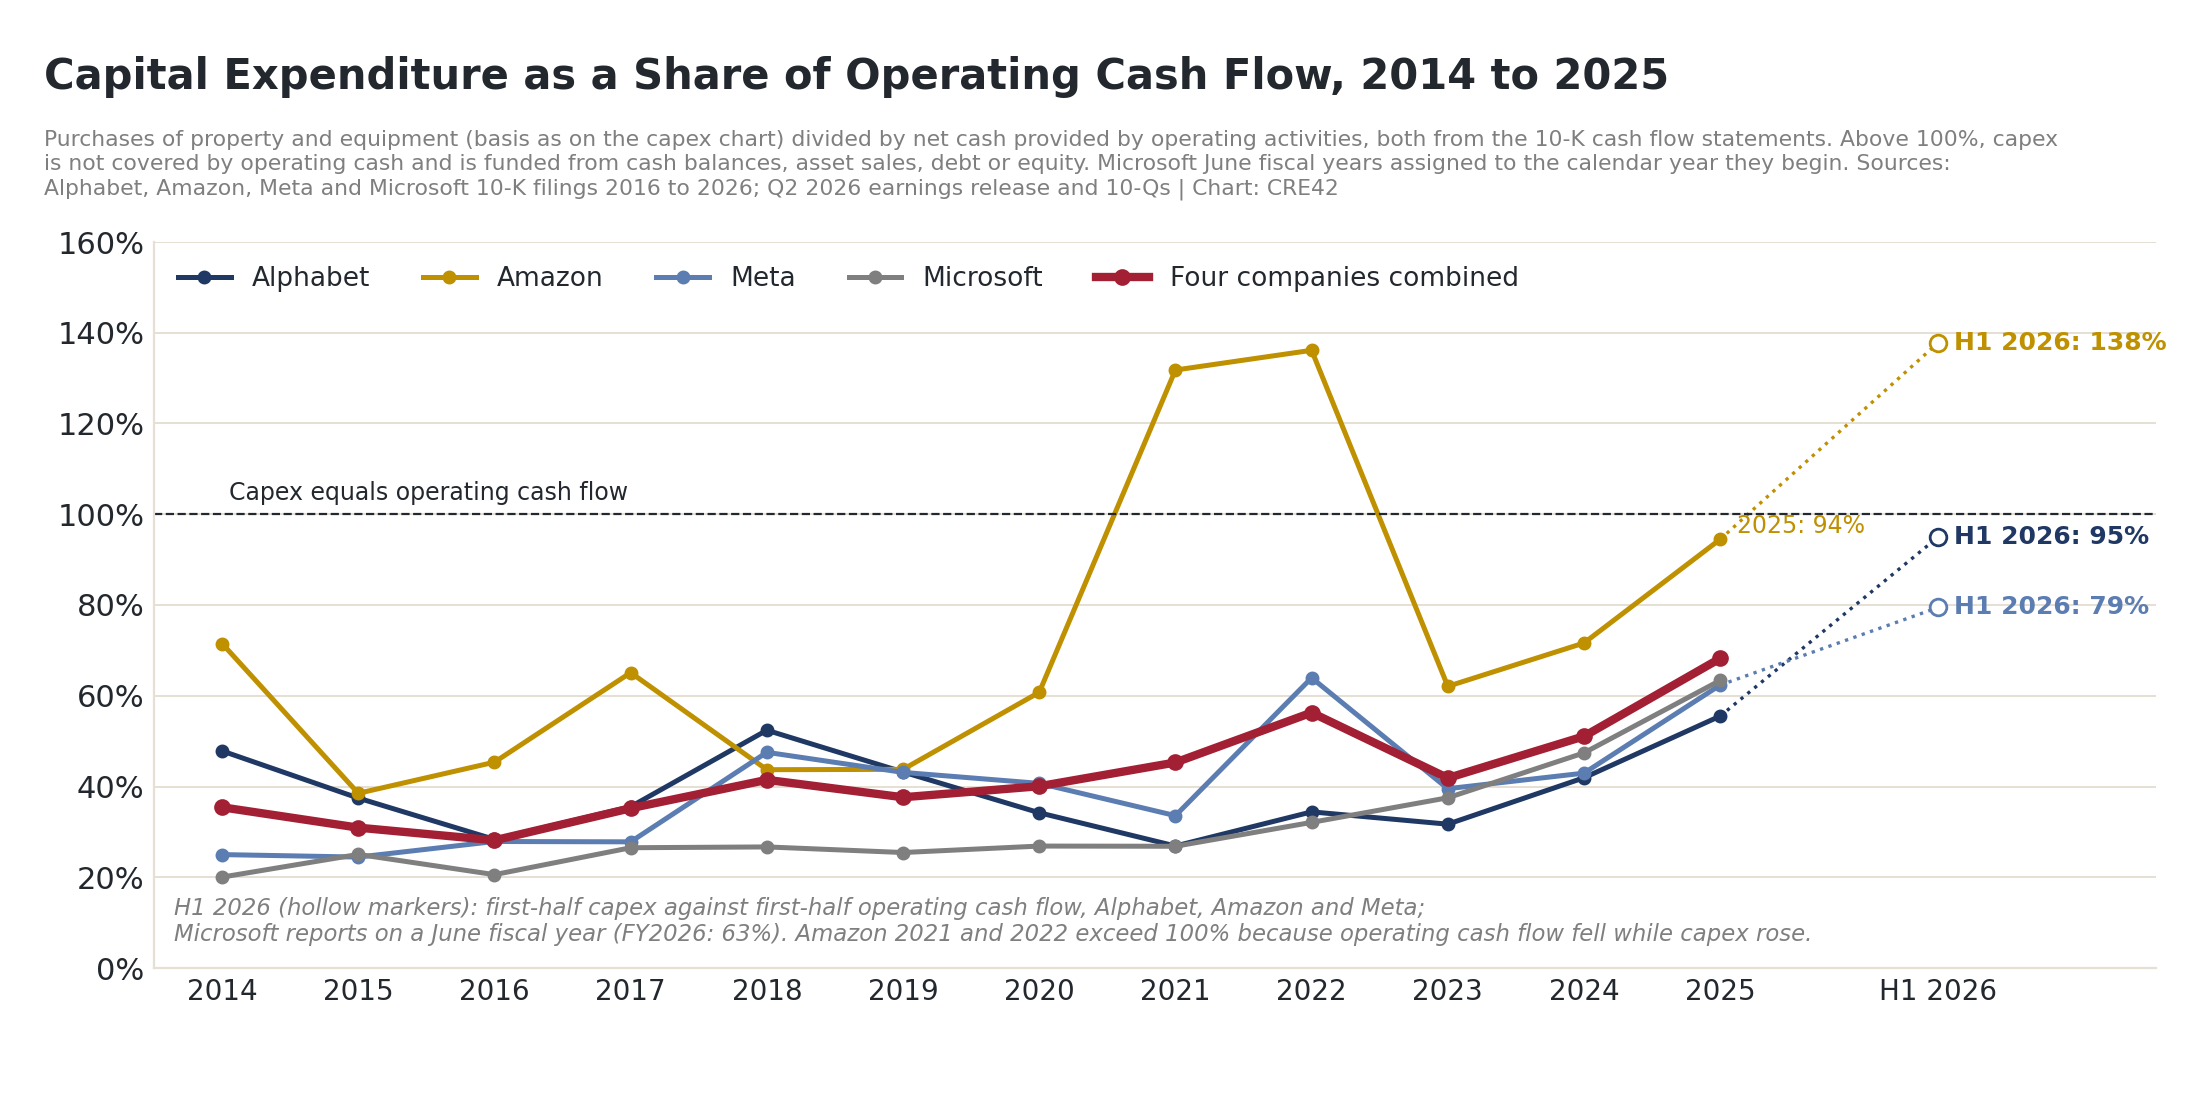
Capital Expenditure as a Share of Operating Cash Flow, 2014 to 2025 | Sources: Alphabet, Amazon, Meta, Microsoft 10-K filings 2016 to 2026; Q2 2026 earnings release and 10-Qs
- Through 2023 the four companies together spent 28–56% of operating cash flow on capex. The combined ratio was 51% in 2024 and 68% in 2025 (Amazon alone was 94%); in the first half of 2026 it was 95% at Alphabet, 138% at Amazon and 79% at Meta. Microsoft, on a June fiscal year, spent 63% of operating cash flow on property and equipment in FY2026.[15]
- Amazon has been here before: its ratio exceeded 100% in 2021 and 2022, when operating cash flow fell while the logistics and AWS buildout continued, and it borrowed through that period.
- Above 100% capex is not covered by operating cash and is funded from cash balances, asset sales, debt or equity. (See The Financing Shift, below.)
Q2 2026 snapshot ($ billions)
| Company | Quarter capex | Quarter operating cash flow | Quarter free cash flow | 2026 capex guidance | Basis |
|---|---|---|---|---|---|
| Alphabet | $44.9 | $39.1 | −$5.9 | $195–205 | Purchases of property and equipment |
| Amazon | $54.2 | $45.4 | −$7.6 (trailing twelve months) | about $220 | Cash capex, net of incentives |
| Meta | $31.1 | $31.9 | $0.8 | $130–145 | Includes finance lease principal |
| Microsoft (Q4 FY2026) | $41.0 | $55.4 | $19.6 | about $175 (calendar 2026) | Includes finance leases; cash paid for property and equipment $35.8 |
| Oracle (FY2026) | $55.7 (full year) | n/a | n/a | about $70 net cash outlay, FY2027 | Reported capex higher by $20–25 of customer prepayments |
- The definitions differ (finance leases in or out; gross or net of incentives), so the four-company total is quoted as a range of $720–745 billion and the basis is stated wherever a figure is used.[1]
The Financing Shift
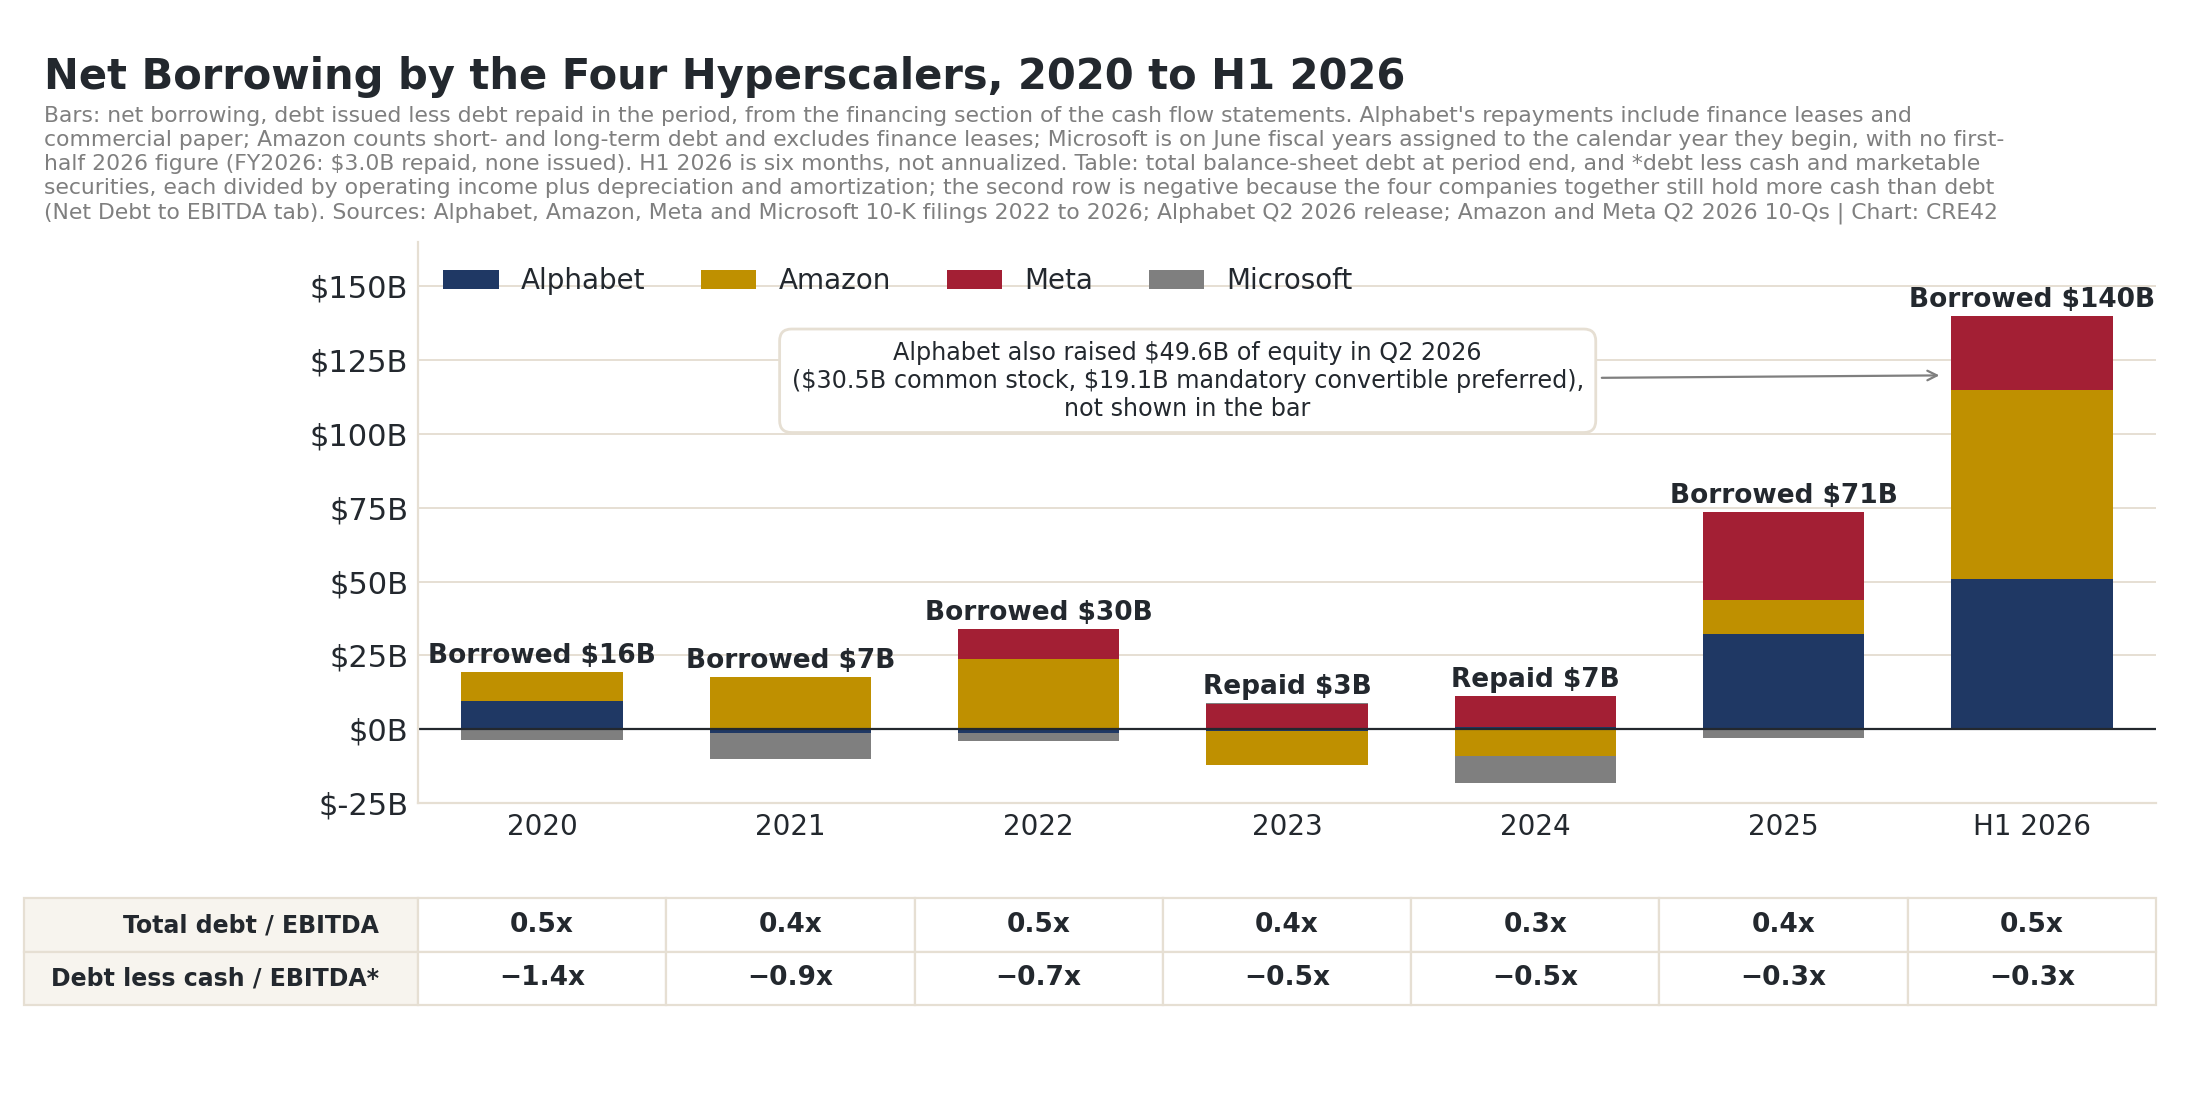
Net Borrowing by the Four Hyperscalers, 2020 to H1 2026 | Sources: Alphabet, Amazon, Meta, Microsoft 10-K filings 2022 to 2026; Alphabet Q2 2026 release; Amazon and Meta Q2 2026 10-Qs
- The bars are net borrowing: debt issued less debt repaid in each period. Until 2024 the four companies were, in aggregate, repaying debt or borrowing modestly: $53 billion net over 2020 to 2022, then net repayments in 2023 and 2024. They borrowed $71 billion net in 2025 and $140 billion in the first half of 2026 alone: Alphabet $51 billion, Amazon $64 billion, Meta $25 billion.[16]
- Alphabet also raised $49.6 billion of equity in the second quarter of 2026, $30.5 billion of common stock and $19.1 billion of mandatory convertible preferred, the first large equity issuance by any of the four in the buildout.[16]
- The rows above the bars are balance-sheet leverage, a different measure from the bars. Total debt of the four companies was $351 billion at June 30, 2026 against trailing EBITDA of $645 billion, 0.5x, about where it was in 2020 (0.5x), because EBITDA has nearly tripled while debt has tripled. The second row subtracts cash and marketable securities ($533 billion at June 2026) from that debt, which leaves −$182 billion: the four companies together still hold more cash than debt, so the multiple is negative, −0.3x. It was −1.4x at the end of 2020, so the cash cushion relative to earnings has shrunk by three-quarters even though total leverage is unchanged. Amazon is the one company whose debt now exceeds its cash ($5.9 billion at June 30, 2026). The arithmetic by company is in the expandable table below.[17]
- Oracle, outside the four, plans to raise about $40 billion of debt and equity in its fiscal 2027, including a $20 billion at-the-market equity program, against a net capex outlay of about $70 billion; customer prepayments of $20–25 billion reduce the cash it must fund itself.[2]
Operating Incomes and Margins
| Business | Q2 2026 revenue | Growth, year on year | Operating income and margin | Source |
|---|---|---|---|---|
| Amazon Web Services | $42.2B | +37% | $16.6B, 39% | Amazon Q2 2026 10-Q |
| Google Cloud | $24.8B | +82% | $8.8B, 36% | Alphabet Q2 2026 release |
| Microsoft Azure and other cloud services | not disclosed separately | +43% | Intelligent Cloud segment; Azure revenue passed $100B in FY2026 | Microsoft Q4 FY2026 release |
| Oracle Cloud Infrastructure | $18.1B (FY2026, full year) | +77% | not disclosed by segment | Oracle Q4 FY2026 release |
- The three largest cloud businesses grew revenue 37% to 82% year on year in the June 2026 quarter, at operating margins of 36% to 39% where disclosed. Those are the cash flows the capex is meant to serve; the question the borrowing chart poses is whether they grow into the spending before the hardware is replaced.[18]
What to Watch For in 2026 and Beyond
| Source | Report / Series | Frequency | Notes |
|---|---|---|---|
| Alphabet, Amazon, Meta, Microsoft | Quarterly cash flow statements: capex, operating cash flow, debt issued and repaid | Quarterly | 2027 guidance arrives on the January and February 2027 calls |
| Oracle | Quarterly results; FY2027 funding plan | Quarterly (September, December, March, June) | Net cash outlay vs. reported capex; at-the-market equity issuance |
| NVIDIA | 10-K and 10-Q: data center revenue, gross margin, geographic revenue | Quarterly (fiscal year ends late January) | Margin add-back input |
| U.S. Census Bureau, International Trade | Imports by HS code and country (HS 8471) | Monthly, about five weeks after month end | Server import series |
| U.S. Census Bureau | Construction Spending (C30), data center line | Monthly | Shared with the measuring page; refresh together |
| McKinsey & Company | Data center capex projections | Irregular | Projection source for the 2027 to 2030 segment |
[1] Purchases of property and equipment from the 10-K cash flow statements of Alphabet, Amazon and Meta and additions to property and equipment for Microsoft, fiscal 2014 through 2025 (Microsoft June fiscal years assigned to the calendar year in which they begin; Meta includes principal payments on finance leases from 2019; Amazon gross of incentives from 2016, net for 2014 and 2015, the only figure it reported then). 2026 guidance from the Q2 2026 earnings releases and calls, July 2026: Alphabet $195–205 billion, Amazon about $220 billion cash capex, Meta $130–145 billion including finance lease principal, Microsoft about $175 billion for calendar 2026. The Alphabet guidance figure is taken from a third-party transcript of the July 2026 call. Q2 2026 snapshot figures from the same releases and 10-Qs. ↩
[2] Oracle, Q4 and fiscal 2026 results (June 10, 2026) and earnings call: fiscal 2026 capex $55.7 billion; fiscal 2027 projected net cash outlay for capital expenditures of about $70 billion, excluding $20–25 billion of customer prepayments and timing effects that raise reported capex; plan to raise about $40 billion in debt and equity in fiscal 2027 including a $20 billion at-the-market equity issuance. investor.oracle.com ↩
[3] CPI-U annual averages, 1800 to 2025, Federal Reserve Bank of Minneapolis (1967 = 100; 2025 average 967.5). Program costs: FHWA, Final Interstate Cost Estimate (1991), $128.9 billion; USTelecom, provider capital expenditure 1996 to 2001, $513.6 billion; Dreier, “An Improved Cost Analysis of the Apollo Program,” Space Policy (2022) and The Planetary Society, $28.0 billion nominal, about $280 billion in 2020 dollars on NASA’s New Start Index; railroad capitalization from the 1860 U.S. Census (Table 38) and Hornbeck & Rotemberg (2024). minneapolisfed.org ↩
[4] U.S. share: long-lived assets by geographic area, Alphabet 10-K FY2025 (Note 15), Meta 10-K FY2025 (geographic information), Microsoft 10-K FY2026 (segment note); the U.S. share of each company’s latest annual increase is 73%, 92% and 68%, 76% weighted by dollars, applied as 75% to all four including Amazon, which reports property and equipment by segment only. Colocation layer: Equinix capital expenditures in its Americas segment times the U.S. share of Americas property (78%, FY2025 10-K), and Digital Realty improvements to investments in real estate times the North America share of consolidated rentable square feet (85% FY2019, 69% FY2022, 58% FY2025), from the two companies’ 10-Ks for FY2016, FY2019, FY2022 and FY2025; acquisitions of existing buildings are excluded. Enterprise data centers, the neoclouds and private colocation operators are not in the metric; hyperscaler capex includes some non-data-center spending (Amazon logistics, offices). The two errors run in opposite directions and are not netted. ↩
[5] McKinsey & Company, “The cost of compute: A $7 trillion race to scale data centers” (April 2025): $6.7 trillion of global data center capital expenditure 2025 to 2030 in the base case ($5.2 trillion AI, $1.5 trillion non-AI); $3.7 trillion and $7.9 trillion for AI in the constrained and accelerated cases. The U.S. share and the subtraction of 2025 and 2026 are CRE42’s; the segment is nominal. mckinsey.com ↩
[6] U.S. Census Bureau, Construction Spending (C30), value of private construction put in place, data center category, not seasonally adjusted annual totals 2014 to 2025 ($1.8 billion to $49.7 billion) adjusted to 2025 dollars, plus January to July 2026 ($37.2 billion) multiplied by 12/7, nominal. census.gov ↩
[7] U.S. content: 40% building side (Cushman & Wakefield 2026 cost mix scaled to $20 billion per GW; see the measuring page) applied to the full $1,787 billion, $715 billion; the 28.4% design-margin add-back described in the expandable section applied to AI-era spending only (2024 and 2025 in 2025 dollars plus 2026 guidance, $1,049 billion), $298 billion; U.S. content $1,013 billion. Applying the add-back to every year since 2014 would give $1,223 billion and is not used. Workbook: Domestic Content tab, reconciliation block (lines A to L). ↩
[8] Data center row: adjusted U.S. content of the CRE42 U.S. data center capex figure through 2026, $1,013 billion (reconciliation line J; 2014 to 2025 in 2025 dollars plus 2026 guidance, so the ratio is slightly overstated against nominal GDP), divided by 13 years, against the 2014 to 2026 average of nominal GDP ($23.7 trillion: BEA annual GDP via FRED series GDPA for 2014 to 2025, and the average of the Q1 and Q2 2026 seasonally adjusted annual rates, $31,866 billion and $32,486 billion, for 2026, BEA second estimate, August 26, 2026). AI-era years: 68% of $312.6 billion against $30,762 billion (2025); 68% of $549.4 billion against $32,176 billion (2026). Historical rows are carried over from the previous version of this page. fred.stlouisfed.org ↩
[9] Cost distribution per the measuring page (Cushman & Wakefield, Data Center Development Cost Guide 2026; McKinsey, The Cost of Compute, April 2025, 60% of AI investment to technology developers and designers). Center for Strategic and International Studies, “The U.S. Data Center Build-Out Depends on GPU Imports” (March 10, 2026). csis.org ↩
[10] U.S. Census Bureau, International Trade API, general imports by country, harmonized code 8471 (automatic data processing machines and units), January 2023 to June 2026, customs value; retrieved September 3, 2026. The code covers all computers (servers, PCs, storage) for all buyers and excludes separately shipped accelerators (HS 8473 and 8542) and networking equipment (HS 8517). api.census.gov ↩
[11] Grupo Financiero Banamex, Economic Studies Department, as reported by Mexico News Daily (August 14, 2026): Mexico 34.5% and Taiwan 36% of U.S. server imports in the first half of 2026; “Mexico has established itself as an assembly platform close to the U.S. market, while design, technological integration and chain coordination activities remain concentrated in Asia.” Context only; no figure on this page is derived from it. mexiconewsdaily.com ↩
[12] CSIS (note 9) on GPU production and packaging in Taiwan. Arizona wafer production, Taiwan packaging, the Amkor Arizona (2028) and TSMC Arizona packaging timelines, HBM sourcing and the Houston and Fort Worth assembly plants per industry reporting (Tom’s Hardware, July 6, 2026), used for the supply-chain description only. tomshardware.com ↩
[13] NVIDIA Form 10-K, fiscal year ended January 25, 2026: gross margin 71.1% (75.0% in fiscal 2025); Data Center revenue $193.7 billion; revenue from U.S.-headquartered customers $149.6 billion of $215.9 billion, with 76% of Data Center revenue from Taiwan-headquartered customers attributed to end customers in the United States and Europe. The two-thirds Nvidia-priced share of the hardware layer is a CRE42 assumption. investor.nvidia.com ↩
[14] Amazon 10-K FY2025: effective January 1, 2025, the estimated useful lives of a subset of servers and networking equipment were changed from six years to five. Meta 10-K FY2025: useful lives of most servers and network assets extended to 5.5 years effective January 1, 2025. Alphabet and Microsoft: six years for servers and network equipment per their 10-Ks. ↩
[15] Capex on the basis in note 1 divided by net cash provided by operating activities, both from the 10-K cash flow statements, 2014 to 2025. H1 2026: Alphabet Q2 2026 release (year to date: capex $80.6 billion, operating cash flow $84.9 billion), Amazon Q2 2026 10-Q (six months: $98.4 billion and $71.4 billion), Meta Q2 2026 10-Q (six months: $49.1 billion plus $1.8 billion of finance lease principal, against $64.1 billion). Microsoft FY2026 (July 2025 to June 2026): additions to property and equipment $115.9 billion against net cash from operations $182.9 billion. ↩
[16] Net borrowing: proceeds from issuance of debt less repayments, financing section of the cash flow statements: Alphabet 10-K FY2022 and FY2025 and Q2 2026 release (Alphabet’s repayments include finance leases and commercial paper; Q2 2026 equity: proceeds from issuance of common stock $30.5 billion and mandatory convertible preferred $19.1 billion, net of costs); Amazon 10-K FY2022 and FY2025 and Q2 2026 10-Q (short-term and long-term debt; finance lease repayments excluded); Meta 10-K FY2022 and FY2025 and Q2 2026 10-Q; Microsoft 10-K FY2022 to FY2026, June fiscal years assigned to the calendar year in which they begin, with no calendar-half figure (FY2026: $3.0 billion repaid, no issuance). ↩
[17] Total debt is long-term debt plus current and short-term debt where the balance sheet reports them, lease liabilities excluded; debt less cash also subtracts cash and cash equivalents and marketable securities; EBITDA is income from operations plus depreciation and amortization as reported in the cash flow statement; June 2026 uses trailing twelve months for Alphabet, Amazon and Meta and fiscal 2026 for Microsoft. Aggregate debt was $104 billion, cash and marketable securities $413 billion and debt less cash −$309 billion against EBITDA of $223 billion at the end of 2020; at June 30, 2026 the figures were $351 billion, $533 billion, −$182 billion and $645 billion. Balance sheets from the 10-Ks and 10-Qs cited above; Alphabet, Amazon and Meta year-end 2020 and Amazon year-end 2023 from the FY2020 and FY2023 10-Ks on SEC EDGAR. Workbook tab: Net Debt to EBITDA. ↩
[18] Amazon Q2 2026 10-Q: AWS net sales $42.2 billion, up 37%; AWS operating income $16.6 billion. Alphabet Q2 2026 release: Google Cloud revenue $24.8 billion, up 82%; operating income $8.8 billion. Microsoft Q4 FY2026 release: Azure and other cloud services revenue up 43%; Azure revenue surpassed $100 billion for the fiscal year. Oracle Q4 FY2026 release: cloud infrastructure revenue $18.1 billion for fiscal 2026, up 77%. ↩
Companion workbook. data-centers-capital-spending.xlsx: hyperscaler capex by company 2014–2026, the CRE42 U.S. capex metric with the McKinsey-implied projection, capex against operating cash flow, net borrowing, debt and cash against EBITDA, the domestic-content adjustment, the booms summary and CPI derivations, HS 8471 imports by country, the GDP table and a Sources tab. The retired $3.0 trillion model is archived separately and no longer appears on this page.
Sources
- Alphabet, Amazon, Meta and Microsoft, Forms 10-K for fiscal 2016, 2019, 2022, 2023 and 2025 (Microsoft fiscal 2017, 2020, 2022, 2023, 2024 and 2026); Alphabet Q2 2026 earnings release; Amazon and Meta Q2 2026 Forms 10-Q; Q2 2026 earnings calls. sec.gov
- Oracle Corporation, Q4 and fiscal 2026 results and earnings call, June 10, 2026. investor.oracle.com
- NVIDIA Corporation, Form 10-K for the fiscal year ended January 25, 2026. investor.nvidia.com
- Equinix, Inc. and Digital Realty Trust, Inc., Forms 10-K for fiscal 2016, 2019, 2022 and 2025. investor.equinix.com; investor.digitalrealty.com
- McKinsey & Company, The Cost of Compute: A $7 Trillion Race to Scale Data Centers (April 2025). mckinsey.com
- U.S. Census Bureau, Construction Spending (C30), value of private construction put in place, data center category, September 1, 2026 release. census.gov
- U.S. Census Bureau, International Trade API, imports by harmonized code and country. api.census.gov
- Federal Reserve Bank of Minneapolis, Consumer Price Index, 1800–. minneapolisfed.org
- Federal Highway Administration, “Final Interstate Cost Estimate” (1991) and “Target: $27 Billion, The 1955 Estimate.” fhwa.dot.gov; fhwa.dot.gov
- USTelecom, 2024 Broadband Capex Report; NRTC, reporting USTelecom 2000 and 2001 capex. ustelecom.org; nrtc.coop
- Dreier, Casey, “An Improved Cost Analysis of the Apollo Program,” Space Policy (2022); The Planetary Society, “How Much Did the Apollo Program Cost?”; NASA congressional testimony (1973). sciencedirect.com; planetary.org
- Hornbeck & Rotemberg, “Railroads, Reallocation, and the Rise of American Manufacturing,” NBER / University of Chicago (2024); U.S. Census Bureau, Preliminary Report on the Eighth Census (1860), Table 38. bfi.uchicago.edu; census.gov
- Center for Strategic and International Studies, “The U.S. Data Center Build-Out Depends on GPU Imports” (March 2026). csis.org
- CRE42, U.S. National Balance Sheet (GDP denominator; Federal Reserve Z.1). inflation-debt-balance-sheet.html
Methodology & Data Notes
CPI adjustment standard. All historical figures are adjusted to 2025 dollars using the Consumer Price Index (CPI-U) annual averages compiled by the Federal Reserve Bank of Minneapolis (1967 = 100), including its pre-1913 series; the 2025 annual average is 967.5, the same base used on the other CRE42 inflation pages. One exception: the Apollo figure uses NASA’s New Start Index (NNSI), an aerospace-specific deflator, as published by the Planetary Society, to reach 2020 dollars, and CPI from 2020 to 2025. NNSI produces a higher adjusted figure than CPI because aerospace costs have historically inflated faster than consumer prices.
Railroad expansion (~$360 billion). No single source reports total railroad capital expenditure 1860 to 1910. We constructed an estimate using two anchor points: $1.134 billion capitalization in 1860 (U.S. Census) and $8.0 billion in 1890 (Hornbeck & Rotemberg), yielding $6.9 billion in net new capital over 133,000 new miles (about $51,600 per mile nominal). We extended this cost-per-mile ratio to the remaining 76,400 miles built 1890 to 1910, producing $10.8 billion total nominal. Each decade’s share was CPI-adjusted separately. The period was broadly deflationary (CPI 27 in 1860 and 28 in 1910), minimizing distortion from the constant cost-per-mile assumption. Full calculations are in the workbook.
Dot-com / telecom boom (~$985 billion). Based on USTelecom’s provider-level capital expenditure data, which tracks company filings from wireline, wireless and cable broadband providers. Six-year total (1996 to 2001): $513.6 billion nominal, adjusted year by year (multiplier about 1.9x). This is a conservative figure: it excludes satellite providers, electric co-ops, smaller ISPs, enterprise IT networking and dot-com-era server buildouts. We chose USTelecom over the Richmond Fed’s broader BEA/NIPA communications investment data because its scope (provider capex) is the closer analogy to data center operator capex.
Interstate Highway System (~$730 billion). Based on FHWA’s final Interstate Cost Estimate (1991): $128.9 billion total (federal and state). Because annual spending data is not available in a single FHWA table, we applied a CPI midpoint approach using 1976 as the spending-weighted midpoint of the 1956 to 1992 construction period (CPI 171.0; multiplier 5.66x): $729 billion.
Apollo program (~$350 billion). Based on the Planetary Society’s peer-reviewed cost reconstruction from original NASA budget justification documents: $28.0 billion nominal (1960 to 1973), including Project Gemini and robotic lunar precursor programs, about $280 billion in 2020 dollars on NASA’s New Start Index, carried to 2025 with the CPI ratio 967.5/777.7 (24.4%): $348 billion. The narrower Apollo-only figure is $25.8 billion nominal, about $257 billion in 2020 dollars.
CRE42 U.S. data center capex metric. Capital spending landed in U.S. data centers, 2014 to 2030, built in four steps. (1) Four-company hyperscaler capex on the basis in note 1, times a 75% U.S. share taken from the 10-K geographic notes (the U.S. share of each company’s latest annual increase in long-lived assets, dollar-weighted). (2) A colocation layer: Equinix Americas capital expenditures times the U.S. share of its Americas property, plus Digital Realty improvements to investments in real estate times its North America share of consolidated rentable square feet; acquisitions of existing buildings excluded. (3) 2026 is the four-company guidance midpoint times 75%, nominal, with no colocation figure. (4) 2027 to 2030 is McKinsey’s $6.7 trillion global base case times 75%, less the metric’s 2025 and 2026 values, spread evenly and nominal. Actuals through 2025 are CPI-adjusted to 2025 dollars. The metric includes land, chips and servers and excludes enterprise data centers, the neoclouds and private colocation operators; hyperscaler capex includes some non-data-center spending. The Census construction series is shown separately and is not part of the metric.
U.S. content. The building side of an AI campus (about 40% of all-in cost) is treated as U.S. content; the hardware layer (about 60%) as imported, a treatment supported by the HS 8471 import series. The U.S.-booked design margin on the chips is added back as 60% times an assumed two-thirds Nvidia-priced content times Nvidia’s fiscal 2026 gross margin of 71.1%, about 28% of capex, giving U.S. content of about 68% for AI-era spending. In the cumulative comparison the add-back is applied only to 2024 onward, the years in which Nvidia-priced accelerators dominate the hardware layer, so U.S. content through 2026 is $1,013 billion against a gross figure of $1,787 billion. The Nvidia-content share is a CRE42 assumption; other U.S. and foreign margins are not modeled.
Net borrowing and leverage. Net borrowing (the bars on the financing chart) is proceeds from debt issuance less repayments in the period, from the financing section of each cash flow statement, on each company’s own definition (note 16); it is a flow. The two rows above the bars are stocks at period end: total debt to EBITDA is aggregate balance-sheet debt over aggregate income from operations plus depreciation and amortization; debt less cash to EBITDA subtracts cash and marketable securities from the debt first (note 17), so a negative multiple means the group holds more cash than debt. Both are shown because the first says how much debt is carried relative to earnings and the second how much of the cash cushion remains.
Capex as a share of GDP. The data center row uses the adjusted U.S. content of the CRE42 U.S. data center capex figure through 2026 (reconciliation line J), averaged over 2014 to 2026, against the average of nominal GDP over the same years (BEA via FRED; 2026 is the average of the Q1 and Q2 2026 annual rates, replaced by the annual figure when published). The bullet under the table also gives the AI-era years alone. Historical rows use period-average nominal GDP and are carried over from the previous version of this page.