The projected $3.0 trillion (see methodology below) in U.S. data center capital spending from 2025 to 2030 would be the largest concentrated infrastructure investment in American history — by a wide margin. To put this figure in perspective, we compare it to four of the nation’s most transformative capital expenditure programs, all adjusted to 2025 dollars using the Consumer Price Index.
U.S. Capital Spending Booms — Cumulative Investment (2025 Dollars)
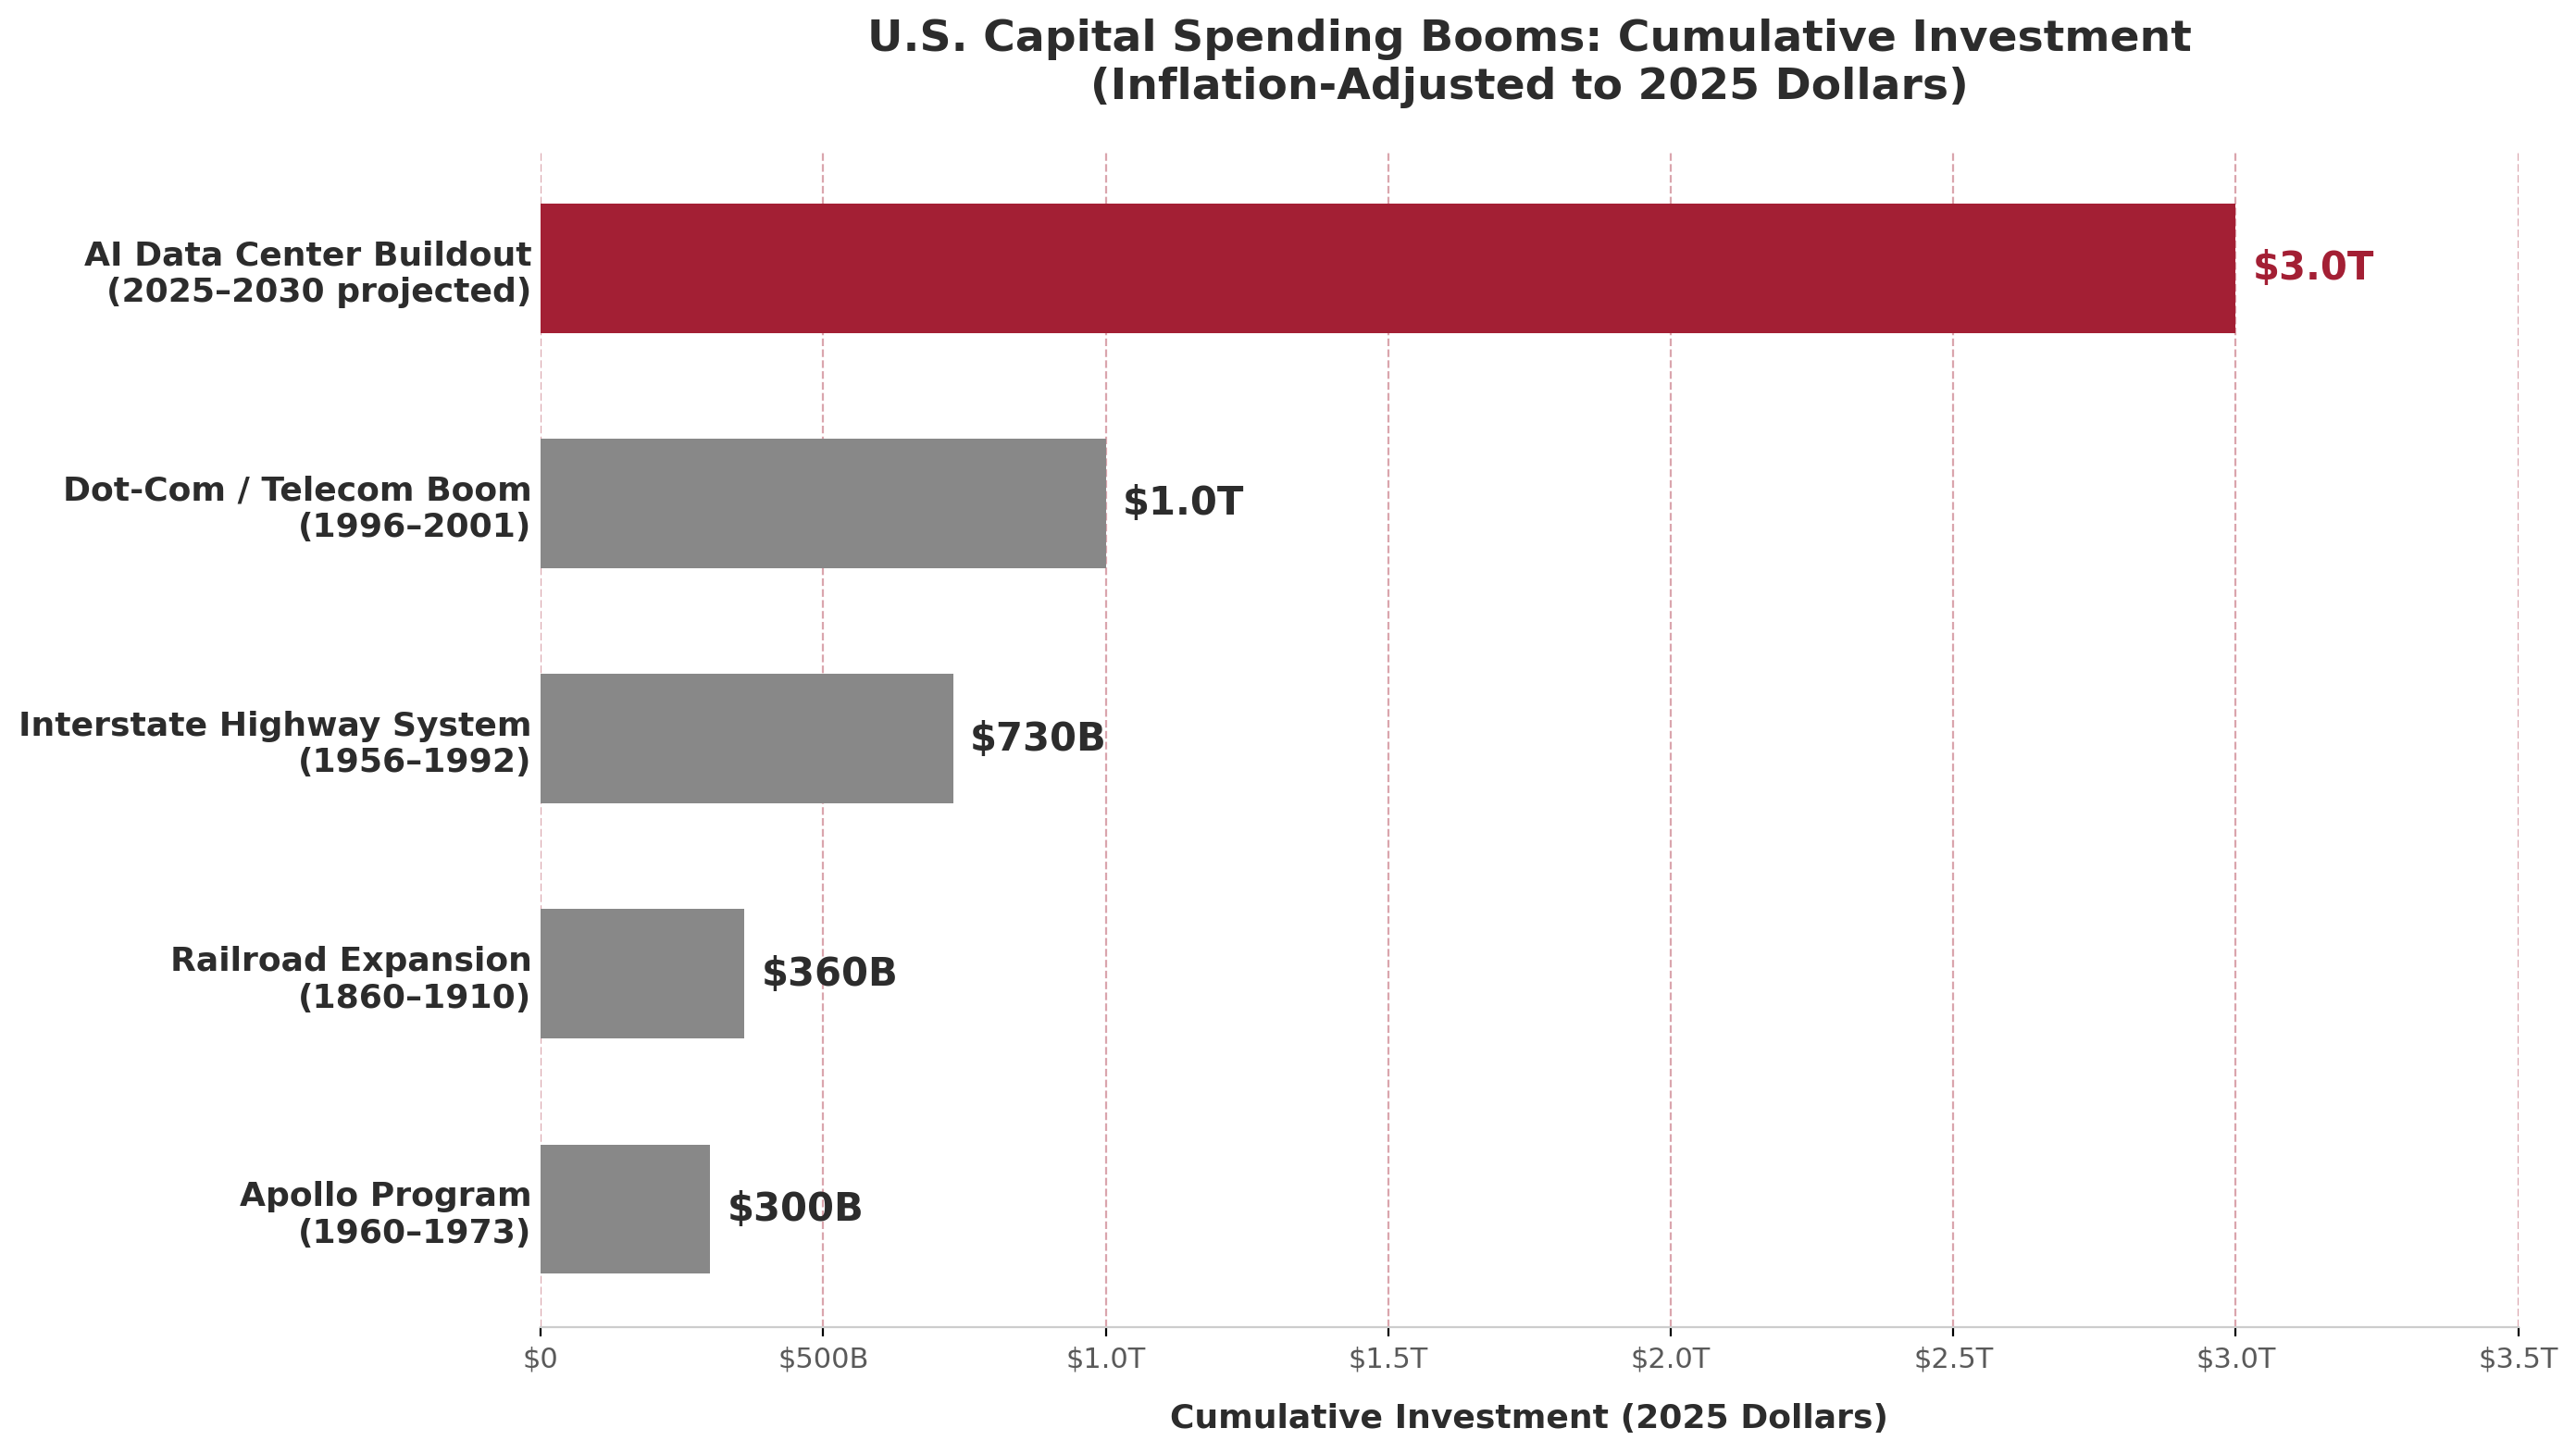
U.S. Capital Spending Booms — Cumulative investment adjusted to 2025 dollars. AI Data Center Buildout is a CRE42 projection for 2025–2030. Analysis: CRE42.com
Document Links
data-centers-capital-spending.xlsx — Underlying data, cost model, sensitivity analysis, CPI adjustments, and full source citations
Key Takeaways
Context & Discussion
The AI buildout is projected to cost around $3 trillion between 2025 and 2030, significantly bigger than any other single capex event in history. For context, $3 trillion is roughly equal to the entire annual GDP of France ($3.3T), the United Kingdom ($3.5T), or India ($4.1T), and larger than Italy ($2.5T) or Canada ($2.3T), per the IMF World Economic Outlook (2024 nominal GDP estimates). The primary hyperscalers (Microsoft, Alphabet, Amazon, and Meta) spent ~$381 billion in 2025 and have already announced $635–665 billion for 2026.
The data center boom differs from historical predecessors in important ways. First, its timeframe is extraordinarily compressed: $3 trillion over six years, compared to $129 billion over 36 years for the highways or $10.8 billion over 50 years for the railroads. Second, it is almost entirely private capital at risk — hyperscalers (Microsoft, Google, Amazon, Meta), colocation providers, and their investors are making directional bets on AI demand without federal appropriations or guaranteed revenue streams. Third, the constraint is not primarily financial but physical: power generation capacity, grid interconnection timelines, water availability, and skilled labor are the binding limits on how fast data centers can actually be built.
Whether this buildout represents a sustainable investment cycle or a speculative bubble is the central question for CRE investors. On the bubble side: S&P 500 and AI-adjacent companies are trading at elevated P/E ratios relative to historical norms; Bank of America estimates hyperscaler capex reached 94% of operating cash flows (minus dividends and buybacks) in 2025–2026, up from 76% in 2024, approaching the limits of self-funding; hyperscalers raised $108 billion in debt in 2025 alone, a meaningful shift from their historically cash-funded model; physical constraints around power, water, and environmental sustainability are real and tightening; and AI-related cloud services generated roughly $25 billion in revenue in 2025 — approximately 10% of what hyperscalers spent on infrastructure that year. On the other side: the capital is coming from the most profitable companies in history — if AI disappeared tomorrow, Microsoft, Alphabet, Amazon, and Meta would still be enormous, profitable businesses; the majority of capex is still equity-funded from operating cash flows, not speculative debt (though this is shifting); adoption is accelerating faster than almost any prior technology, with McKinsey reporting 88% of large enterprises using AI in at least one business function (up from 78% a year prior), generative AI adoption more than doubling from 33% to 71% in a single year, and ChatGPT reaching 400 million monthly active users by early 2025; the cost per AI query is declining rapidly as model efficiency improves and hardware scales; and AI is arguably the most general-purpose technology ever deployed, touching every knowledge-work function from coding to legal to medical to creative.
Sources
1. FHWA, “Final Interstate Cost Estimate” (1991) — $128.9B total cost, $114.3B federal share. fhwa.dot.gov
2. FHWA, “Target: $27 Billion — The 1955 Estimate.” fhwa.dot.gov
3. USTelecom, “2024 Broadband Capex Report” — provider-level capital expenditure data 1996–2023. ustelecom.org
4. NRTC, reporting USTelecom 2000–2001 peak broadband capex figures. nrtc.coop
5. Dreier, Casey. “An Improved Cost Analysis of the Apollo Program,” Space Policy (2022). sciencedirect.com
6. The Planetary Society, “How Much Did the Apollo Program Cost?” (2022). planetary.org
7. Hornbeck & Rotemberg, “Railroads, Reallocation, and the Rise of American Manufacturing,” U. Chicago / NBER (2024). bfi.uchicago.edu
8. U.S. Census Bureau, Preliminary Report on the Eighth Census (1860), Table 38 — railroad capitalization. census.gov
9. Federal Reserve Bank of Minneapolis, Consumer Price Index 1800–present. minneapolisfed.org
10. NASA, congressional testimony on Apollo costs (1973) — $25.4B total reported to Congress.
Methodology
CPI Adjustment Standard
All historical figures are adjusted to 2025 dollars using the Bureau of Labor Statistics Consumer Price Index (CPI-U), sourced from the Federal Reserve Bank of Minneapolis for pre-1913 data. CPI January 2025 = 967.5 (1967=100 base). One exception: the Apollo figure uses NASA’s New Start Index (NNSI), an aerospace-specific deflator, as published by the Planetary Society. NNSI produces a higher adjusted figure than CPI (~$300B vs ~$190B) because aerospace costs have historically inflated faster than consumer prices. This is noted for transparency.
Railroad Expansion (~$360B)
No single source reports total railroad capital expenditure 1860–1910. We constructed an estimate using two anchor points: $1.134B capitalization in 1860 (U.S. Census) and $8.0B in 1890 (Hornbeck & Rotemberg), yielding $6.9B in net new capital over 133,000 new miles (~$51,600/mile nominal). We extended this cost-per-mile ratio to the remaining 76,400 miles built 1890–1910, producing $10.8B total nominal. Each decade’s share was CPI-adjusted separately. The period was broadly deflationary (CPI 27 in both 1860 and 1910), minimizing distortion from the constant cost-per-mile assumption. Full calculations are in the accompanying Excel workbook.
Dot-Com/Telecom Boom (~$1.0T)
Based on USTelecom’s provider-level capital expenditure data, which tracks actual company filings from wireline, wireless, and cable broadband providers. Six-year total (1996–2001): $513.6B nominal. CPI-adjusted using period-average CPI of ~499 and 2025 CPI of 967.5 (multiplier: 1.94×). This is a conservative figure: it excludes satellite providers, electric co-ops, smaller ISPs, enterprise IT networking, and dot-com-era server buildouts. We chose USTelecom over the Richmond Fed’s broader BEA/NIPA communications investment data because its scope (provider capex) is a closer analogy to data center operator capex.
Interstate Highway System (~$730B)
Based on FHWA’s final Interstate Cost Estimate (1991): $128.9B total (federal + state). Because annual spending data is not readily available in a single FHWA table, we applied a CPI midpoint approach using ~1976 as the spending-weighted midpoint of the 1956–1992 construction period. CPI 1976 ≈ 170.5; multiplier to 2025: 5.67×. Result: $128.9B × 5.67 = ~$731B, rounded to $730B.
Apollo Program (~$300B)
Based on the Planetary Society’s peer-reviewed cost reconstruction from original NASA budget justification documents: $28.0B nominal (1960–1973), including Project Gemini and robotic lunar precursor programs. Inflation-adjusted to ~$280B in 2020 dollars using NASA’s New Start Index. We scaled forward to 2025 using CPI growth 2020–2025 (~18%), yielding ~$300B. The narrower Apollo-only figure is $25.8B nominal / ~$257B adjusted.
Note: Capex as a Share of GDP
To illustrate relative economic weight, the table below shows average annual capital spending as a percentage of average annual nominal U.S. GDP during each boom period.
| Boom | Period | Nominal Total | Avg Annual Capex | Avg Annual GDP | % of GDP |
|---|---|---|---|---|---|
| AI/Data Center | 2025–2030 | ~$3.0T (proj.) | ~$500B | ~$33T | ~1.5% |
| Railroad Expansion | 1860–1910 | $10.8B | ~$216M | ~$15B | ~1.4% |
| Dot-Com/Telecom | 1996–2001 | $513.6B | ~$85.6B | ~$9.6T | ~0.9% |
| Apollo Program | 1960–1973 | $25.8B | ~$2.0B | ~$850B | ~0.2% |
| Interstate Highway | 1956–1992 | $128.9B | ~$3.6B | ~$2.5T | ~0.1% |
The GDP comparison reveals what the inflation-adjusted bar chart obscures: relative to the size of the economy at the time, the railroad buildout consumed nearly as large a share of national output as projected data center spending does today. The Interstate Highway System, despite its enormous physical footprint, was spread across 36 years and never dominated annual GDP the way shorter, more concentrated booms do.