
Comparing State Fiscal Outlooks
Companion to Comparing MSA Fiscal Outlooks, which covers the principal cities of the 35 largest metros.
State Fiscal Scorecard
Pensions and Healthcare
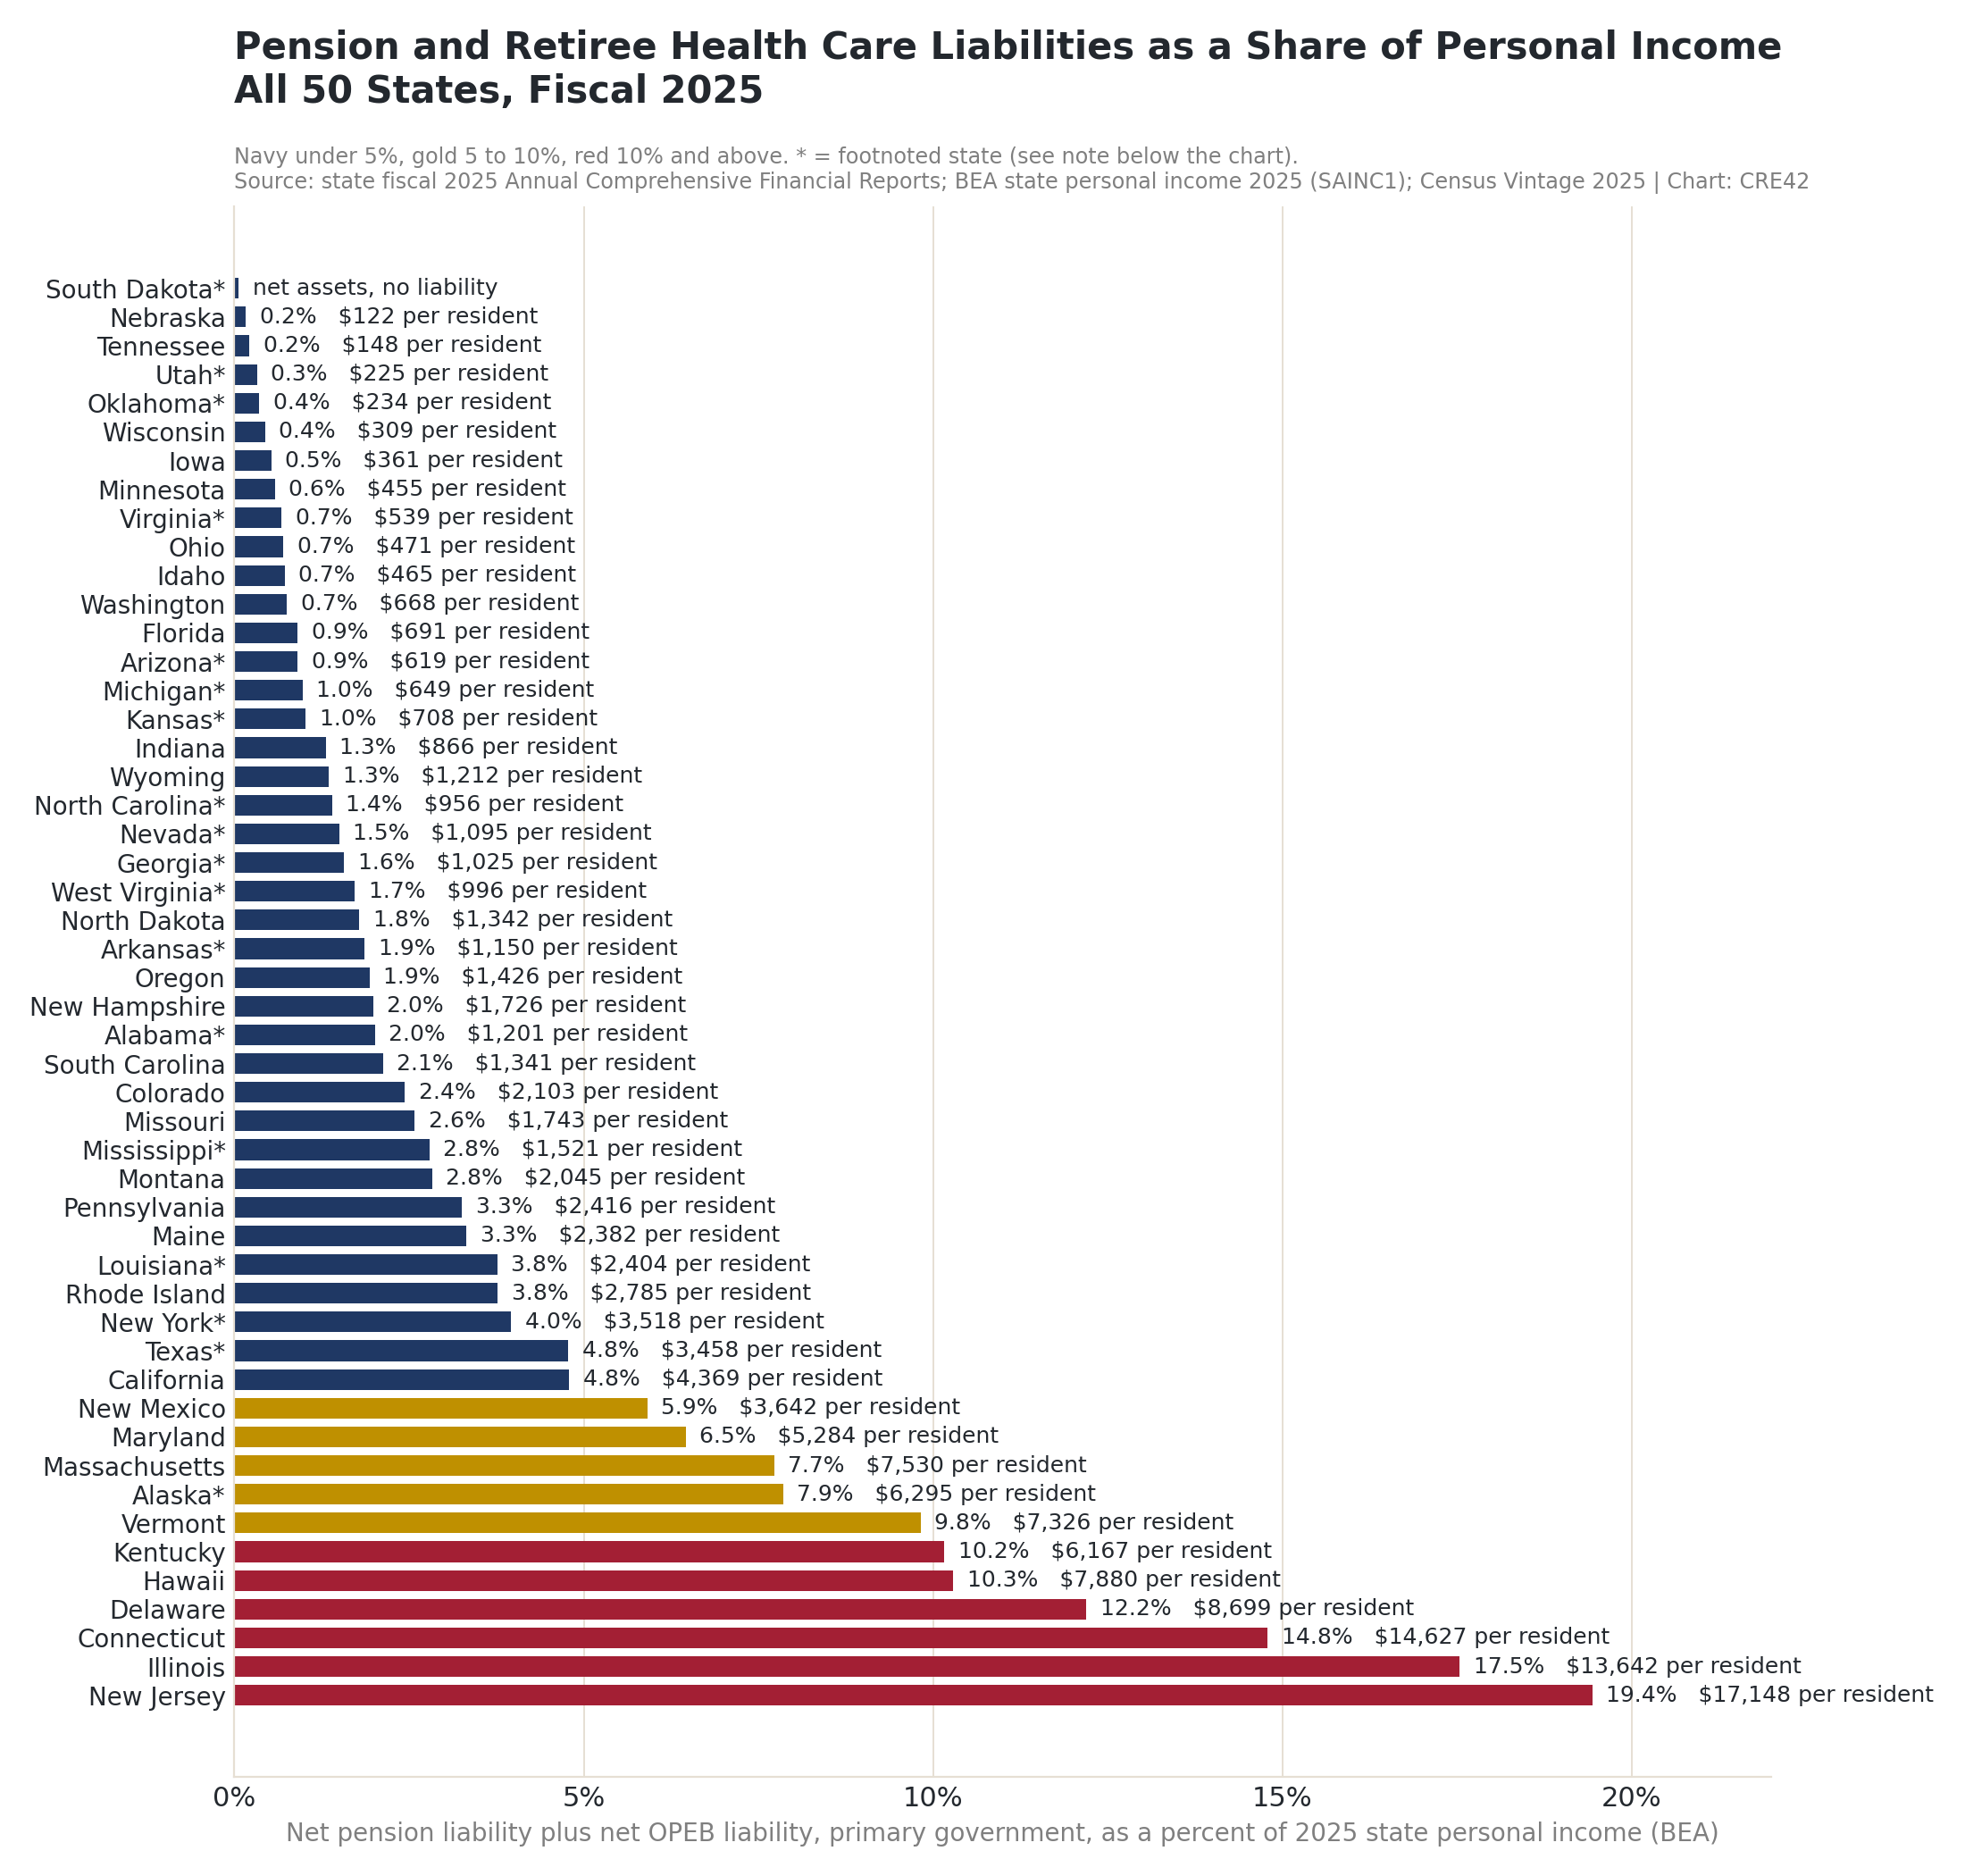
Net Pension Liability plus Net OPEB Liability as a Share of State Personal Income, Fiscal 2025 | Source: state fiscal 2025 ACFRs; [1] BEA state personal income 2025; Census Vintage 2025 | Chart: CRE42
*Arizona, Mississippi, Nevada, Oklahoma reflect most recent reports as of 2024 (2025 not yet available); New York, Alabama, Michigan, Texas report on a fiscal year not ending in June; Alaska, South Dakota, Utah, West Virginia report no OPEB liability; Arkansas, Louisiana, Virginia, North Carolina, Georgia, Kansas have various quirky reporting (see scorecard above for complete list).
Rainy-Day Funds and Reserves
Every state except New Jersey keeps a budget stabilization fund, and the size of that fund relative to a year of general fund spending is the reserve measure the agencies, NASBO and Pew all lead with. Balances peaked in fiscal 2024 on pandemic-era surpluses and capital-gains revenue; NASBO’s Spring 2026 survey has them at $191 billion for fiscal 2025 and projects $183 billion for fiscal 2026 and $160 billion for fiscal 2027 as states draw down.
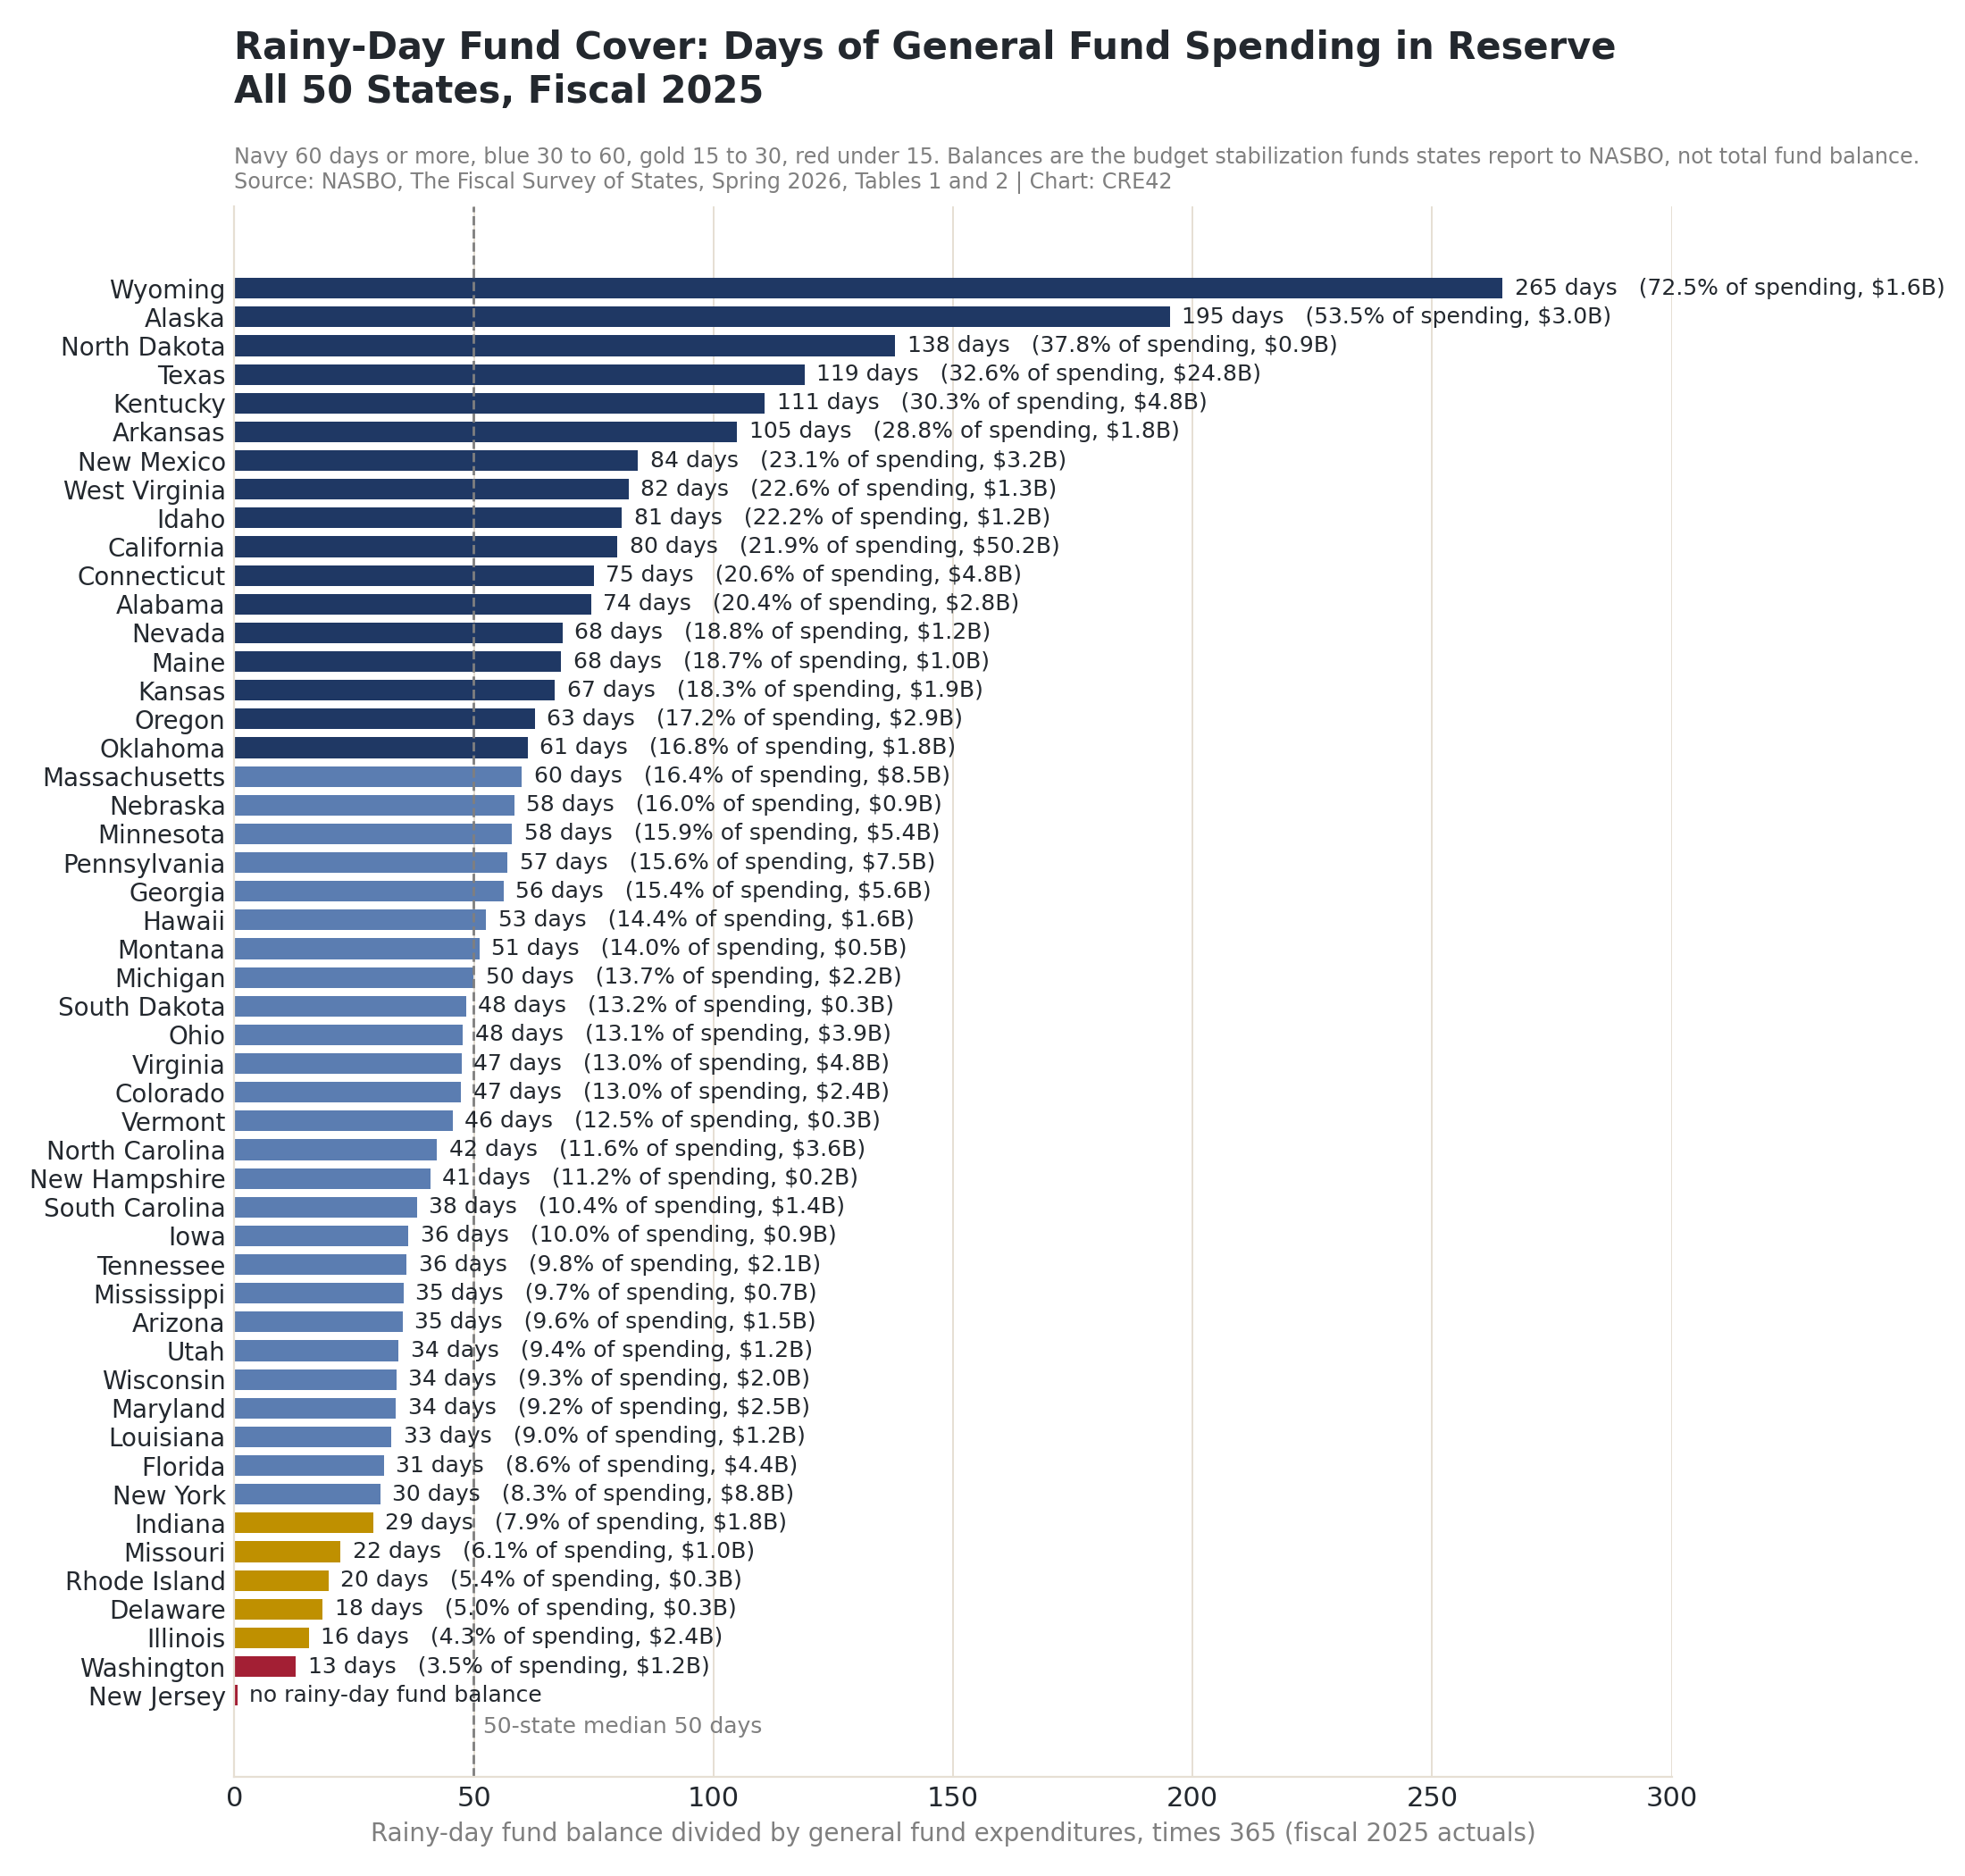
Rainy-Day Fund Balance as Days of General Fund Expenditures, Fiscal 2025 | Source: NASBO, The Fiscal Survey of States, Spring 2026 | Chart: CRE42
State Credit Ratings
Ratings as of September 2, 2026. [2]
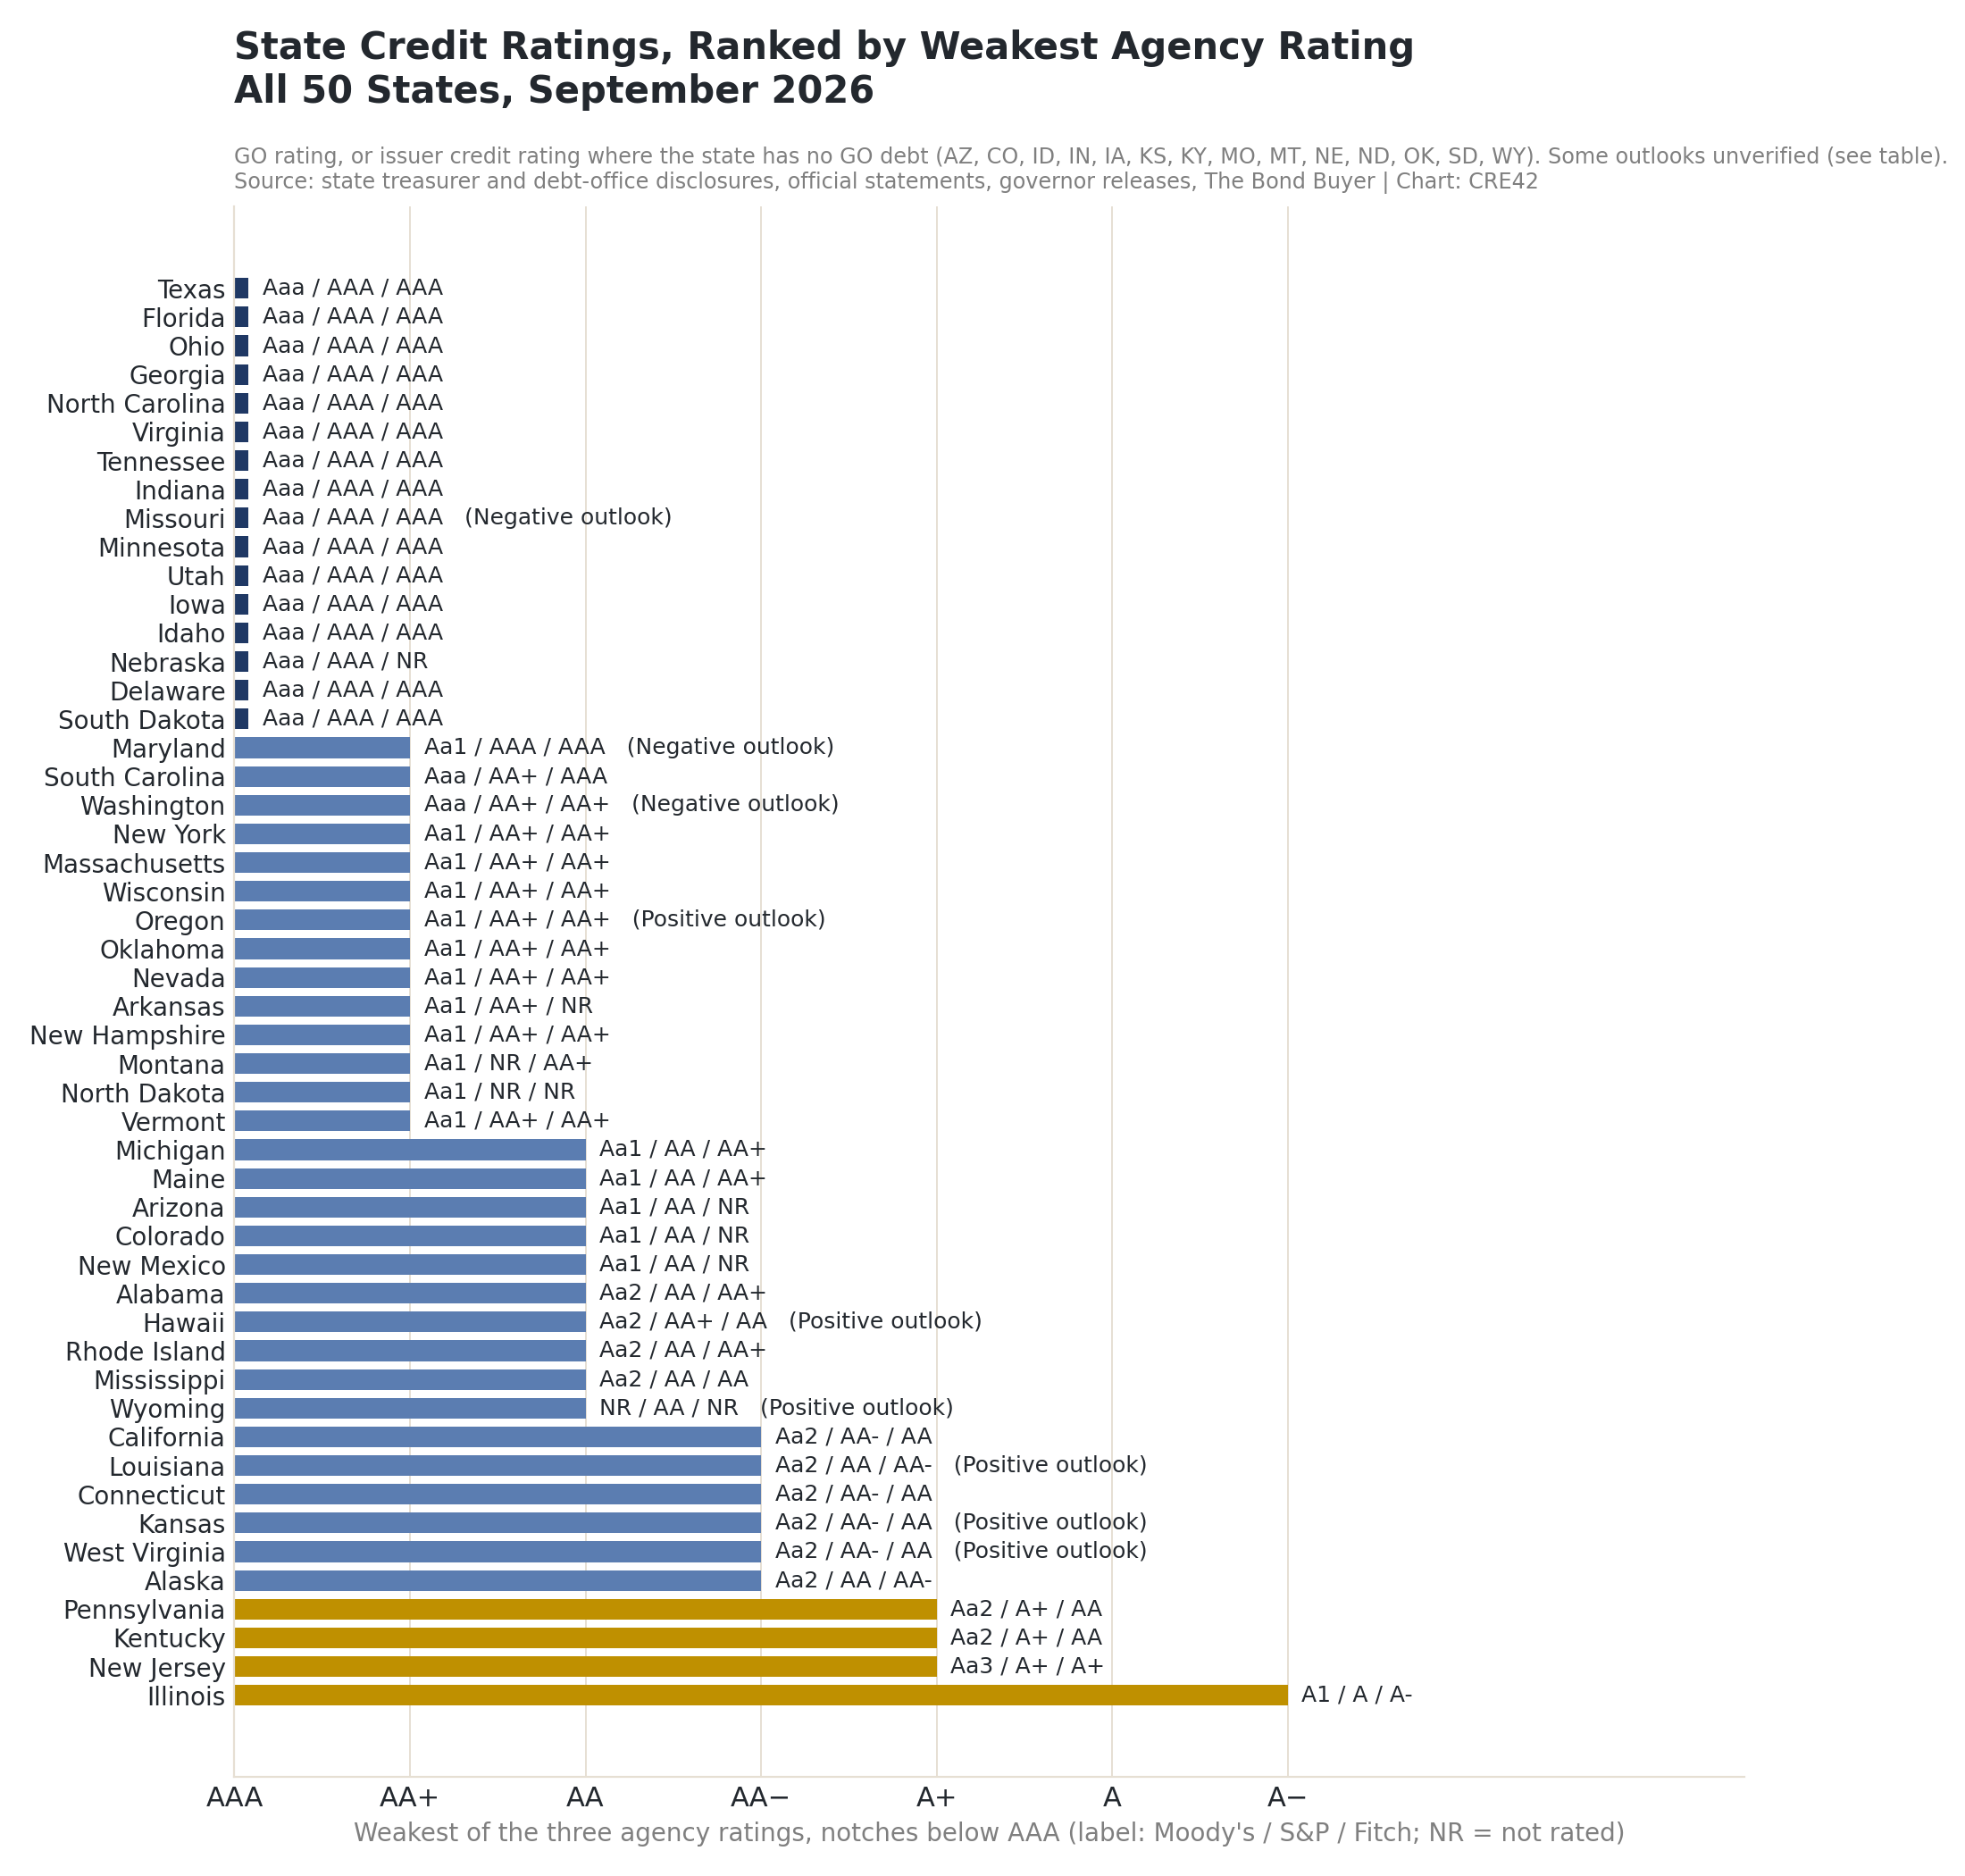
State Credit Ratings Ranked by Weakest Agency Rating, September 2026 | Source: state treasurer and debt-office disclosures, official statements, governor releases, The Bond Buyer | Chart: CRE42
Agency Ratings vs. Balance Sheets
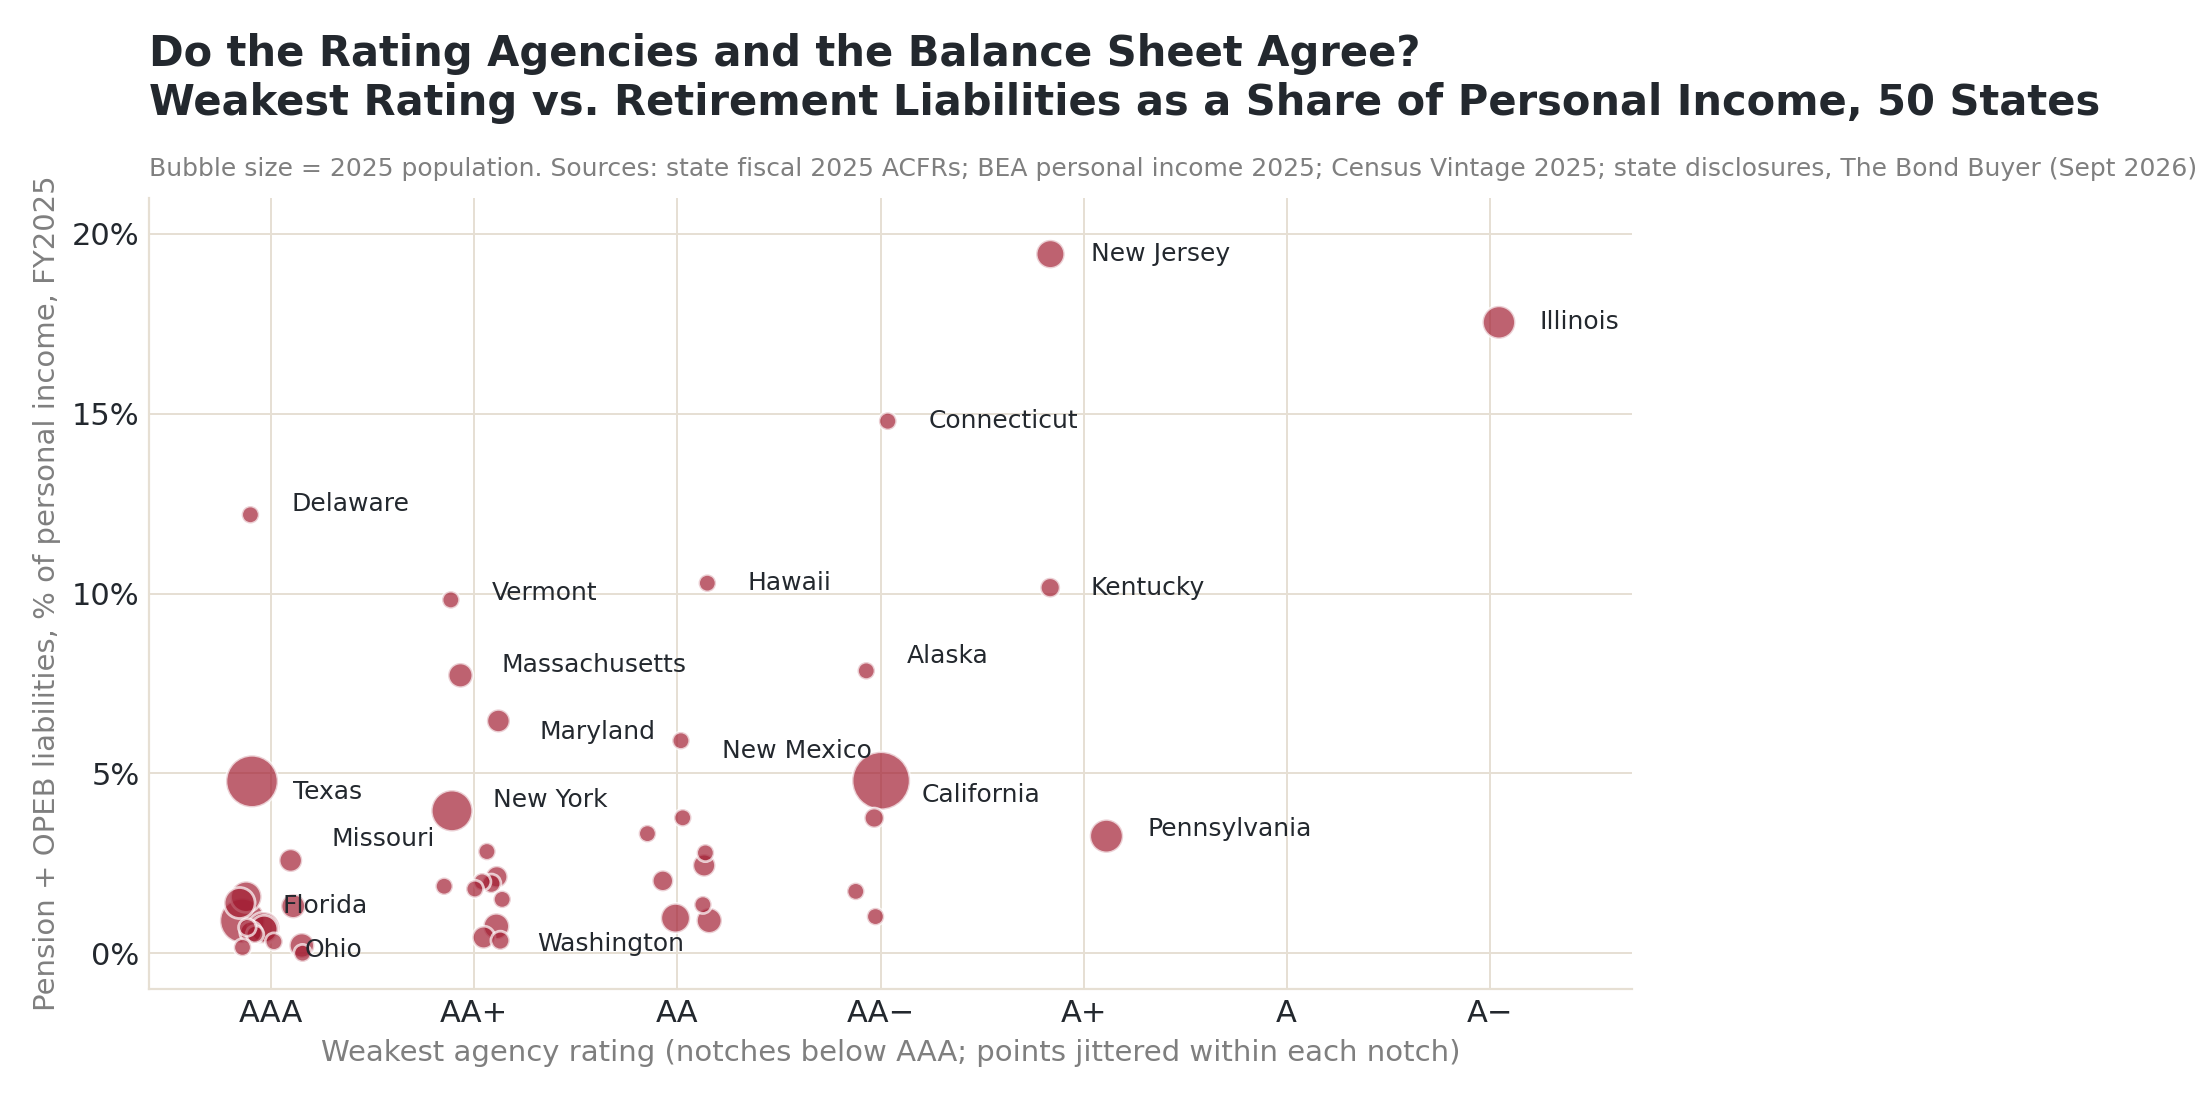
Weakest Agency Rating vs. Pension + OPEB Liabilities as a Share of Personal Income, 50 States, Bubble Size = 2025 Population | Sources: state fiscal 2025 ACFRs; BEA; Census Vintage 2025; state disclosures and The Bond Buyer (September 2026) | Chart: CRE42
Key Observations
Fiscal Burden and Migration
The domestic migration pages rank the states by where Americans are moving. Overlaying the fiscal ranking on that one shows how far the two lists coincide, and where they do not.
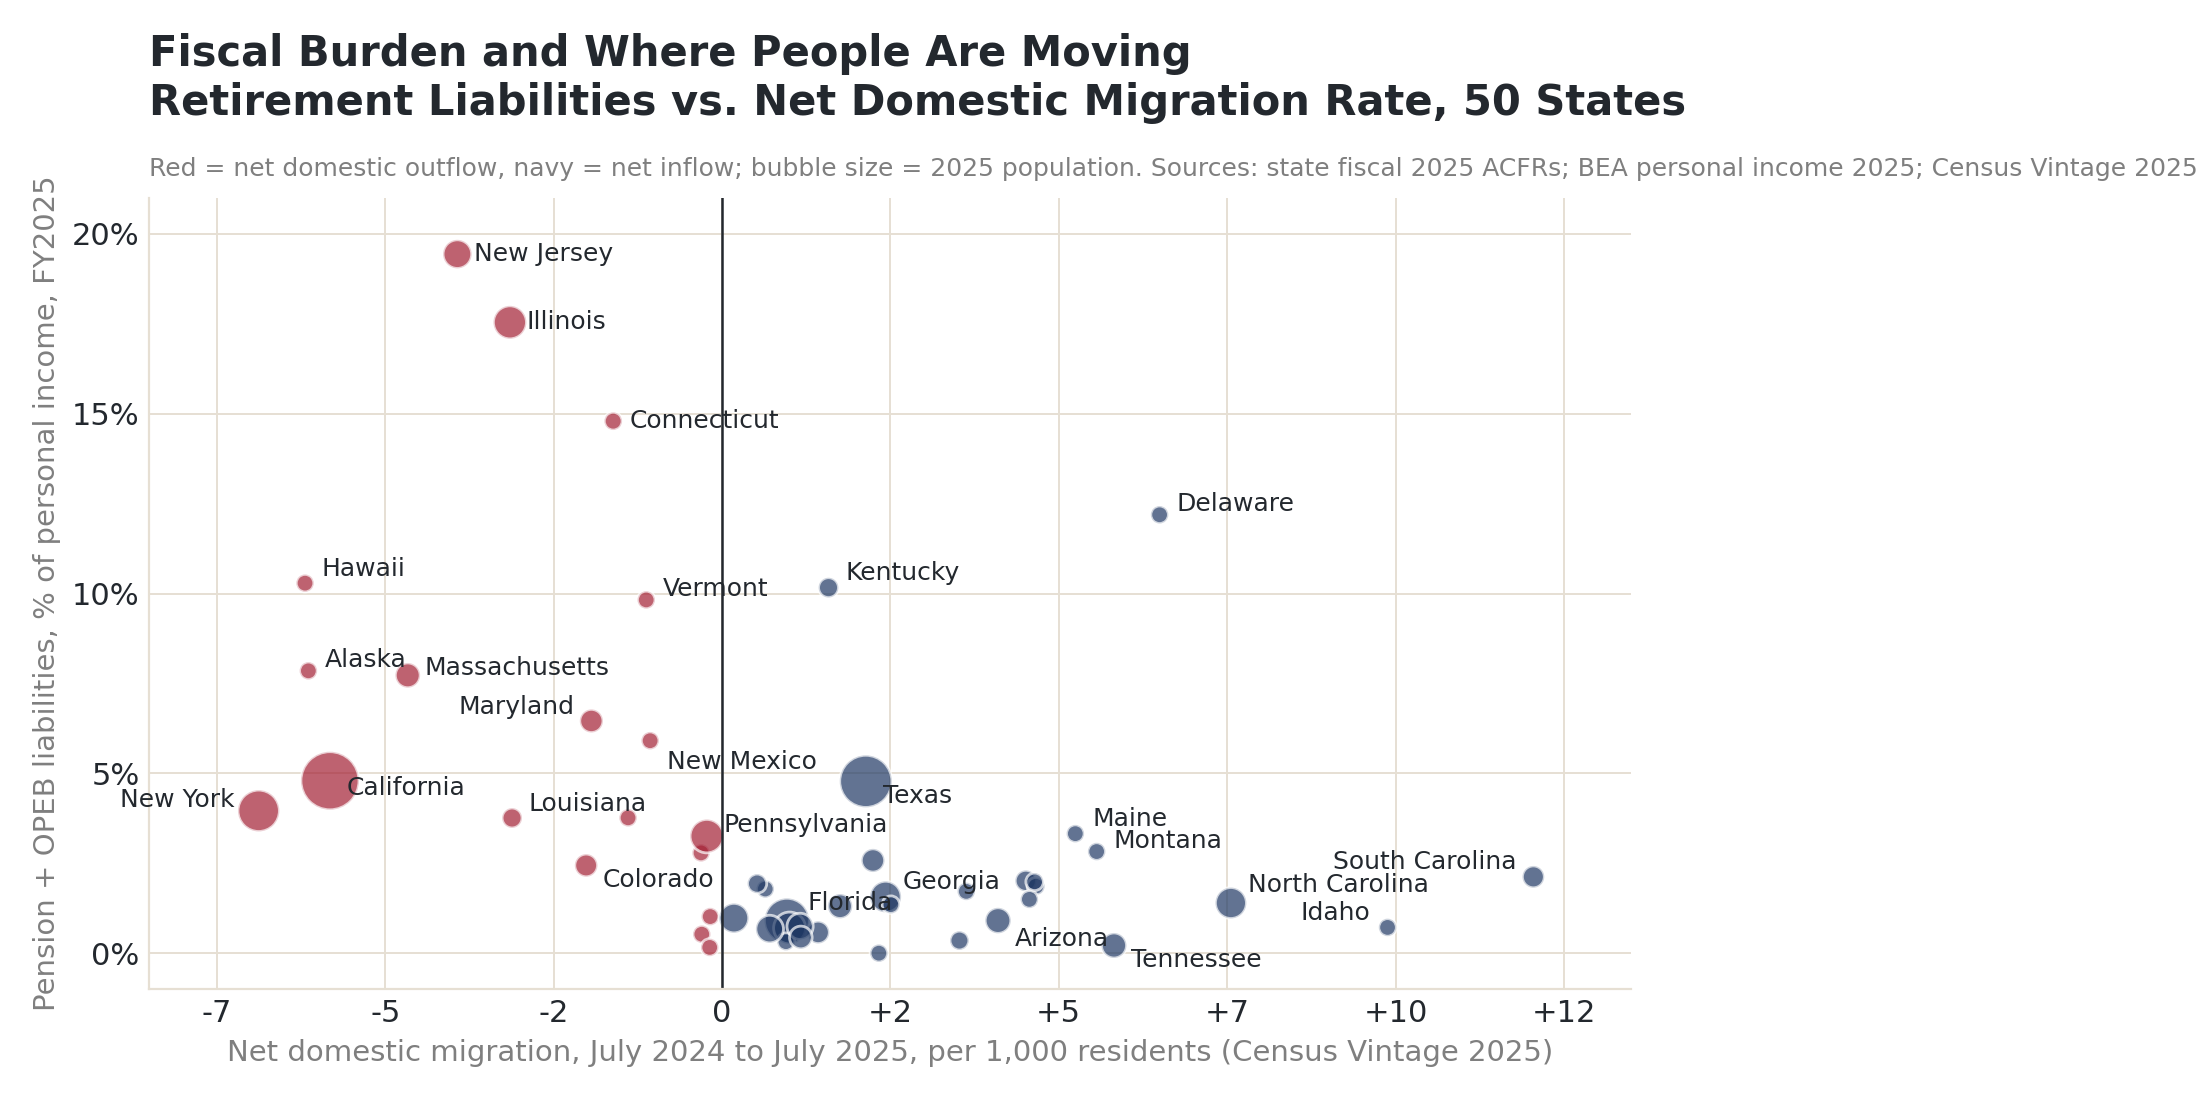
Pension + OPEB Liabilities as a Share of Personal Income vs. Net Domestic Migration Rate, 50 States | Sources: state fiscal 2025 ACFRs; BEA; Census Vintage 2025 | Chart: CRE42
What to Watch For in 2026 and Beyond
Sources to Track State Fiscal Health in 2026:
| Source | Report or Series | Frequency | Notes |
|---|---|---|---|
| State ACFRs (via EMMA or state comptroller sites) | Fiscal 2026 Annual Comprehensive Financial Reports: Statement of Net Position, Governmental Funds statements, long-term obligations note | Annual (December 2026 to June 2027 for fiscal 2026) | Refresh the pension, OPEB and net position figures once the fiscal 2026 audits post; the companion workbook lists each state’s report URL |
| NASBO | The Fiscal Survey of States (spring and fall) | Twice yearly | Rainy-day fund balances, general fund revenues and expenditures, enacted and proposed budgets for all 50 states |
| Pew Charitable Trusts, Fiscal 50 | Reserves and balances; long-term obligations; revenue volatility | Annual | Days-of-cover and liabilities-to-personal-income indicators on the same basis as this page |
| The Bond Buyer | Rating-action coverage for state issuers | Daily | Fastest public record of upgrades, downgrades and outlook changes |
| U.S. Bureau of Economic Analysis | State personal income (SAINC1, SQINC1) | Quarterly; annual revision each September | The denominator for the liabilities-to-income measure; the September 30, 2026 annual update will revise 2025 |
| U.S. Census Bureau | Annual Survey of State Government Finances | Annual (about two years after the fiscal year) | Revenue mix and tax structure by state; the primary source for any revenue-side extension of this page |
| Lincoln Institute of Land Policy | 50-State Property Tax Comparison Study | Annual | Effective tax rates on commercial, industrial and apartment property; the direct link from state finances to CRE operating costs |
Notes
[1] Balance-sheet measures are taken from each state’s fiscal 2025 Annual Comprehensive Financial Report (ACFR), the audited statements every state publishes after its fiscal year ends. Forty-six states end their fiscal year on June 30; New York ends March 31 (its fiscal 2025 report covers the year to March 31, 2025), Texas August 31, and Alabama and Michigan September 30. Arizona, Mississippi, Nevada and Oklahoma had not published a fiscal 2025 report as of September 2, 2026 and are carried at fiscal 2024, marked with an asterisk. The liability measure is the net pension liability plus the net OPEB liability (or total OPEB liability where the retiree health plan is unfunded) of the primary government, from the government-wide Statement of Net Position or, where that statement folds them into long-term liabilities (19 states), from the long-term obligations note; it is not netted against pension or OPEB assets, and component units (universities, housing authorities) are excluded. It is divided by BEA’s 2025 state personal income and by the Census Bureau’s July 1, 2025 population. The PDF page of each statement is in the scorecard table; the verbatim lines are on the companion workbook’s ACFR Source Lines tab. Arkansas’s report has no text layer and was read by optical character recognition; Arkansas also reports a single Governmental Fund rather than a General Fund. ↩
[2] Ratings are the issuer-level general obligation rating from Moody’s, S&P Global and Fitch as of September 2, 2026, taken from each state’s treasurer or debt-office page, its most recent official statement or continuing-disclosure report, governor and treasurer releases, and The Bond Buyer. Fourteen states issue no general obligation debt (Arizona, Colorado, Idaho, Indiana, Iowa, Kansas, Kentucky, Missouri, Montana, Nebraska, North Dakota, Oklahoma, South Dakota, Wyoming); for those the issuer credit rating is used. Where an agency does not rate the state (Fitch in Arizona, Arkansas, Colorado, Nebraska, New Mexico, North Dakota and Wyoming; S&P in Montana and North Dakota; Moody’s in Wyoming) the cell reads NR. No composite is computed; the ranking uses the weakest of the three. Alabama’s ratings (Aa2/AA/AA+) are from the State’s June 16, 2026 general obligation official statement; Alaska’s Fitch rating is shown as AA− per the state treasury page though the last dated report showed A+; Maryland’s Moody’s Aa1 is shown although the state ended its Moody’s contract in May 2026. These and a handful of unconfirmed outlooks are listed in the Flags column. ↩
[3] Rating agencies and Pew use personal income rather than population as the denominator to better represent a state’s ability to pay over time. Personal income is the Bureau of Economic Analysis measure of all income received by a state’s residents (wages, proprietors’ income, dividends, interest, rent and transfer payments) and is the broadest available proxy for a state’s tax base. Moody’s, S&P, Fitch, Pew and the Volcker Alliance all express state long-term liabilities as a share of it. The 2025 figures used here are BEA’s annual SAINC1 estimates (April 9, 2026 release, confirmed September 2, 2026); BEA’s September 30, 2026 annual update will revise them. Personal income is not available for cities, which is why the metro page uses population alone. ↩
[4] States do not share a fiscal calendar. Forty-six end their fiscal year on June 30; New York ends March 31, Texas August 31, and Alabama and Michigan September 30. “Fiscal 2025” on this page therefore covers year-ends from March 31, 2025 (New York) to September 30, 2025 (Alabama, Michigan), and the four states carried at fiscal 2024 reach back to June 30, 2024. ↩
Companion workbook. demographics-state-fiscal-outlook.xlsx: Sources tab, Scorecard (formulas and tie-outs), Rating Scale, Ratings Detail (per-state ratings, outlooks, dates, actions, flags and source URLs), Rating Actions (68 actions, January 2023 to September 2026), ACFR FY2025 (per-state pension, OPEB, net position and General Fund figures with PDF page references), ACFR Source Lines (verbatim statement lines), Personal Income, State Population, Rainy Day (NASBO) and Open Items.
Sources
1. Annual Comprehensive Financial Reports, fiscal 2025 (fiscal 2024 for Arizona, Mississippi, Nevada, Oklahoma), for the 50 states, issued by each state’s comptroller, controller, department of finance or auditor (December 2025 to June 2026). Government-wide Statement of Net Position; Governmental Funds Balance Sheet; Statement of Revenues, Expenditures and Changes in Fund Balances; long-term obligations and pension notes. Per-state report URLs are in the companion workbook; the reports are on file in the CRE42 base-data folder and available from each state’s finance site or EMMA.
2. U.S. Bureau of Economic Analysis. State Personal Income, SAINC1, 2025 (April 9, 2026 release; per capita via FRED). bea.gov/data/income-saving/personal-income-by-state
3. U.S. Census Bureau. Vintage 2025 State Population Estimates and Components of Change (NST-EST2025-ALLDATA, December 2025). census.gov/popest/2020s-state-total
4. National Association of State Budget Officers. The Fiscal Survey of States: Spring 2026, Tables 1, 2 and D. nasbo.org/reports-data/fiscal-survey-of-states
5. State treasurer, comptroller and debt-office investor pages, official statements and press releases for each of the 50 states (per-state URLs in the scorecard table and the workbook’s Ratings Detail tab), with rating-action coverage from The Bond Buyer (2023–2026). Rating definitions: Moody’s; S&P Global; Fitch.
6. Pew Charitable Trusts. Strength of State Rainy Day Funds Declines as Budgets Tighten (March 24, 2026), Fiscal 50. pew.org
7. Municipal Securities Rulemaking Board. EMMA. emma.msrb.org
Methodology & Data Notes
Scope and What Is Deliberately Left Out
This page uses three headline measures: the audited pension and retiree health care liabilities scaled to personal income, the three agencies’ ratings, and the NASBO rainy-day fund balances. It follows the metro page’s structure, with two changes. The composite rating (average notches across agencies) was dropped: the state ratings are so compressed (46 of 50 within three notches of AAA) that an average adds little, and the weakest single rating is used instead. Personal income was added as a second denominator because it is what the agencies use and because it is available for states but not cities. Plan-level pension funded ratios were considered as a way around the teachers’-plan inconsistency described below and omitted: states run between one and a dozen plans with different measurement dates, discount rates and cost-sharing arrangements, and no single funded ratio per state can be built from primary sources on a comparable basis without a great deal of judgment. General Fund reserves (committed, assigned and unassigned balance as a share of expenditures) are carried in the workbook only; at the state level the General Fund is so differently defined (North Dakota’s balance is six times its spending because most state activity runs through other funds; Louisiana’s taxes bypass it entirely) that the measure is not a ranking. Revenue mix, capital-gains dependence, Medicaid exposure and muni bond spreads are real drivers of state fiscal health and are listed under What to Watch For; each would need its own primary-source pull.
What the ACFR Pension Figure Is and Is Not
Under GASB 68 a state reports its own proportionate share of each plan’s net pension liability as an employer, plus any share it carries as a “nonemployer contributing entity” for other governments’ employees, which in practice means the teachers’ plan. Whether the state carries the teachers’ share depends on state law, not on how well funded the plan is. Connecticut, Kentucky, Maryland, Texas, Illinois, Rhode Island, California, Alaska, Maine and Tennessee are among the states that carry all or part of it; Missouri, Michigan, Georgia, Ohio and Virginia carry none because school districts are the employers, and Kansas carries only the state’s own share of KPERS. The figure on this page is therefore the state government’s bill, which is the right number for a state’s own budget and credit, but it understates the pension problem in the states where the districts carry the teachers. The workbook notes each state’s treatment.
Balance-Sheet Measures
Liabilities: net pension liability plus net OPEB liability of the primary government (governmental plus business-type activities), as reported on the government-wide Statement of Net Position or, for the 19 states that aggregate them into long-term liabilities (Alabama, Connecticut, Florida, Idaho, Illinois, Indiana, Kansas, Kentucky, Maryland, Michigan, Missouri, North Carolina, Ohio, South Carolina, Tennessee, Utah, Virginia, Washington, Wisconsin), in the long-term obligations note. Where a statement splits the liability into current and noncurrent lines (Texas, Colorado, New Hampshire and others) the two are summed. Pay-as-you-go retiree health plans report a “total OPEB liability”, used as reported. Pension and OPEB assets are not netted; four states (Alaska, South Dakota, Utah, West Virginia) report a net OPEB asset and no OPEB liability and are shown at zero for that component, and South Dakota also reports a net pension asset. North Carolina’s pension figure includes $341 million of GASB 73 separation-allowance liability. Michigan’s note is printed in millions and is precise to $50,000. Unrestricted net position is the governmental-activities figure. All figures were converted to dollars from the printed unit (thousands, millions or dollars; Nevada prints the government-wide statement in thousands and the fund statements in dollars).
Extraction and Verification
The 50 ACFR PDFs were converted to text and the three statements located by heading; Arkansas’s report has no text layer and its statement pages were read by OCR at 300 dpi. Every General Fund figure was checked by footing (fund-balance components sum to the printed total; all 50 tie to zero) and the pension and OPEB figures against the MD&A condensed tables and the pension notes where available. The PDF page of each statement is recorded in the scorecard table and the workbook, and the verbatim lines are on the workbook’s ACFR Source Lines tab.
Ratings
Each agency’s long-term scale is mapped to notches below AAA (Aaa/AAA = 0, Aa1/AA+ = 1, Aa2/AA = 2, Aa3/AA− = 3, A1/A+ = 4, A2/A = 5, A3/A− = 6). The ranking uses the weakest rating among the agencies that rate the state. Outlooks are recorded and shown on the chart but not scored. The agencies’ own sites do not permit automated retrieval, so every rating was taken from a state document, a governor or treasurer release, or The Bond Buyer, with the source URL in the table; cells that could not be confirmed against a dated 2025–26 source are flagged rather than guessed.
Vintages and Known Gaps
Ratings are as of September 2, 2026. Balance-sheet figures are fiscal 2025 (fiscal years ending March 31 to September 30, 2025), except Arizona, Mississippi, Nevada and Oklahoma at fiscal 2024. Personal income is BEA’s April 2026 SAINC1 release and will be revised September 30, 2026. Rainy-day balances are NASBO’s Spring 2026 survey; Pew’s days-of-cover figures, computed from an earlier survey vintage, differ slightly and are carried in the workbook for reference. Open items are listed on the workbook’s Open Items tab.