
Interest rates are linked to cap rates because fixed-income government securities and real estate are both financial assets competing for investment dollars and generally move in tandem to some degree. The spread between real estate cap rates and “risk-free” Treasury yields is generally considered to be an inverse indicator of risk tolerance: lower spreads reflect higher risk appetite and optimism related to future revenue and value. This analysis compares 10-Year U.S. Treasury yields to NAREIT All Equity REIT implied cap rates from 2000 through the first half of 2026, including the spread between them, and examines the time lag between changes in interest rates and corresponding movement in real estate transaction pricing.
Interest Rates vs. Implied All REIT Cap Rates, 2000–2026
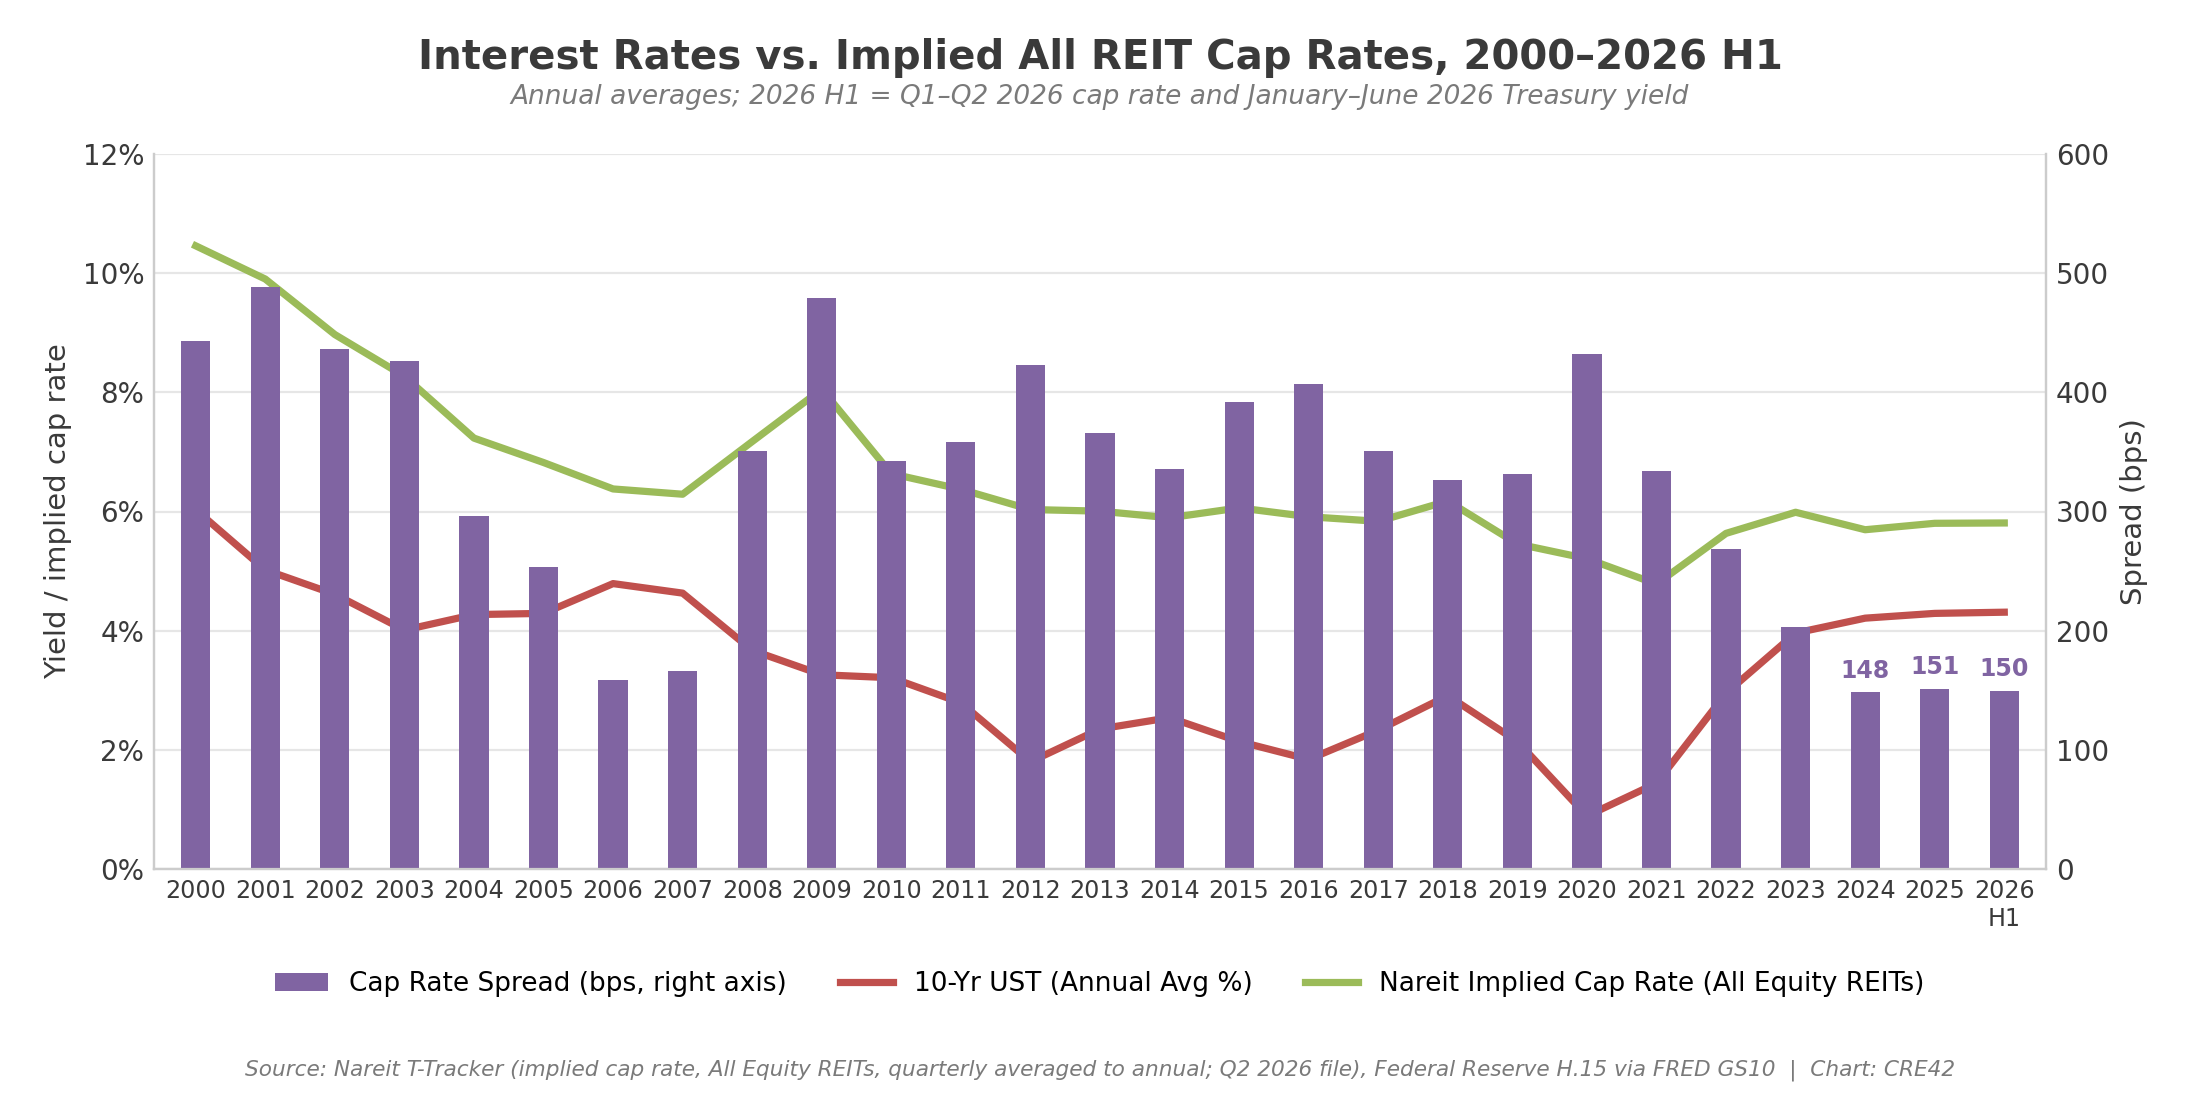
Nareit implied cap rates (All Equity REITs, quarterly data averaged to annual) vs. 10-Year U.S. Treasury annual average yield with cap rate spread in basis points, 2000–2026. 2026 H1 pairs the Q1–Q2 2026 cap rate with the January–June 2026 yield. Source: Nareit T-Tracker (Q2 2026), Federal Reserve H.15. Chart: CRE42
Key Observations
Context & Discussion
Lending interest rates are typically based on a spread over U.S. Treasuries of a corresponding maturity. For example, the interest rate for a five-year loan with a 1.5% spread over the 5-Year UST of 4.0% would equal 5.5%. Short-term interest rates are essentially determined by the Federal Reserve, while longer-dated bonds are increasingly influenced by market forces, although the Federal Reserve also conducts open market operations to influence the long end of the yield curve.
The relationship between cap rates and interest rates is also influenced by timing. U.S. Treasuries constitute the largest and most liquid market in the world and trade instantaneously with complete price transparency. Real estate transactions, on the other hand, are subject to significant delays related to loan covenants, tax considerations, and a host of other factors. The typical time period from decision to sell through closing can range up to a year or more and generally averages around six months. In addition to the time required to complete a transaction, there are often multiple partners involved in the decision-making process, each reacting to market forces and individual preferences.
Correlation: 10 Yr UST vs. All Equity REIT Cap Rates
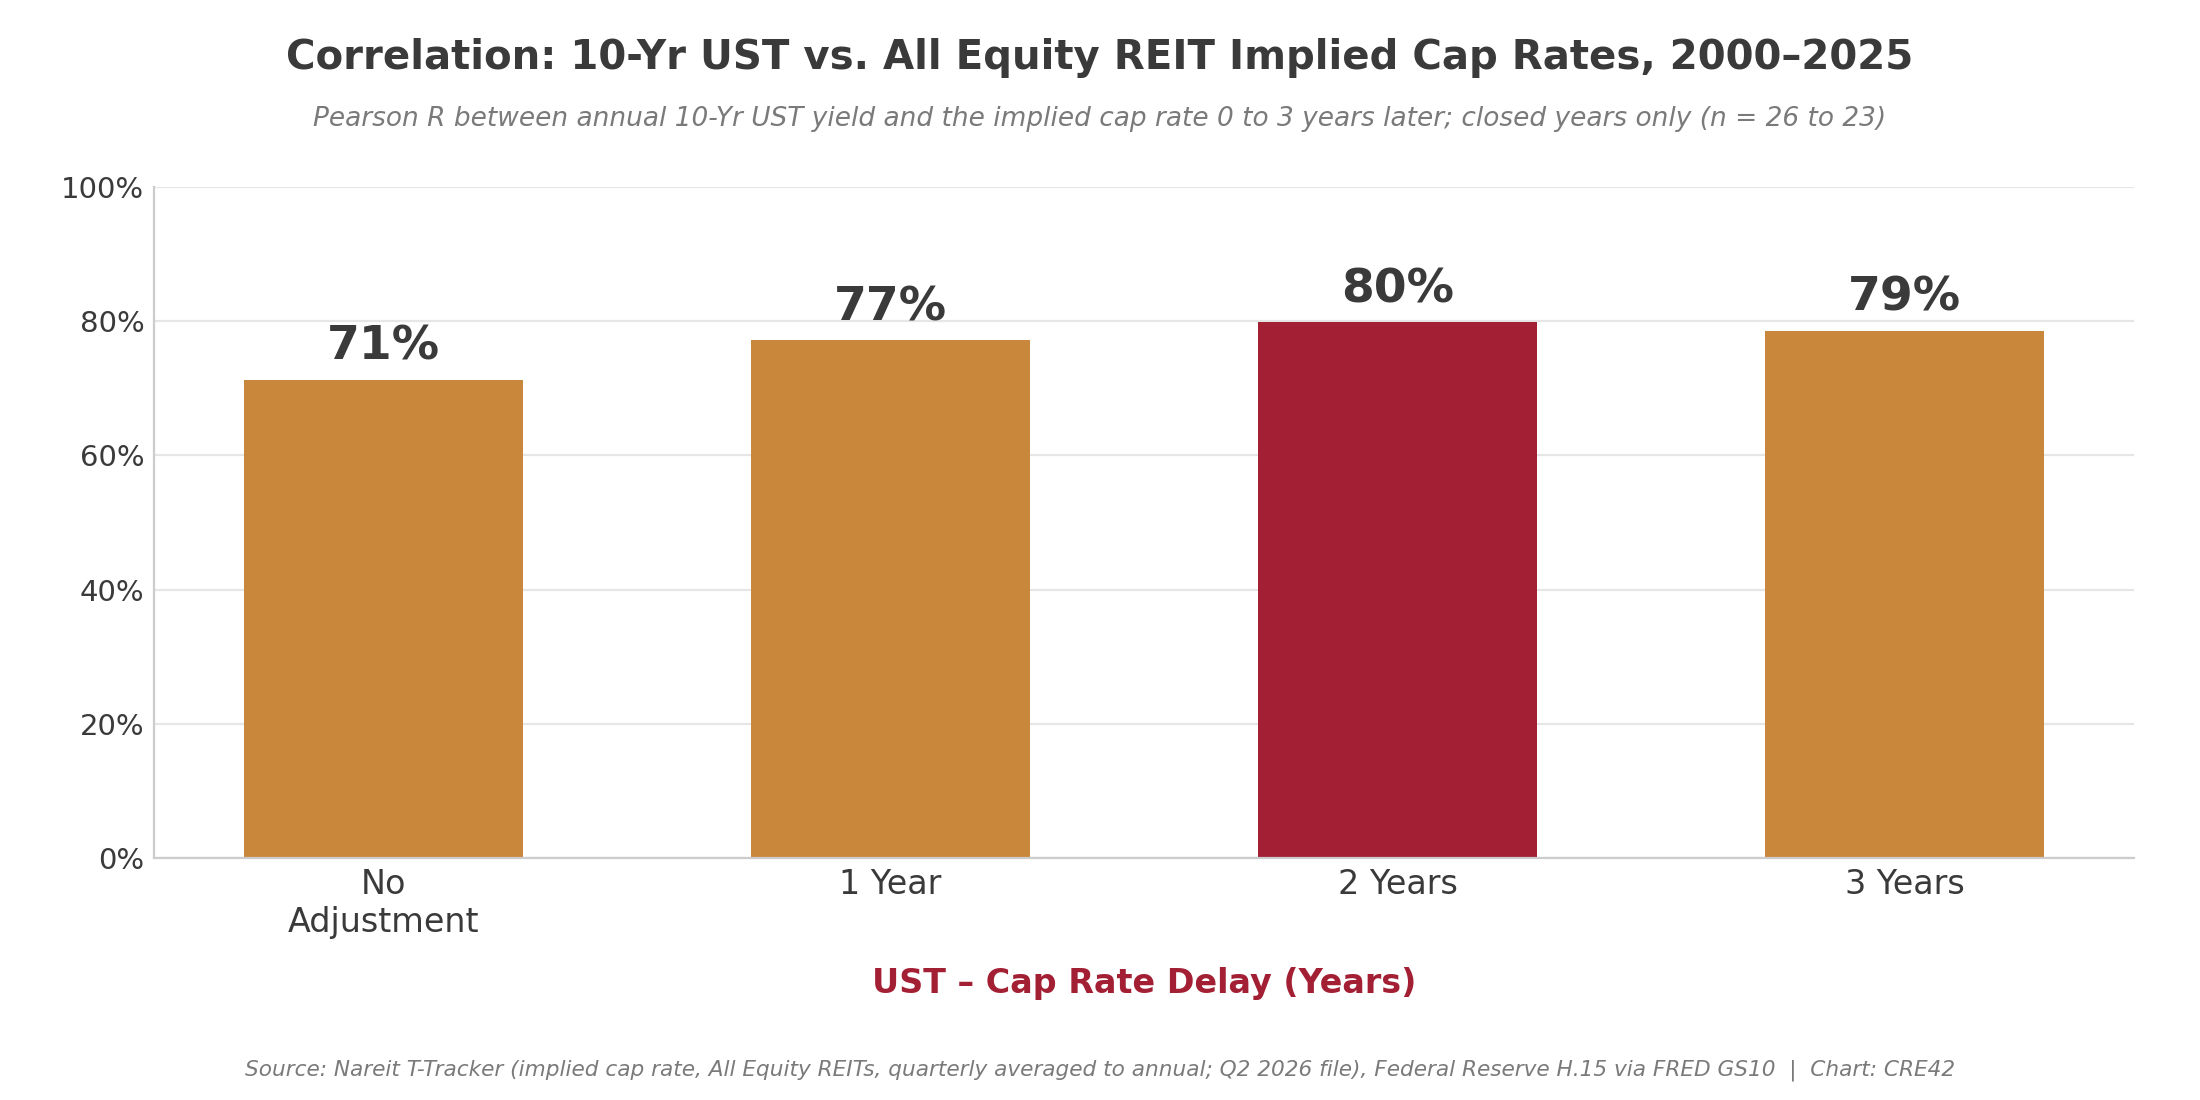
Correlation between 10-Year UST annual average yield and NAREIT All Equity REIT implied cap rates at varying time lags, 2000–2025 (closed years only). Source: Nareit T-Tracker (Q2 2026), Federal Reserve H.15. Chart: CRE42
As reflected in the correlation analysis above, comparing implied cap rates to 10-Year UST yields with a two-year delay produces a substantially higher correlation (80%) than the same-year comparison (71%). Inflation and interest rates are naturally related because investors require higher yields on fixed-rate securities to keep pace with rising prices during inflationary periods and settle for lower yields when inflation is low. However, the causal relationship between these variables is less straightforward than conventional wisdom might suggest. The Federal Reserve uses interest rates to control inflation primarily because it has limited tools at its disposal, as reflected by former Federal Reserve Chairman Ben Bernanke: “Monetary policy is a blunt tool, not a scalpel. It can’t fine-tune economic outcomes with precision.”
Beyond Interest Rates: The Role of Capital Liquidity
While interest rates are the most commonly cited driver of cap rate movements, research suggests that capital flows and liquidity conditions can be equally influential. In a widely cited analysis, Dr. Peter Linneman and co-authors found that capital flows “play a significant role in driving cap rates, given that availability of capital and increased competition for assets will significantly impact real estate asset values.” This helps explain why the current environment of elevated Treasury yields has coincided with cap rate spreads compressing to 25-year lows rather than widening as a simple interest rate model would predict. The answer lies in the volume of investable capital seeking returns. Open-end core fund redemptions have slowed, and both traditional and alternative lenders are actively competing for CRE loan originations. As PwC and the Urban Land Institute noted in their Emerging Trends in Real Estate 2026 report, “There’s an incredible appetite to put out debt. Once equity finds a transaction point, the debt is ready to go.” This wall of capital puts persistent downward pressure on cap rates regardless of where Treasury yields sit, at least until a credit event or recession triggers risk aversion and capital withdrawal (as occurred during the GFC, when spreads widened from 166 bps to 479 bps in just two years).
Sources
1. National Association of Real Estate Investment Trusts (NAREIT). T-Tracker Quarterly Report, “Implied Cap Rate” series for All Equity REITs, Q2 2026 edition (August 2026). Quarterly data averaged to annual, 2000–2026 H1; Nareit revises prior quarters with each release. Available at reit.com.
2. Federal Reserve Board of Governors. H.15 Statistical Release, “Market Yield on U.S. Treasury Securities at 10-Year Constant Maturity.” Monthly data averaged to annual; 2026 is January–June. FRED series GS10.
3. CBRE Investment Management. “The Case For and Against Narrow Cap Rate Spreads.” December 8, 2025. Reports U.S. cap rate spread of 172 bps as of Q3 2025, 24th percentile since 1965; average spread of 342 bps (1991–2019).
4. CBRE. “U.S. Cap Rate Survey H1 2026.” Survey conducted late June 2026. All-property average cap rate essentially flat; 10-Year yield peaked at 4.67% in mid-May 2026; respondents cite 3.75% as the yield that would revive sales volume.
5. CFA Institute Enterprising Investor / Linneman, Peter et al. “The Interplay Between Cap Rates and Interest Rates.” June 2024. Analysis of capital flows, credit availability, and lag effects on cap rate movements.
6. PwC and the Urban Land Institute. Emerging Trends in Real Estate 2026. Washington, D.C., 2025. Capital markets liquidity assessment and investor sentiment survey.
7. U.S. Bureau of Labor Statistics. Consumer Price Index for All Urban Consumers (CPI-U), U.S. City Average, All Items, not seasonally adjusted (1982–84=100), annual averages. FRED series CPIAUCNS.
8. Board of Governors of the Federal Reserve System. M2 Money Stock, Seasonally Adjusted, December values. FRED series M2SL.
9. CRE42.com Capital Strategy Model. Correlation analysis and spread calculations.
Methodology & Data Notes
Companion Workbook
inflation-cap-rates-vs-ust.xlsx: 10-Yr UST, Nareit implied cap rates, CPI, M2 money supply, and correlation analysis (2000–2026 H1).
NAREIT Implied Cap Rates
NAREIT’s implied cap rate is calculated as annualized Net Operating Income (NOI) divided by total enterprise market value (equity market capitalization plus total debt outstanding) for all publicly traded U.S. equity REITs. This is a market-based measure that reflects real-time investor pricing of real estate assets through public REIT securities. Because it is derived from public market valuations rather than private transaction data, it captures changes in investor sentiment more quickly than appraisal-based measures but can also reflect stock market volatility unrelated to underlying property fundamentals. Quarterly data from the Nareit T-Tracker was averaged to annual figures for this analysis. Nareit revises prior quarters with each release; every figure on this page is from the Q2 2026 edition.
Cap Rate Spread Calculation
The cap rate spread is calculated as the NAREIT All Equity REIT implied cap rate minus the 10-Year U.S. Treasury annual average yield, expressed in basis points (100 bps = 1.00%). This spread represents the incremental yield investors accept for holding illiquid real estate assets over risk-free government securities.
Correlation & Lag Analysis
Correlation coefficients (Pearson R) are calculated between annual 10-Year UST yields and NAREIT implied cap rates at varying time lags (0, 1, 2, and 3 years). The lagged analysis compares current-year cap rates to prior-year Treasury yields to measure how quickly real estate pricing adjusts to changes in interest rates. Correlations use the 26 closed years 2000–2025; the 2026 H1 observation is charted but excluded. The peak correlation at a two-year lag (R = 0.80) is consistent with Morgan Stanley research cited by the CFA Institute, which found similar lag effects using transaction-based cap rate data.
2026 Partial-Year Data
The 2026 H1 implied cap rate is the average of Q1 and Q2 2026, and the 2026 H1 10-Year UST figure is the January–June 2026 average, so the two sides of the spread cover the same six months. The 2025 CPI annual average is the mean of eleven months because the Bureau of Labor Statistics did not publish an October 2025 index (federal appropriations lapse). Page refreshed September 2026 to the Nareit Q2 2026 vintage.