Overview
Following a pandemic-era spike that reached 9.1% in June 2022, U.S. inflation dropped rapidly starting in Q3 2022, prompting real estate investment optimists to project future cap rate compression and increased valuations. However, disinflation stalled in mid-2023, with CPI hovering in the 2.5%–3.5% range through year-end 2025, tempering hopes for a prompt return to ultra-low interest rates and cap rates. As of December 2025, inflation stands at 2.7%–above the Federal Reserve's 2% target but well below the 2022 peak.
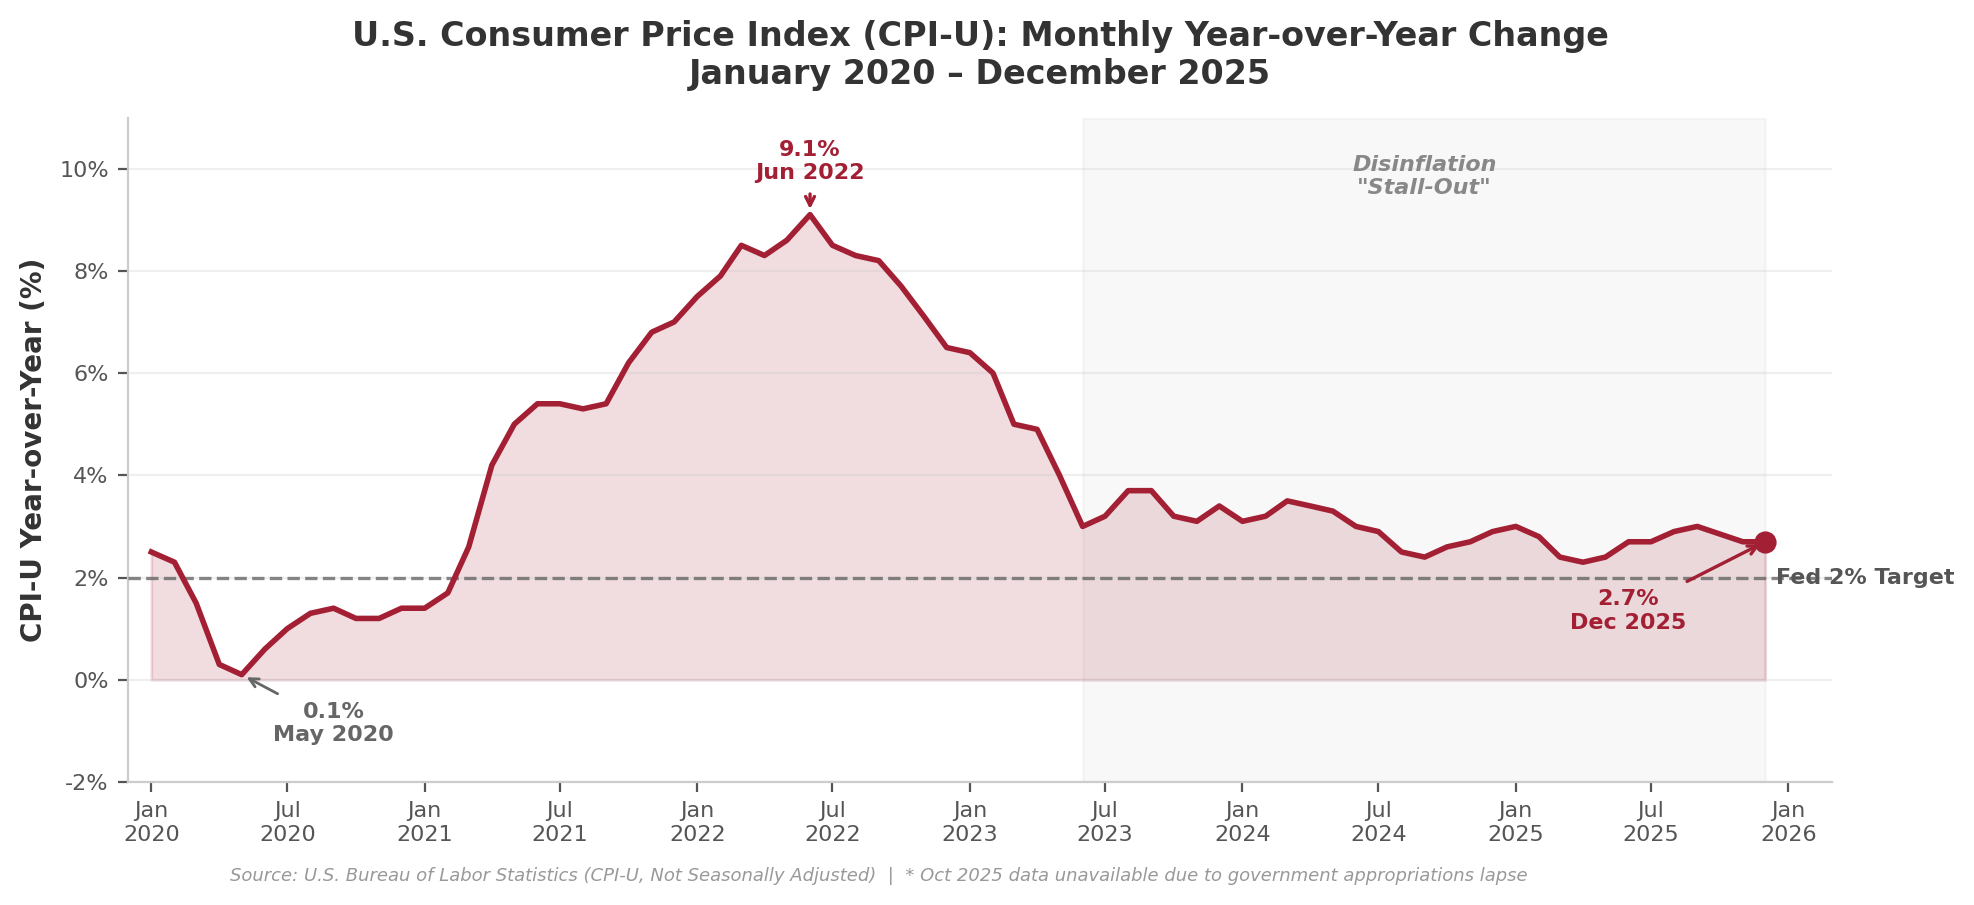
U.S. Consumer Price Index (CPI-U): Monthly Year-over-Year Change (January 2020 – December 2025)
Key Points
Document Links
inflation-current.xlsx — Monthly CPI-U index and YoY change (Jan 2020–Dec 2025), embedded chart, methodology
Detailed Context & Analysis
The Pandemic Inflation Spike (2020–2022)
The COVID-19 pandemic triggered unprecedented fiscal and monetary stimulus, with M2 money supply expanding 40% between 2020–2021. Combined with supply chain disruptions, semiconductor shortages, and rapid demand recovery, inflation accelerated from 1.4% (January 2021) to a 9.1% peak in June 2022–the highest rate since 1981.
The Cooling Phase (Q3 2022 – Q2 2023)
Federal Reserve rate hikes from near-zero to 5.25–5.50% rapidly reduced inflation to 3.0% by mid-2023. Supply chains normalized, energy prices retreated from peaks, and goods deflation emerged in categories like used cars and consumer electronics. This swift cooling fueled optimism in commercial real estate markets that cap rates would compress and valuations recover.
The Stall-Out (Mid-2023 through 2025)
Inflation stabilized in the 2.5%–3.5% range through year-end 2025, refusing to return to the Fed's 2% target. Persistent factors include:
- Shelter Inflation: Housing costs (30%+ of CPI) reflect 12–18 month lags; rents peaked in 2022 but only now moderating in CPI data
- Services Inflation: Wage growth in labor-intensive sectors (healthcare, hospitality) keeps service prices elevated
- Goods Reflation: Tariffs and geopolitical tensions reversed earlier goods deflation
- Labor Market Tightness: Near-full employment through 2025 sustained wage pressure despite gradual cooling
CRE Investment Implications
The inflation stall-out through 2025 delayed the anticipated cap rate compression cycle. Interest rates remained elevated longer than expected, keeping acquisition activity subdued and preventing the valuation recovery many investors projected in early 2023. Development economics remain challenging as construction costs–which surged 44% for industrial (2019–2024) vs. 21% CPI–have not retreated despite inflation cooling. The Fed's cautious approach in 2025 (three modest rate cuts followed by a pause) reflects concerns that inflation remains sticky above the 2% target.
Sources
U.S. Bureau of Labor Statistics – Consumer Price Index (CPI-U)
bls.gov/cpi
Federal Reserve Bank of St. Louis (FRED) – Inflation Data
fred.stlouisfed.org
Federal Reserve – FOMC Statements & Economic Projections
federalreserve.gov