
Following a pandemic-era spike that reached 9.1% in June 2022, U.S. inflation dropped rapidly starting in Q3 2022, prompting real estate investment optimists to project future cap rate compression and increased valuations. Disinflation then stopped short of the target: from Q3 2023 through Q1 2026, CPI settled into a roughly 2.5%–3.5% band, an above-target equilibrium that tempered hopes for a prompt return to ultra-low interest rates and cap rates.[5] In March 2026 the band broke to the upside. An energy price surge following the outbreak of conflict in the Middle East in late February, layered on earlier tariff increases, pushed headline CPI to 4.2% in May 2026, the highest reading since early 2023.[1] Inflation has since eased to 3.4% as of July 2026, still well above the Federal Reserve's 2% target.[2]
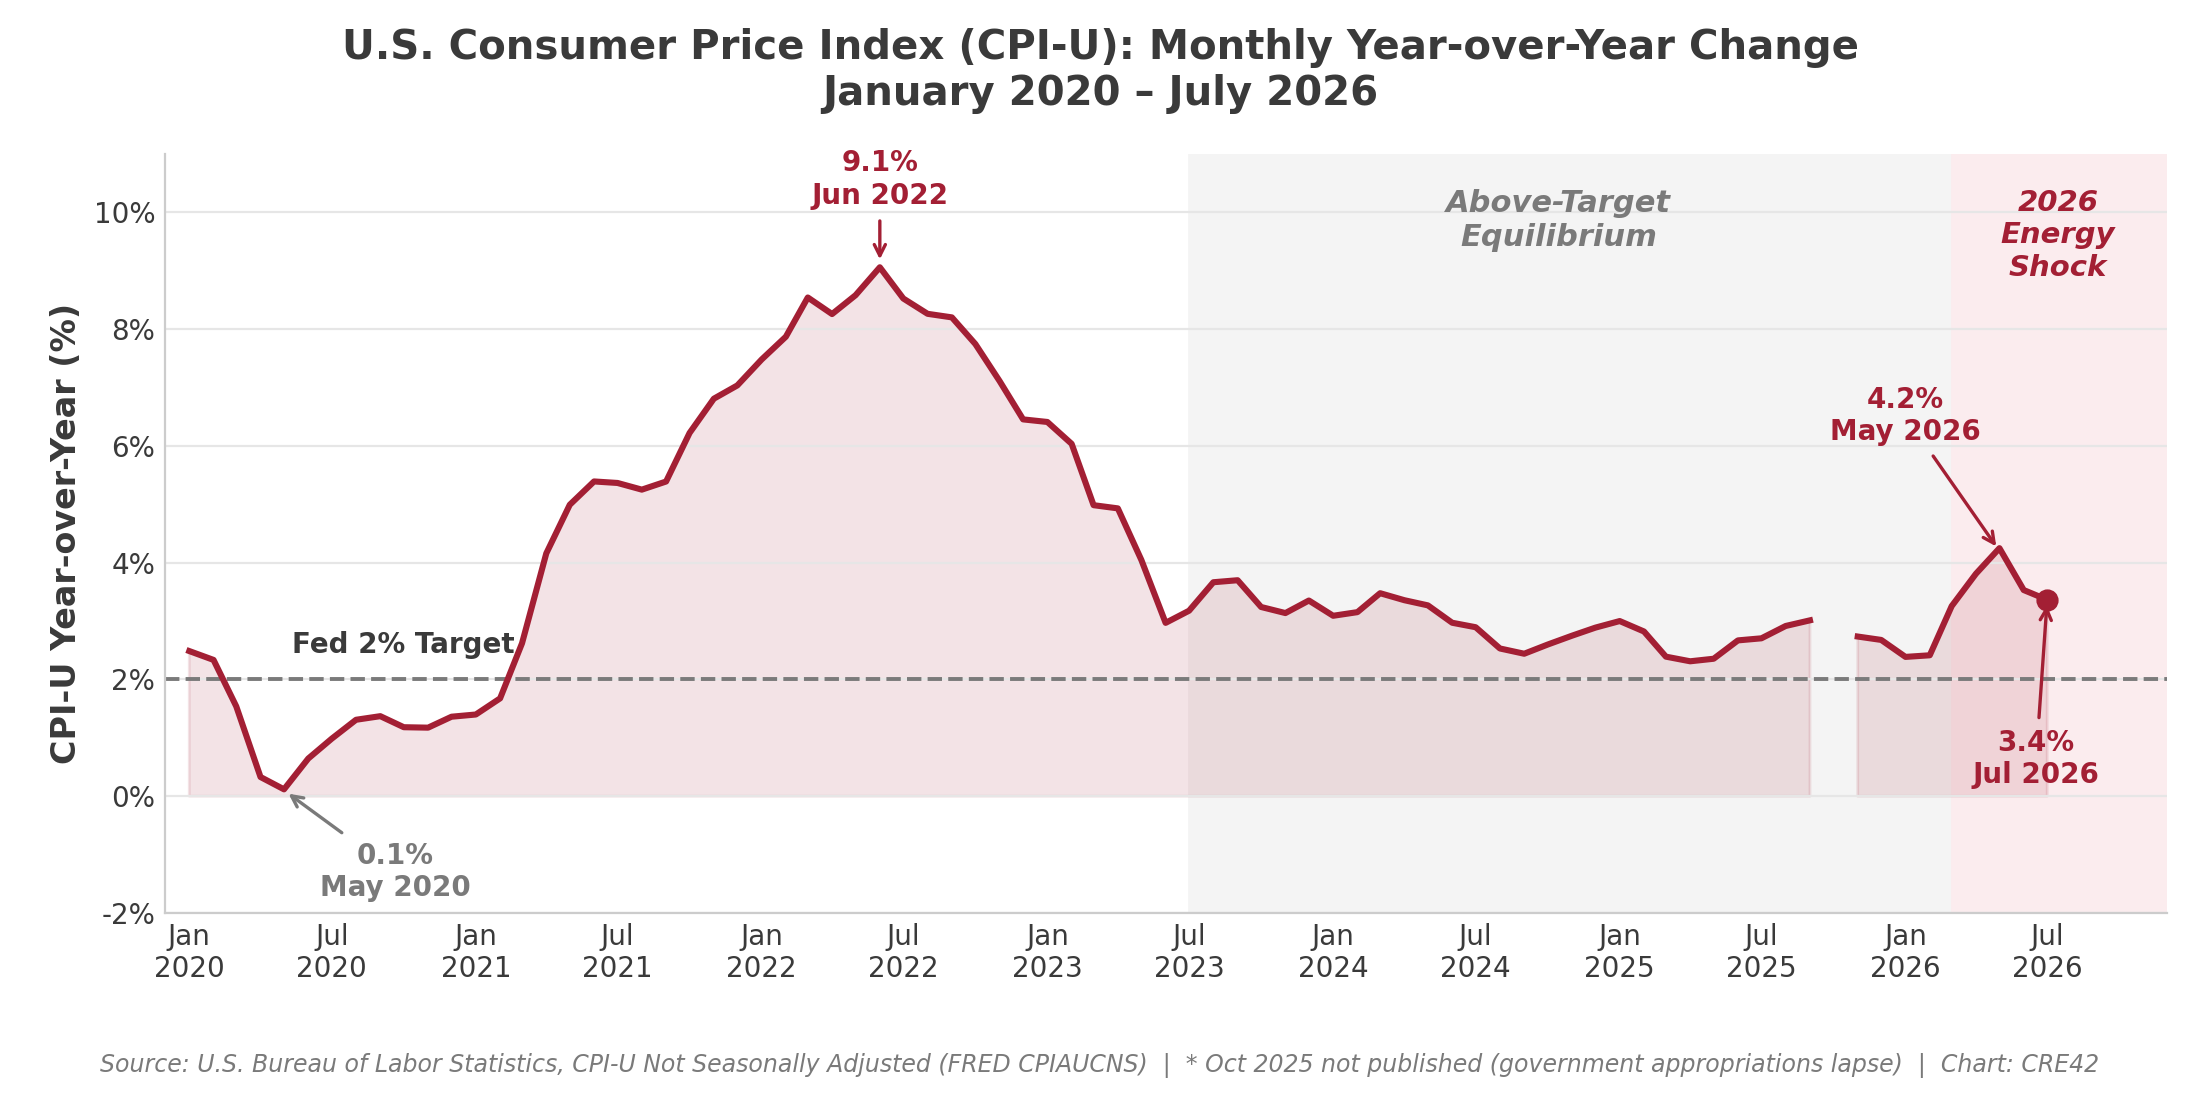
U.S. Consumer Price Index (CPI-U): Monthly Year-over-Year Change (January 2020 – July 2026) | Chart: CRE42
Key Observations
Detailed Context & Analysis
The Pandemic Inflation Spike (2020–2022)
The COVID-19 pandemic triggered fiscal and monetary stimulus on a scale not seen since World War II, with M2 money supply expanding 40% between 2020–2021. Combined with supply chain disruptions, semiconductor shortages, and rapid demand recovery, inflation accelerated from 1.4% (January 2021) to a 9.1% peak in June 2022, the highest rate since 1981.
The Cooling Phase (Q3 2022 – Q2 2023)
Federal Reserve rate hikes from near-zero to 5.25–5.50% rapidly reduced inflation to 3.0% by mid-2023. Supply chains normalized, energy prices retreated from peaks, and goods deflation emerged in categories like used cars and consumer electronics. This swift cooling fueled optimism in commercial real estate markets that cap rates would compress and valuations recover.
Above-Target Equilibrium (Q3 2023 – Q1 2026)
Inflation stabilized in a roughly 2.5%–3.5% range for nearly three years, refusing to return to the Fed's 2% target.[5] It closed 2025 at 2.7% and opened 2026 at 2.4%. Persistent factors included:
- Shelter Inflation: Housing costs (roughly a third of CPI) reflect 12–18 month lags; shelter CPI peaked at 8.2% in March 2023 and took until 2025 to fall below 4%[3]
- Services Inflation: Wage growth in labor-intensive sectors (healthcare, hospitality) kept service prices elevated
- Goods Reflation: Tariffs and geopolitical tensions reversed earlier goods deflation
- Labor Market Tightness: Near-full employment through 2025 sustained wage pressure despite gradual cooling
The 2026 Energy Shock (March 2026 – Present)
Headline CPI rose from 2.4% in February 2026 to 3.3% in March, 3.8% in April and 4.2% in May, before easing to 3.5% in June and 3.4% in July.[1] The Federal Reserve's July 2026 Monetary Policy Report attributes the rise to three forces: a surge in energy prices associated with constraints on oil supplies following the start of the Middle East conflict in late February; earlier tariff increases that pushed up domestic prices of some imported goods; and increased demand for high-tech products supporting artificial intelligence applications. Total PCE inflation[6] was 4.1% and core PCE 3.4% for the twelve months to May 2026, both notably above their year-earlier readings, while unemployment stood at 4.2% in June.[4] Longer-term inflation expectations, by the Fed's own reading, remain broadly consistent with the 2% objective, which is why the Committee has treated the episode as a supply shock to look through rather than a reason to tighten. The three July dissents show that patience is not unanimous.[2]
CRE Investment Implications
The above-target equilibrium of 2023–2025 delayed the anticipated cap rate compression cycle, and the 2026 energy shock has pushed it out further. Interest rates have remained elevated longer than expected, keeping acquisition activity subdued and preventing the valuation recovery many investors projected in early 2023. The Fed's easing cycle, which delivered three cuts in late 2025, has been on hold for the whole of 2026 to date, and with a bloc of the Committee arguing for a hike, the near-term risk to the policy rate is now two-sided. Development economics remain challenging as construction costs, which surged 44% for industrial (2019–2024) vs. 21% CPI, have not retreated, and higher energy and materials costs in 2026 add to the burden. For income property, the relevant question is whether rent growth can keep pace with a higher and more volatile inflation rate: shelter CPI at 3.2% suggests the residential sector is not, at least so far, the channel through which this episode is being transmitted.
What to Watch For in 2026 and Beyond
Sources to Track U.S. Inflation in 2026:
| Source | Report or Series | Frequency | Notes |
|---|---|---|---|
| U.S. Bureau of Labor Statistics | Consumer Price Index news release | Monthly, about the second week for the prior month | Headline, core, shelter and energy components; the August 2026 release lands about September 10–11 |
| FRED (St. Louis Fed) | CPIAUCNS (all items, NSA) and CUUR0000SAH1 (shelter, NSA) | Monthly, same day as the BLS release | The series behind this page's chart and workbook |
| Federal Reserve Board | FOMC statements and Summary of Economic Projections | Eight meetings per year; next September 15–16, October 27–28, December 8–9, 2026 | Target range currently 3.50–3.75%; watch the dissent count and the September projections |
| Federal Reserve Board | Monetary Policy Report | Semiannual (February, July) | The Fed's own attribution of what is driving inflation |
Notes
[1] BLS CPI-U, All Items, U.S. City Average, Not Seasonally Adjusted (FRED series CPIAUCNS), 12-month percent change. Latest observation July 2026, released August 12, 2026. BLS did not publish October 2025 CPI because of the government appropriations lapse, so no year-over-year figure exists for October 2025. ↩
[2] Federal Reserve Board, FOMC statement, July 29, 2026: target range maintained at 3-1/2 to 3-3/4 percent; three members dissented, preferring to raise the range by 1/4 percentage point. The range has been unchanged at every 2026 meeting. ↩
[3] BLS CPI-U, Shelter, U.S. City Average, Not Seasonally Adjusted (FRED series CUUR0000SAH1), 12-month percent change: 8.2% March 2023, 3.2% July 2026. ↩
[4] Federal Reserve Board, Monetary Policy Report, July 2026, summary. PCE and core PCE are 12-month changes to May 2026; unemployment rate is for June 2026. ↩
[5] Phase dates are approximate. Headline CPI fell to 3.0% in June 2023 and the 2.5%–3.5% band held from July 2023 (the first month inside it) through February 2026 (2.4%, the last reading before the shock). The Middle East conflict began in late February 2026; March 2026 was the first CPI month to register the energy effect, so the equilibrium is dated Q3 2023 through Q1 2026 and the energy shock from Q2 2026. Source: FRED series CPIAUCNS. ↩
[6] The Personal Consumption Expenditures (PCE) price index, published monthly by the Bureau of Economic Analysis, measures prices paid for goods and services consumed by households. It differs from CPI in three ways: a broader basket that includes spending made on households' behalf (employer-paid health insurance, for example), weights that update as spending patterns shift, and a lower shelter weight. PCE typically runs a few tenths of a point below CPI. It matters because the Federal Reserve defines its 2% inflation objective in terms of PCE, not CPI, and frames its projections and policy statements in PCE terms (Federal Reserve, Statement on Longer-Run Goals and Monetary Policy Strategy). ↩
Sources
U.S. Bureau of Labor Statistics – Consumer Price Index (CPI-U)
bls.gov/cpi
Federal Reserve Bank of St. Louis (FRED) – CPIAUCNS (all items) and CUUR0000SAH1 (shelter), not seasonally adjusted
fred.stlouisfed.org/data/CPIAUCNS
Federal Reserve – FOMC Statements, Summary of Economic Projections and Monetary Policy Report
FOMC statement, July 29, 2026 • Monetary Policy Report, July 2026
CRE42 companion workbook
inflation-current.xlsx: monthly CPI-U and shelter CPI index levels and YoY change (Jan 2019–Jul 2026), embedded chart, methodology. Refreshed September 2026.