
Multifamily Case Study: Austin (The Domain) vs. Boston (Kendall Square)
Case Study Exercise, Multifamily, H2 Fall 2026
MIT CRE 11.S967 Commercial Real Estate Investment Strategy
Two 150-Unit Class A New Construction Apartment Buildings
Assignment
Analyze and compare two new-construction 150-unit Class A apartment buildings, one in The Domain (Austin, TX) and one in East Cambridge / Kendall Square (Cambridge, MA), each offered at its guidance price. You are a core-plus investor purchasing 1/1/2027 with 100% equity and a five-year hold, selling 12/31/2031 at your exit cap rate applied to Year-6 NOI.
Assume the two buildings are physically identical: four stories, 150 units (120,000 rentable SF, 800 SF average unit), with garage parking on the first two levels. Each carries the standard Class A amenity package for new construction in its area: elevator service, in-unit laundry, central air conditioning, a pool, an amenity center and work-from-home space.
Variables you control
- Starting market rent, from the comp set
- Market rent growth for Years 2 to 4 and thereafter
- Concessions (months of free rent) by year
- Exit cap rate
Use the interactive model at the bottom of this page to calculate the returns for the two properties based on your chosen variables. Use the results to inform your selection. Subjective risk and upside potential outside the investment projections can also be factored in.
Part I: How the U.S. Became Housing-Constrained
Multifamily rental units comprise roughly a quarter of U.S. housing inventory, with single-family homes making up about 70%. Demand for apartments is inseparable from the broader housing market.
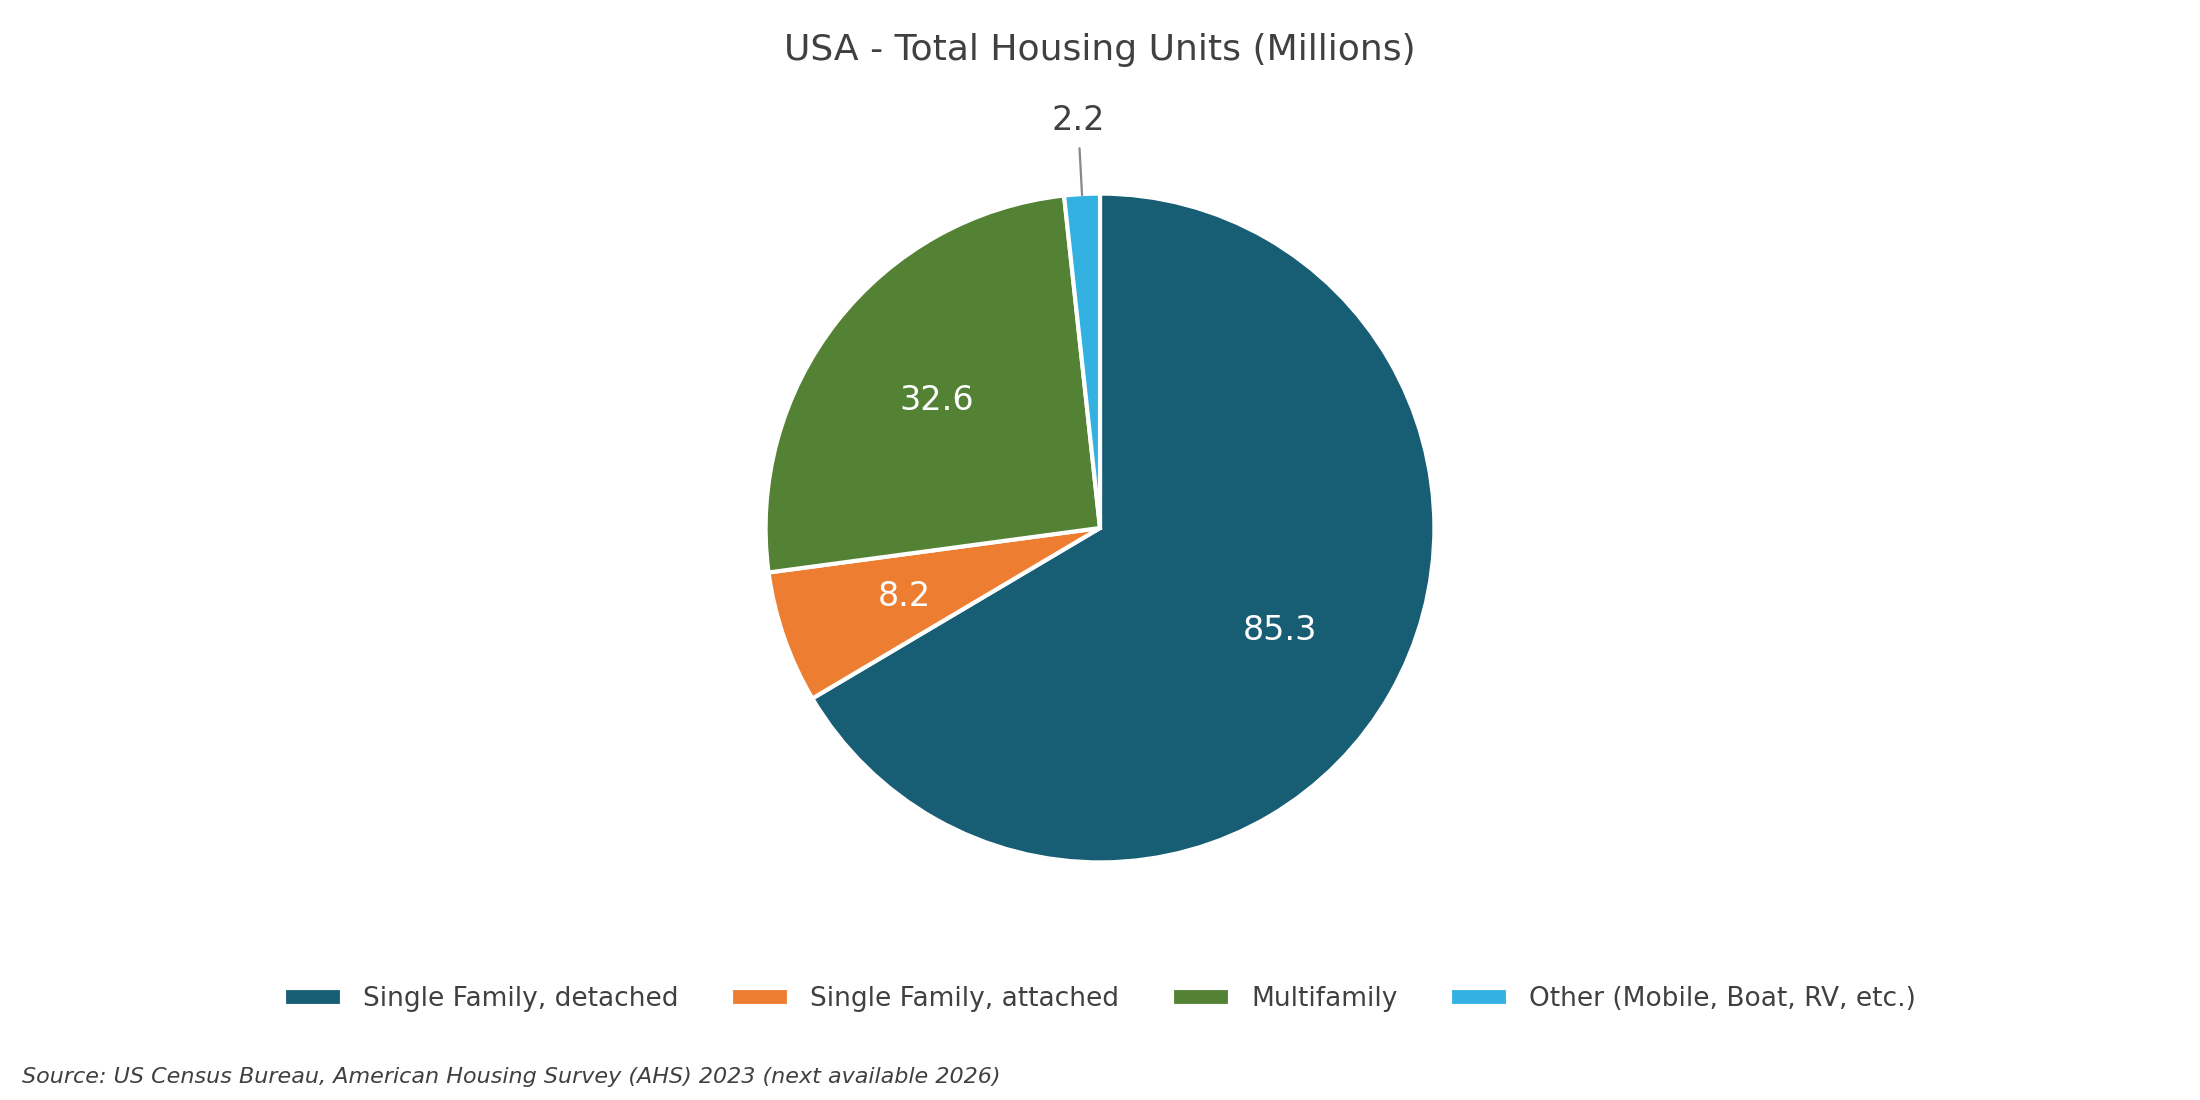
U.S. Housing Units by Structure Type | Source: U.S. Census Bureau, American Housing Survey 2023 | Chart: CRE42
The Great Financial Crisis (GFC) Inflection Point
Before the Great Financial Crisis the U.S. produced roughly 1.8 million housing units a year. From 2009 (roughly the beginning of the post-GFC recovery) through 2016 net additions to the housing stock ran far below that pace while population kept growing. Housing started to experience a deficit around 2010/2011 as reflected below. Net additions recovered to about 1.5 million units in 2025, roughly matching new demand but failing to close the accumulated housing deficit.
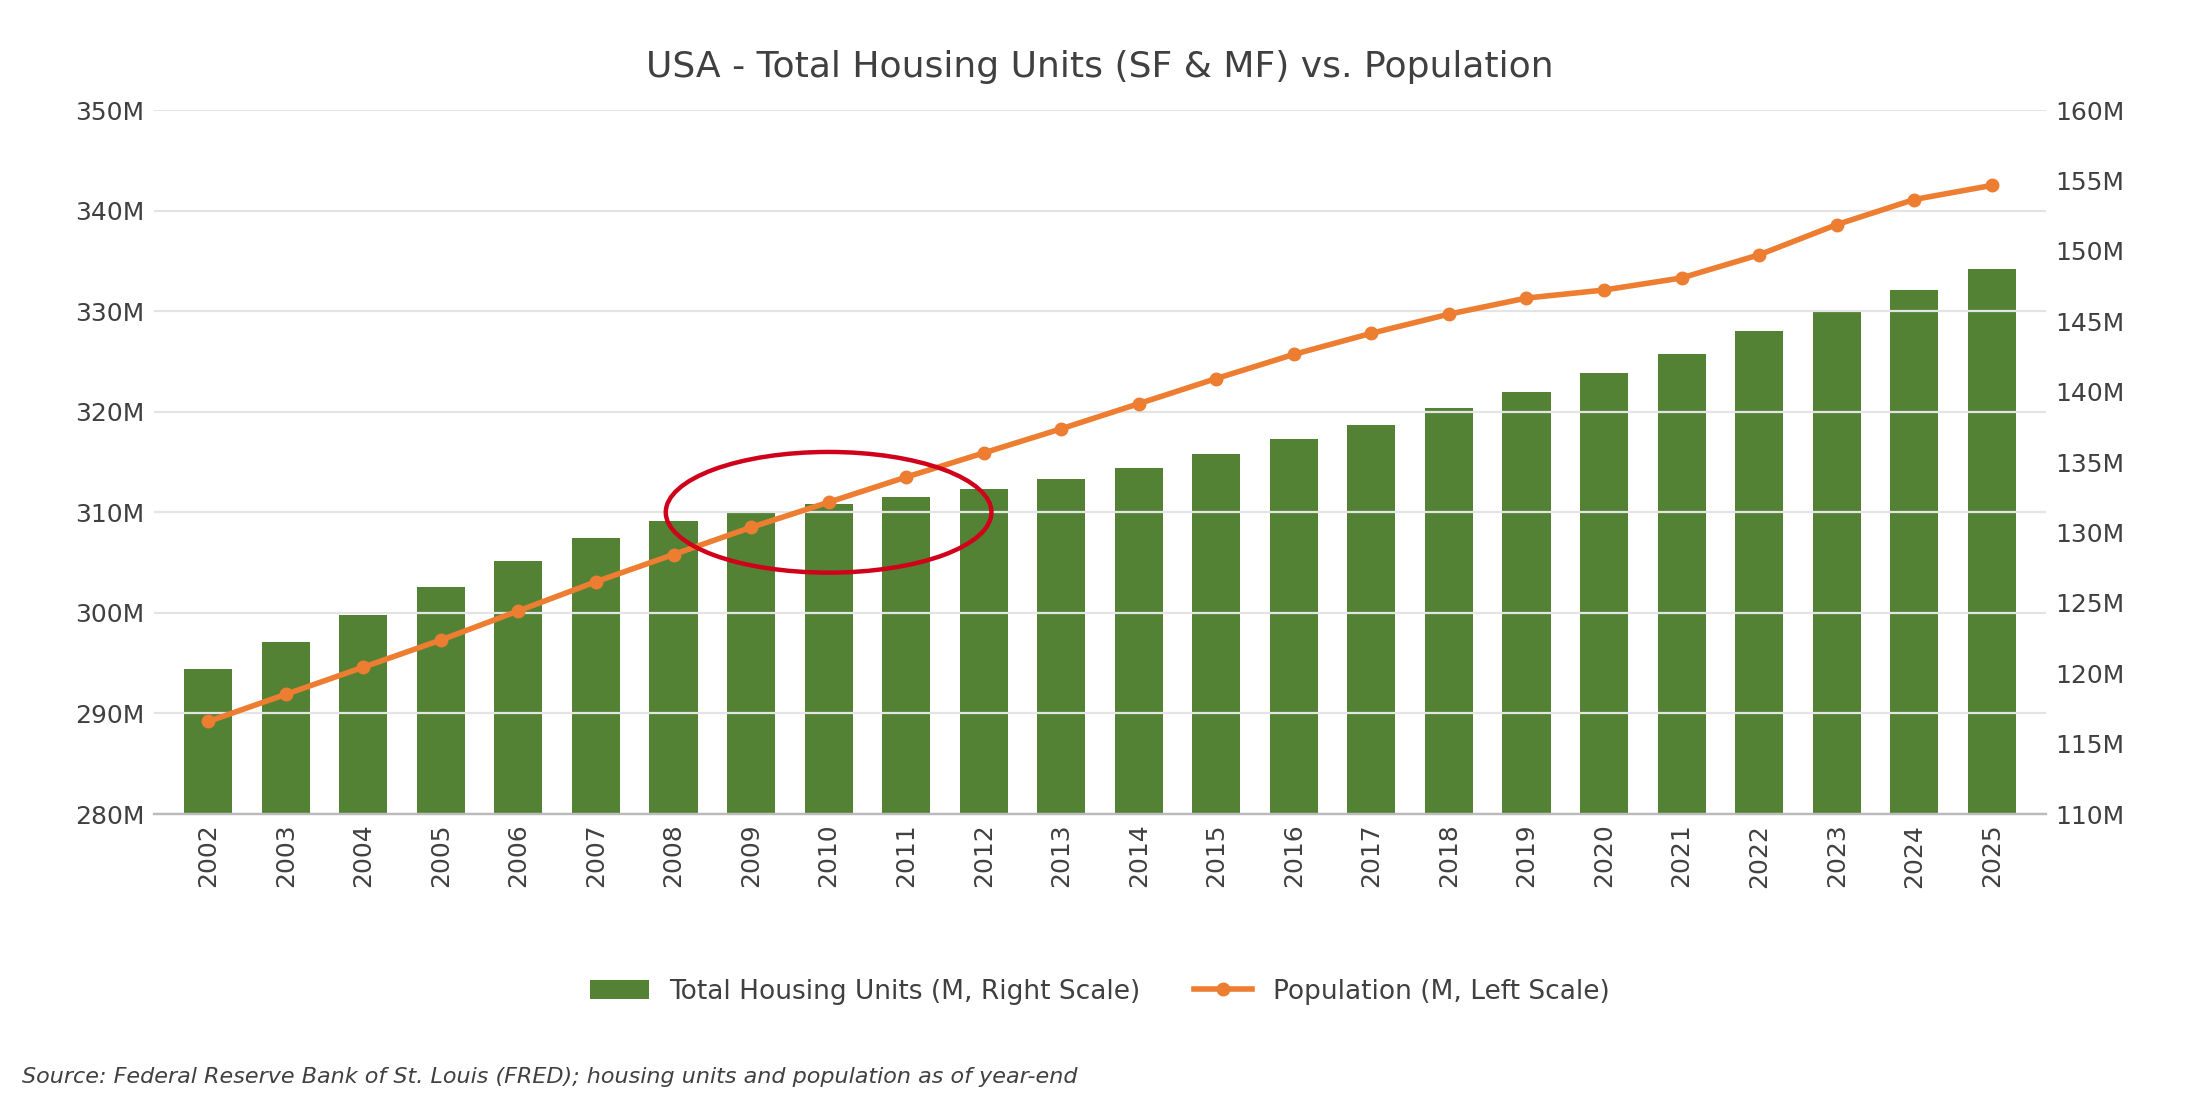
Total U.S. Housing Units vs. Population, 2002 to 2025 | Source: Federal Reserve Bank of St. Louis (FRED), ETOTALUSQ176N and POPTHM | Chart: CRE42
The ratio of added people to added housing units hovered around 1.5–2.0 before the GFC, then spiked to 5.0 new residents per added housing unit by 2010–11 (one new home for every five new people).
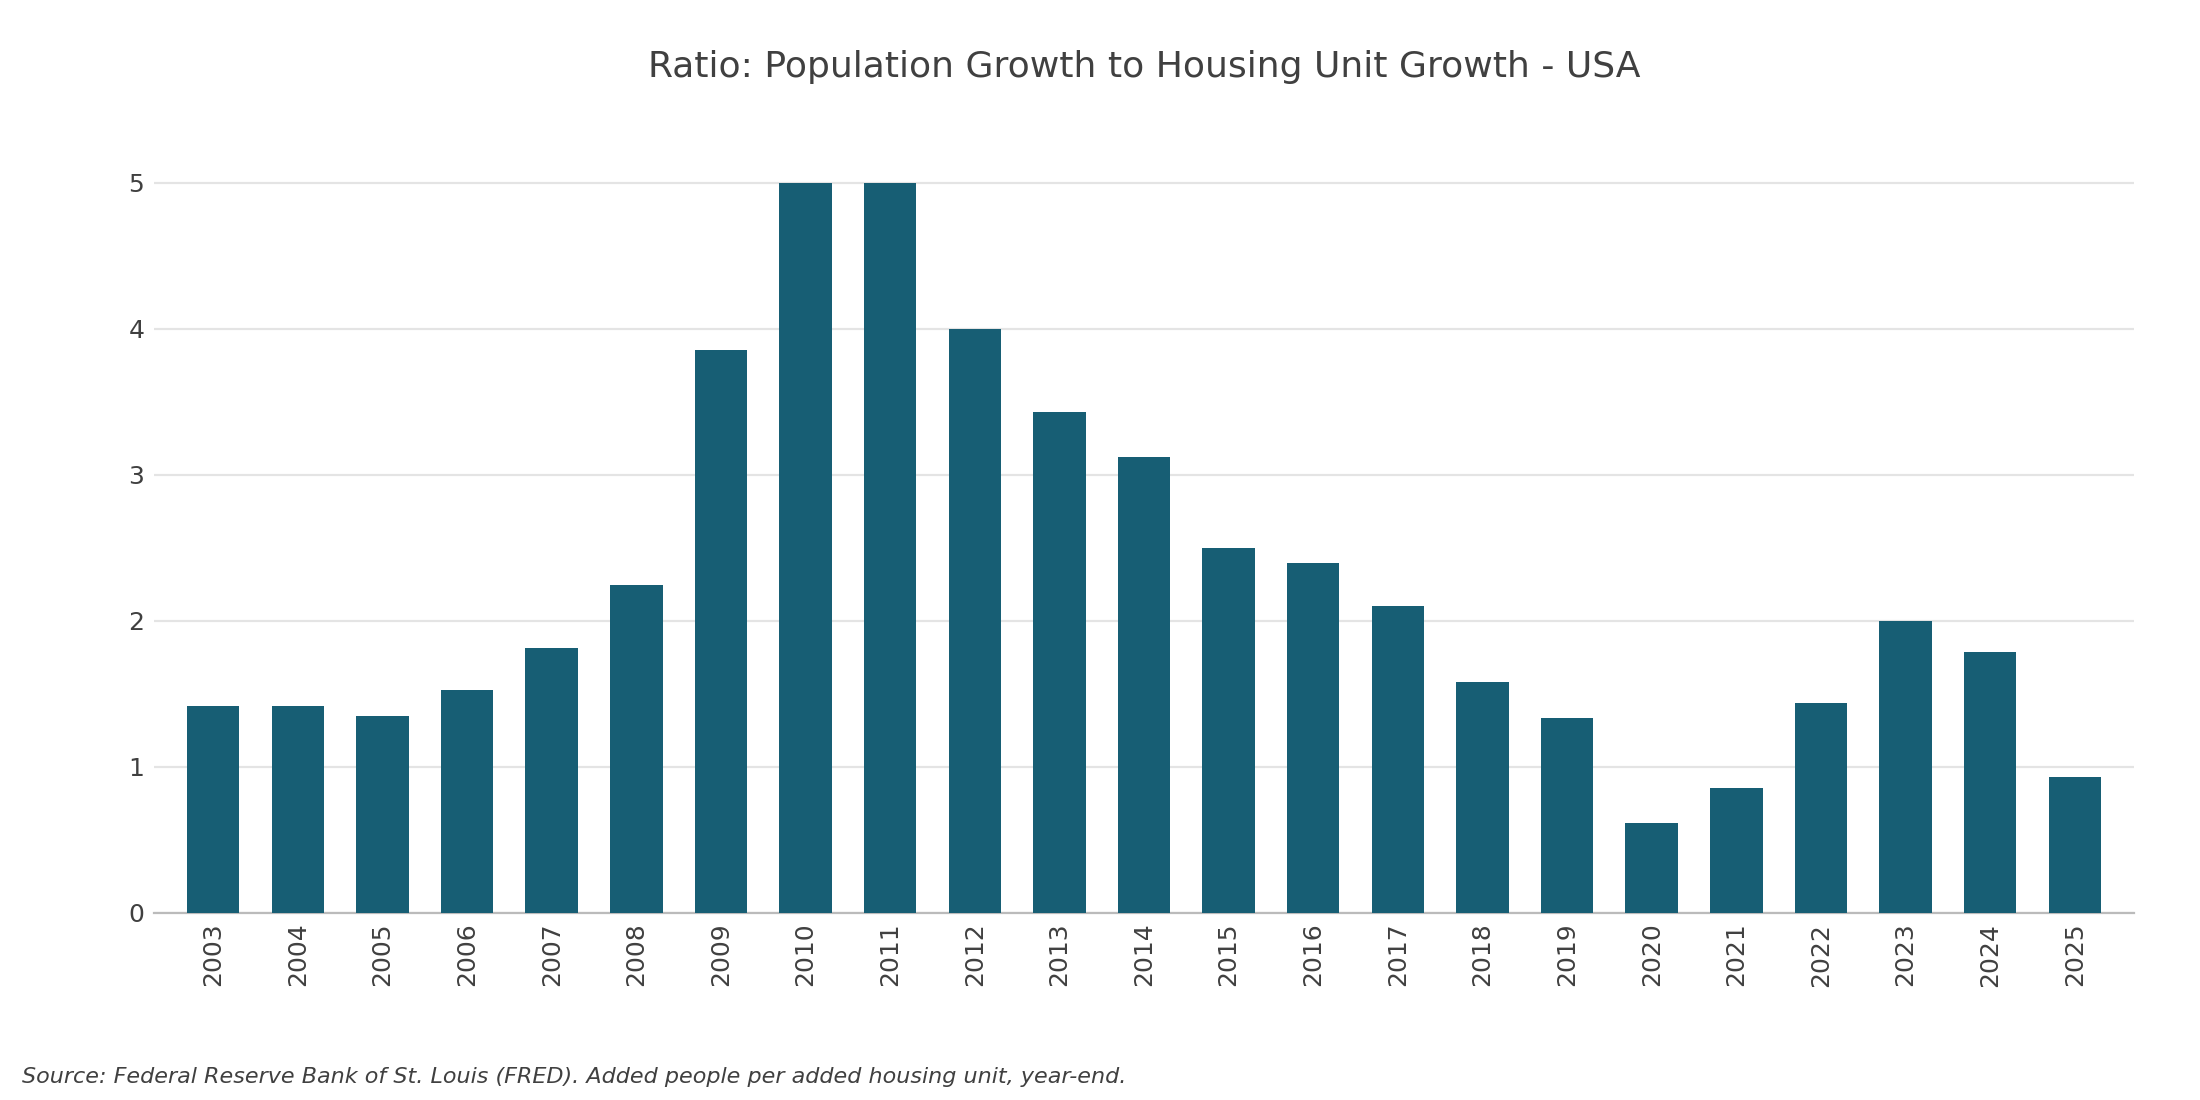
Added People per Added Housing Unit, 2003 to 2025 | Source: FRED, ETOTALUSQ176N and POPTHM | Chart: CRE42
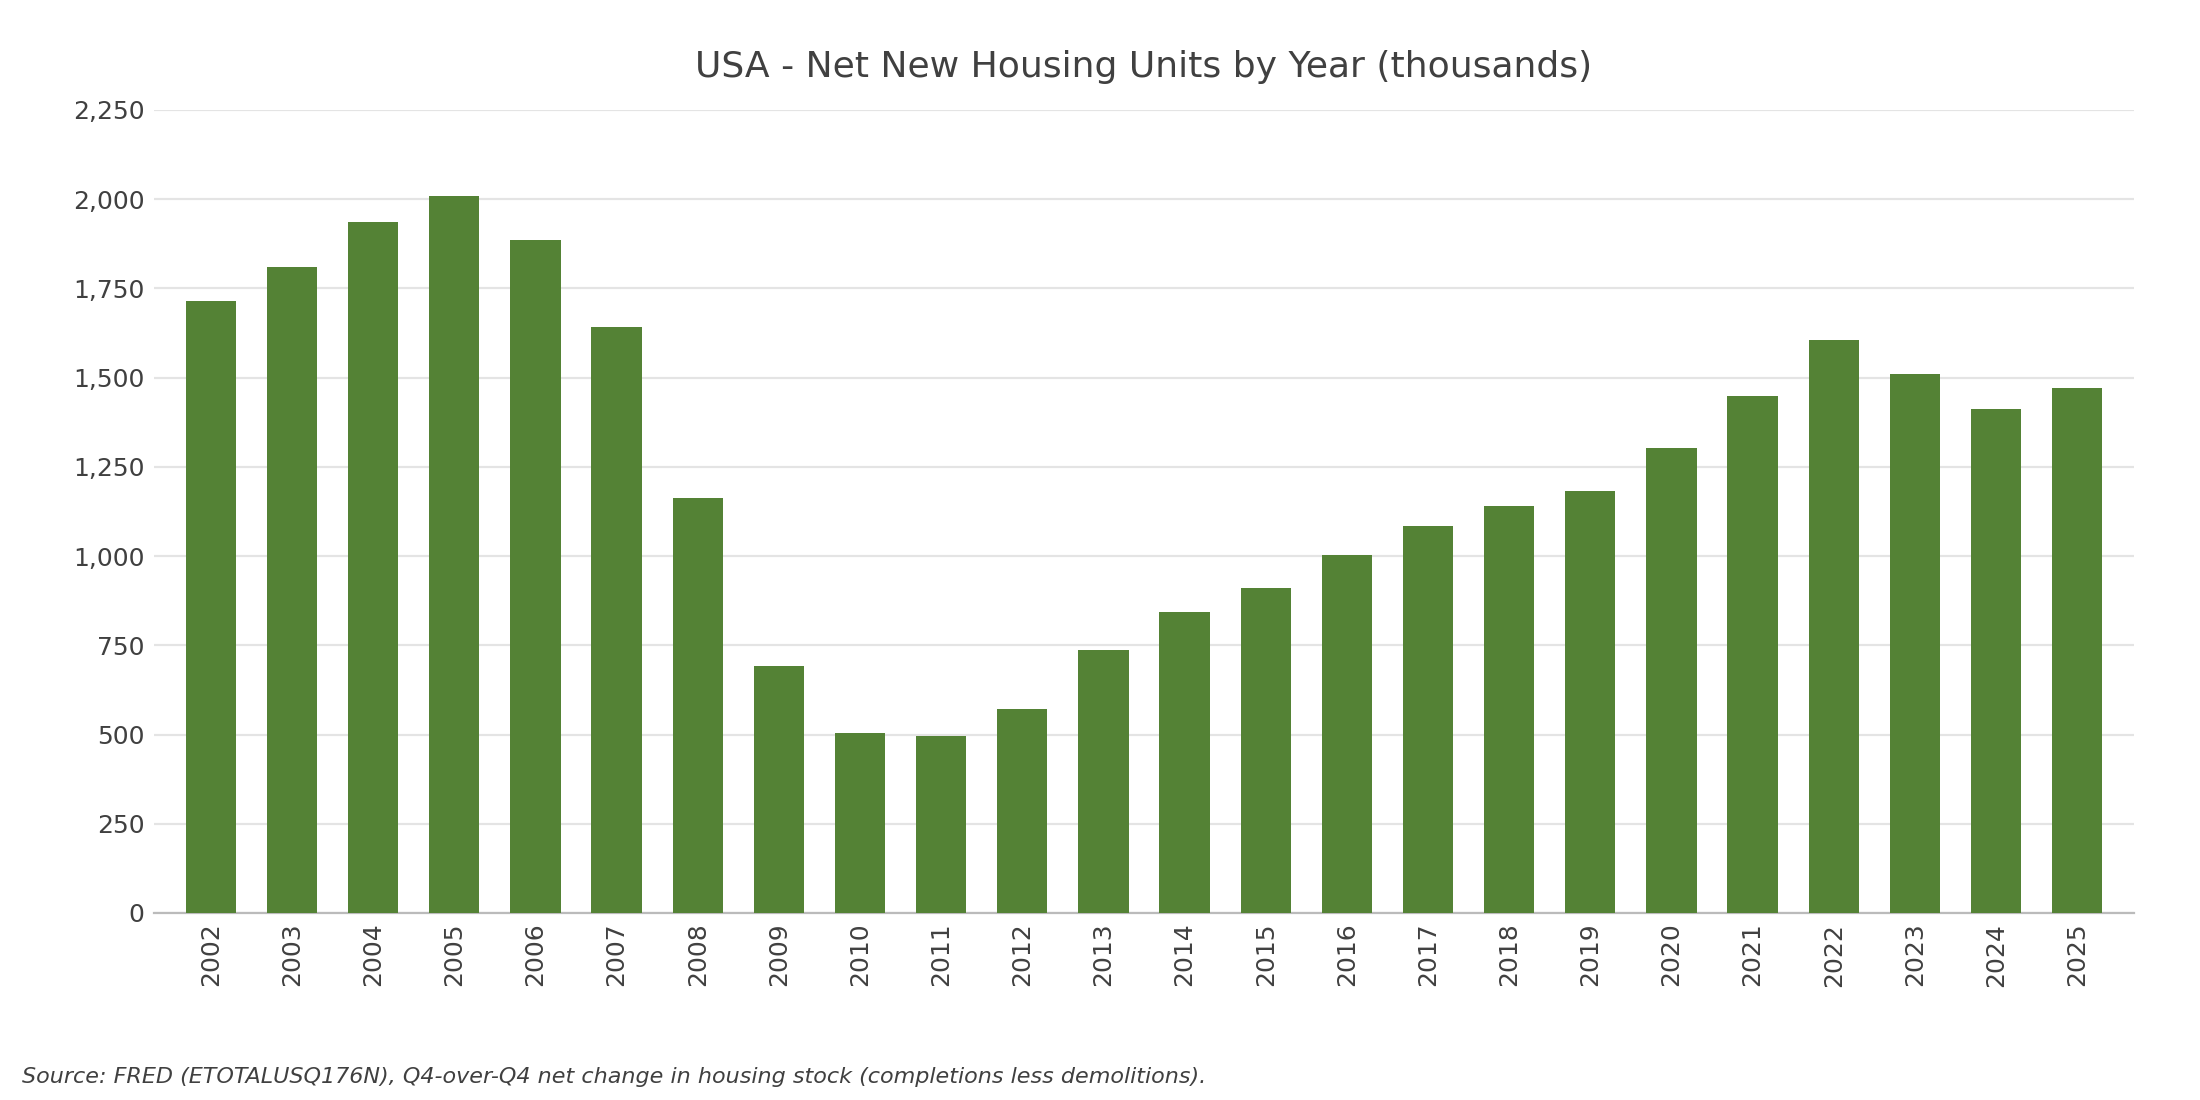
Net Additions to the U.S. Housing Stock by Year | Source: FRED, ETOTALUSQ176N | Chart: CRE42
The estimates of the current U.S. housing shortage below range from 1.2 million to roughly 8 million units, a spread that reflects fundamentally different definitions of “balanced.” See Quantifying the Structural U.S. Housing Shortage for the full methodology behind each estimate.
| Organization | Shortage Estimate (M units) | Year |
|---|---|---|
| J.P. Morgan | 1.2 | 2025 |
| CBRE Investment Mgmt | ~2.0 | 2025 |
| Realtor.com | 2.5 | 2024 |
| Moody’s Analytics | 2.8 | 2024 |
| Goldman Sachs (midpoint) | 3.5 | 2025 |
| Freddie Mac | 3.7 | 2024 |
| Zillow Research | 4.7 | 2025 |
| NAR | 5.5 | 2021 |
| McKinsey | ~8.0 | 2024 |
The median first-time homebuyer was 30 years old in 2008; by 2025 the median first-time buyer was 40, and first-time buyers’ share of purchases fell to a historic-low 21%. The mean age at first childbirth traced the same path, rising from 25.0 (2007) to a record 27.6 (2024).
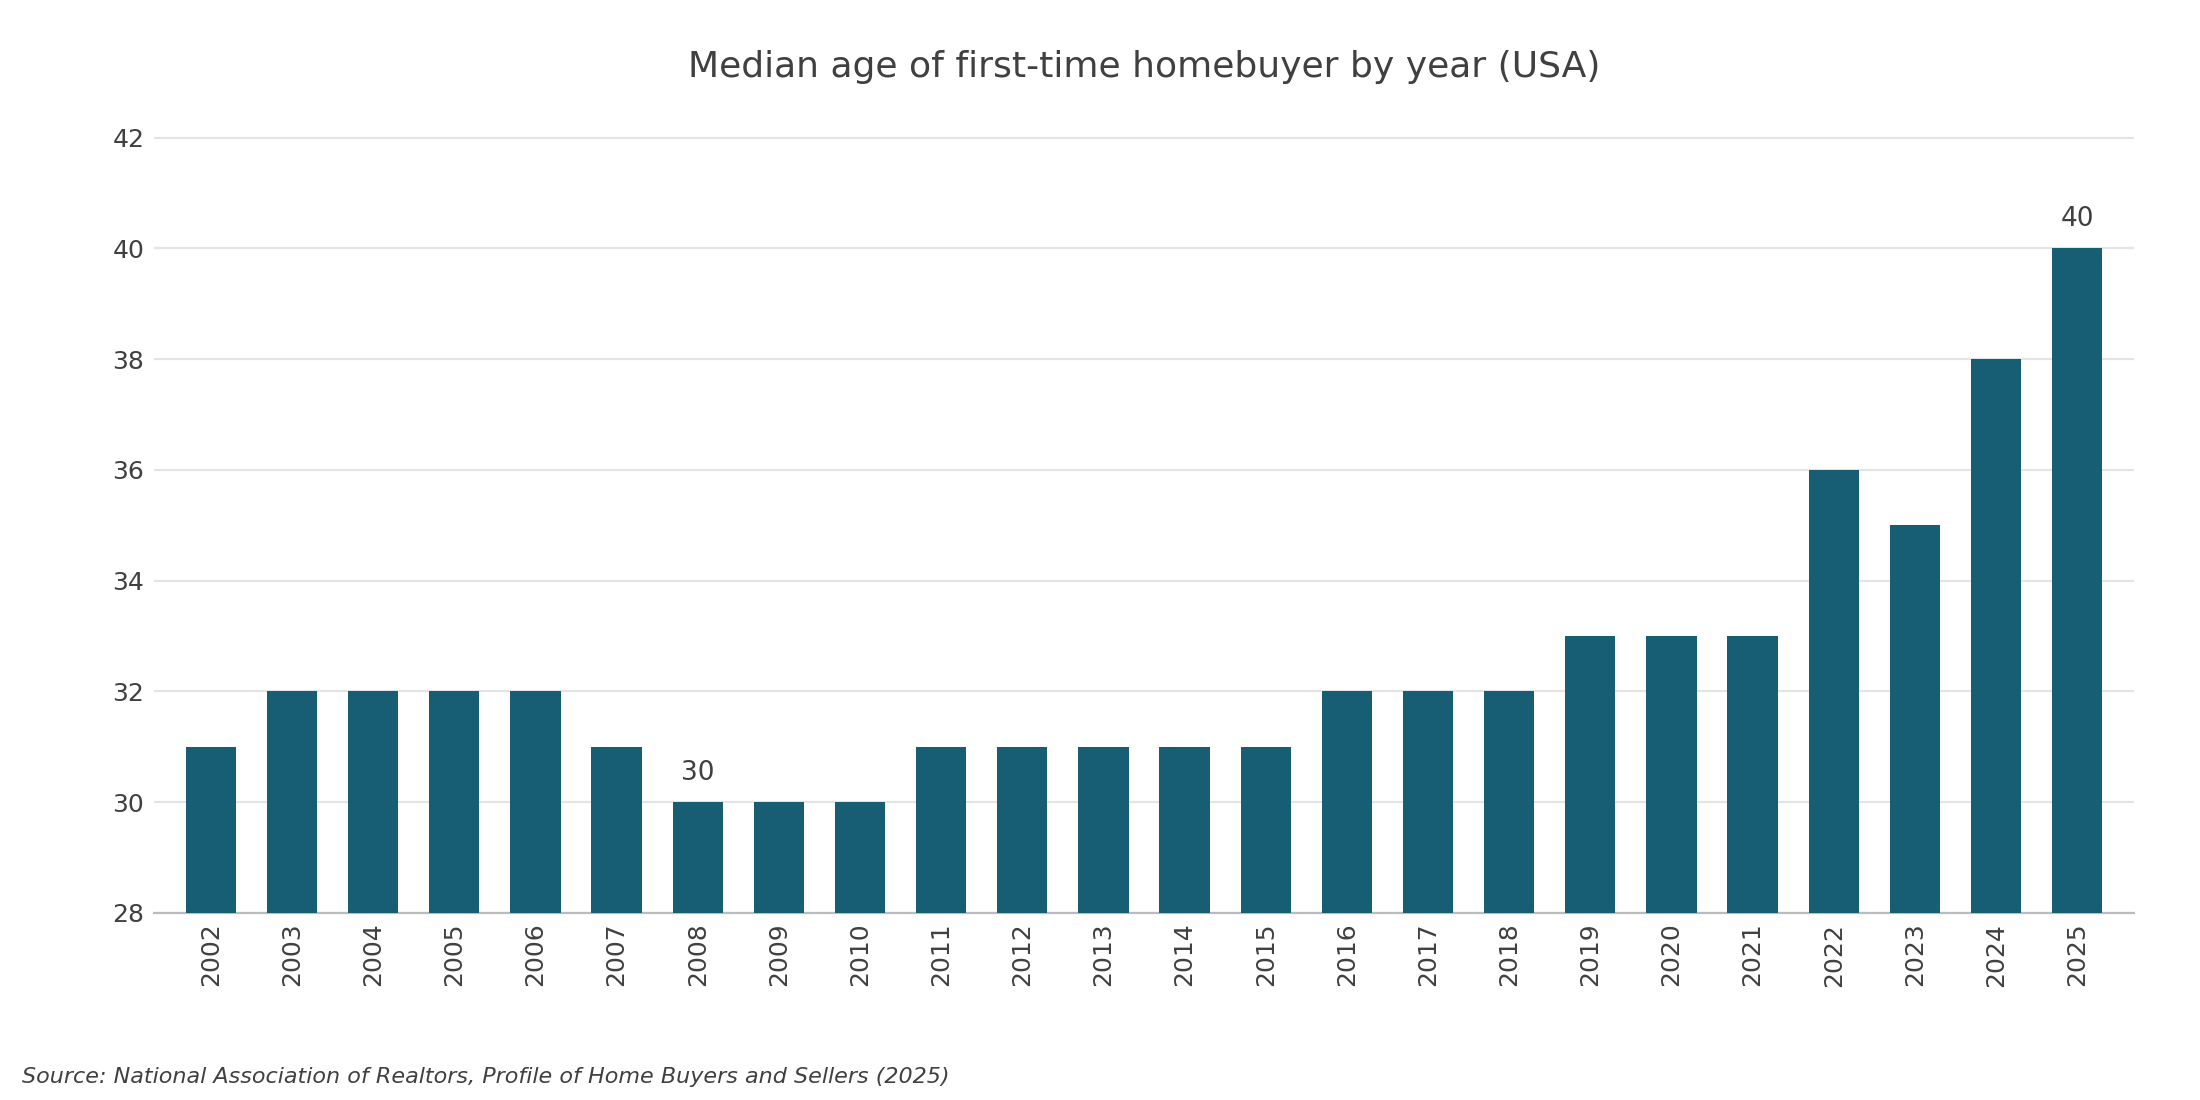
Median Age of the First-Time Homebuyer | Source: National Association of Realtors, Profile of Home Buyers and Sellers 2025 | Chart: CRE42
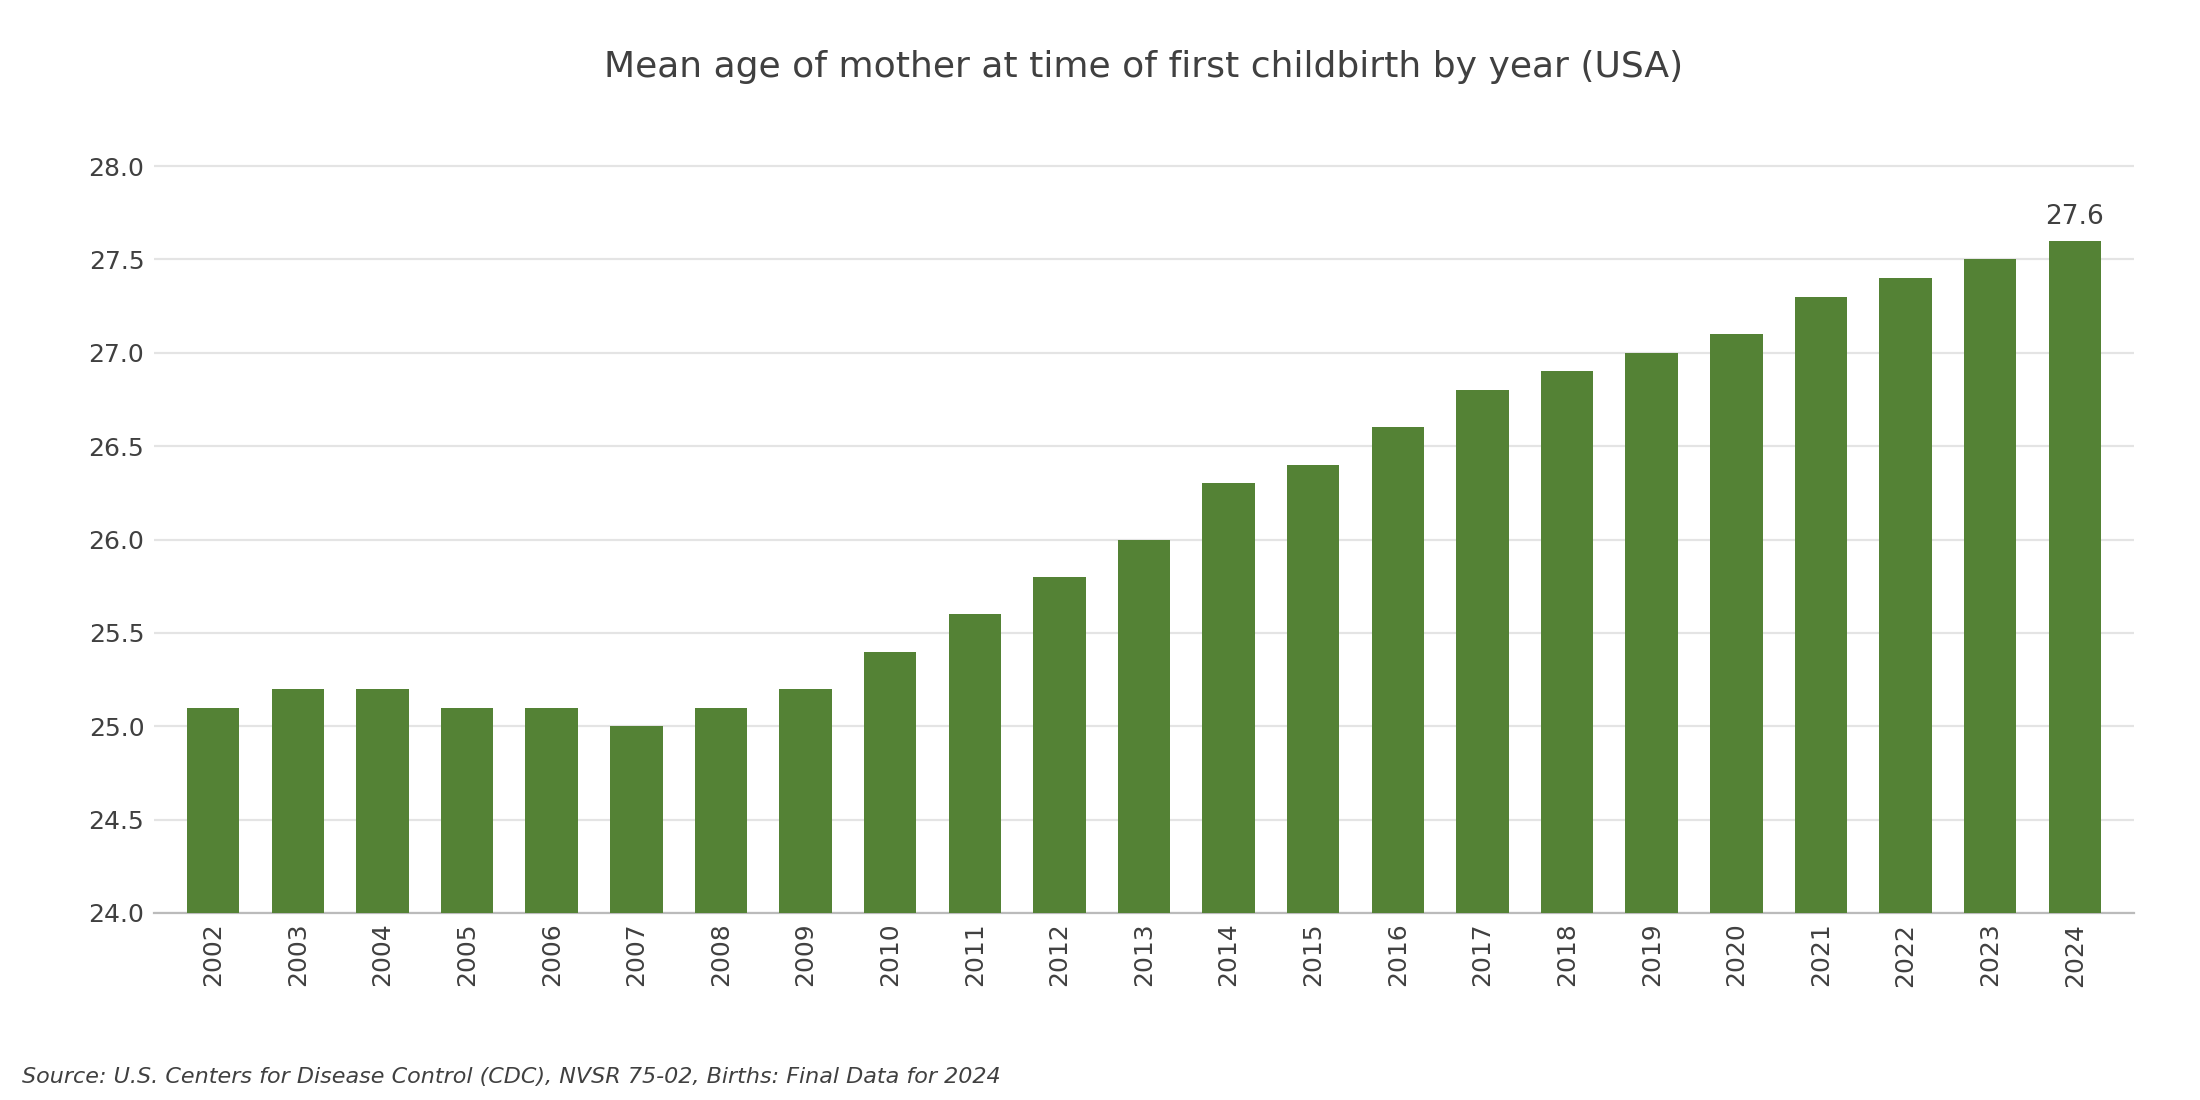
Mean Age of Mother at First Birth | Source: CDC NCHS, Births: Final Data for 2024 (NVSR 75-02) | Chart: CRE42
Renting is currently significantly cheaper than buying. The total monthly cost of owning the median home (approximate mortgage payment plus taxes, insurance, and upkeep)[1] peaked at 2.2× the median rent in 2023 and still sits at roughly 2.1× in 2025, near the highest premium since 2000. The wave of new apartment supply (below) held rent growth near inflation while home prices ran far ahead, resulting in a structural incentive to keep renting.
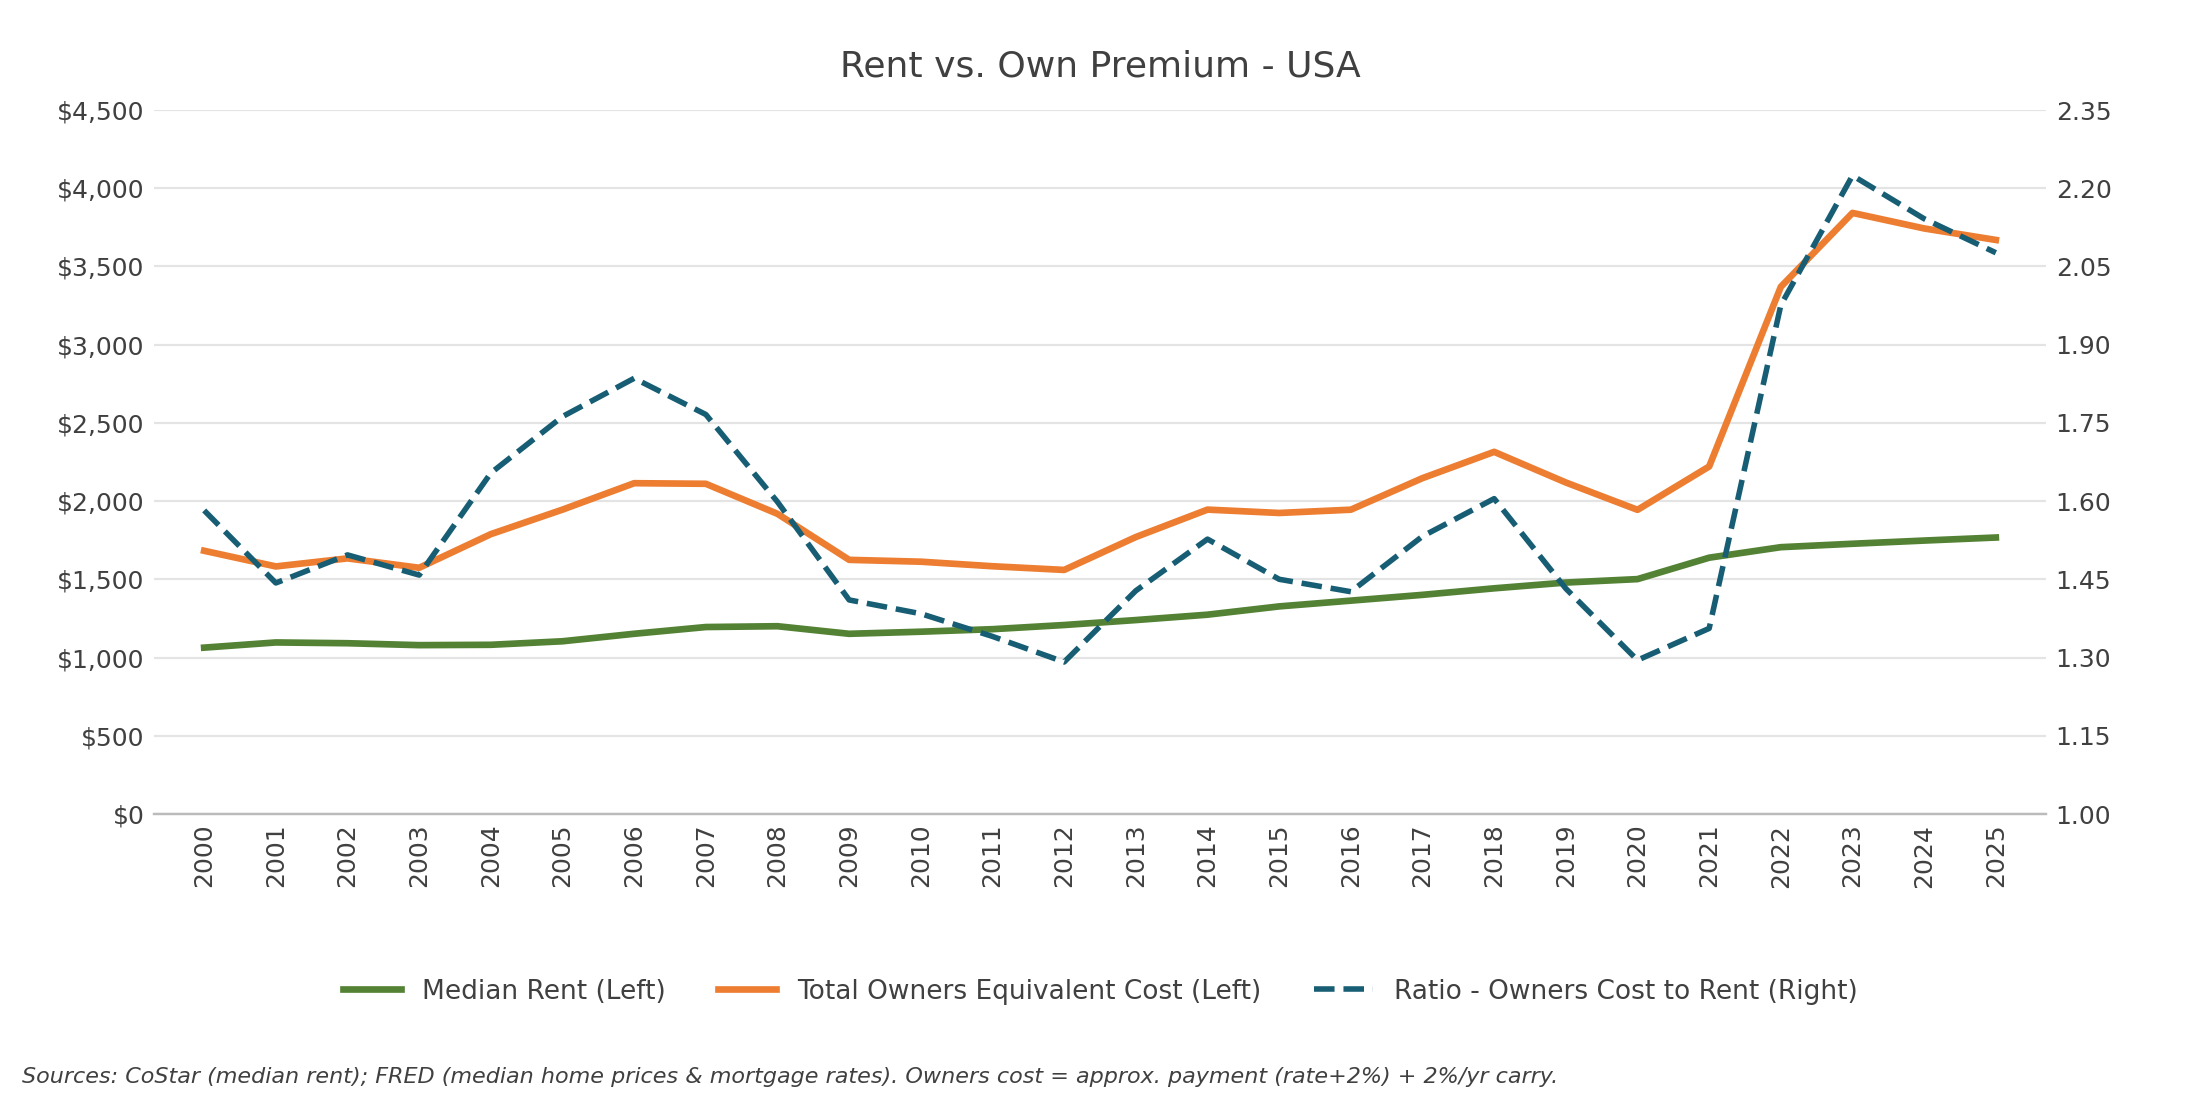
Monthly Cost to Own the Median Home as a Multiple of Median Rent | Source: CoStar; FRED, MSPUS and MORTGAGE30US | Chart: CRE42
1. Owner’s monthly cost is approximated as median home price × (mortgage rate + 2%) ÷ 12, an amortization proxy, plus a 2% annual carry for taxes, insurance and upkeep. See Home Affordability for the full methodology.
The Multifamily Boom and the Cliff Behind It
Developers responded to post-pandemic rent growth with the largest apartment construction wave in modern history: a record ~696,000 units delivered in 2024. But deliveries are yesterday’s starts, and starts have collapsed: from a peak of ~733,000 units in 2022 to an annualized ~283,000 in H1 2026, down 61% from peak, the lowest level since the early 2010s.
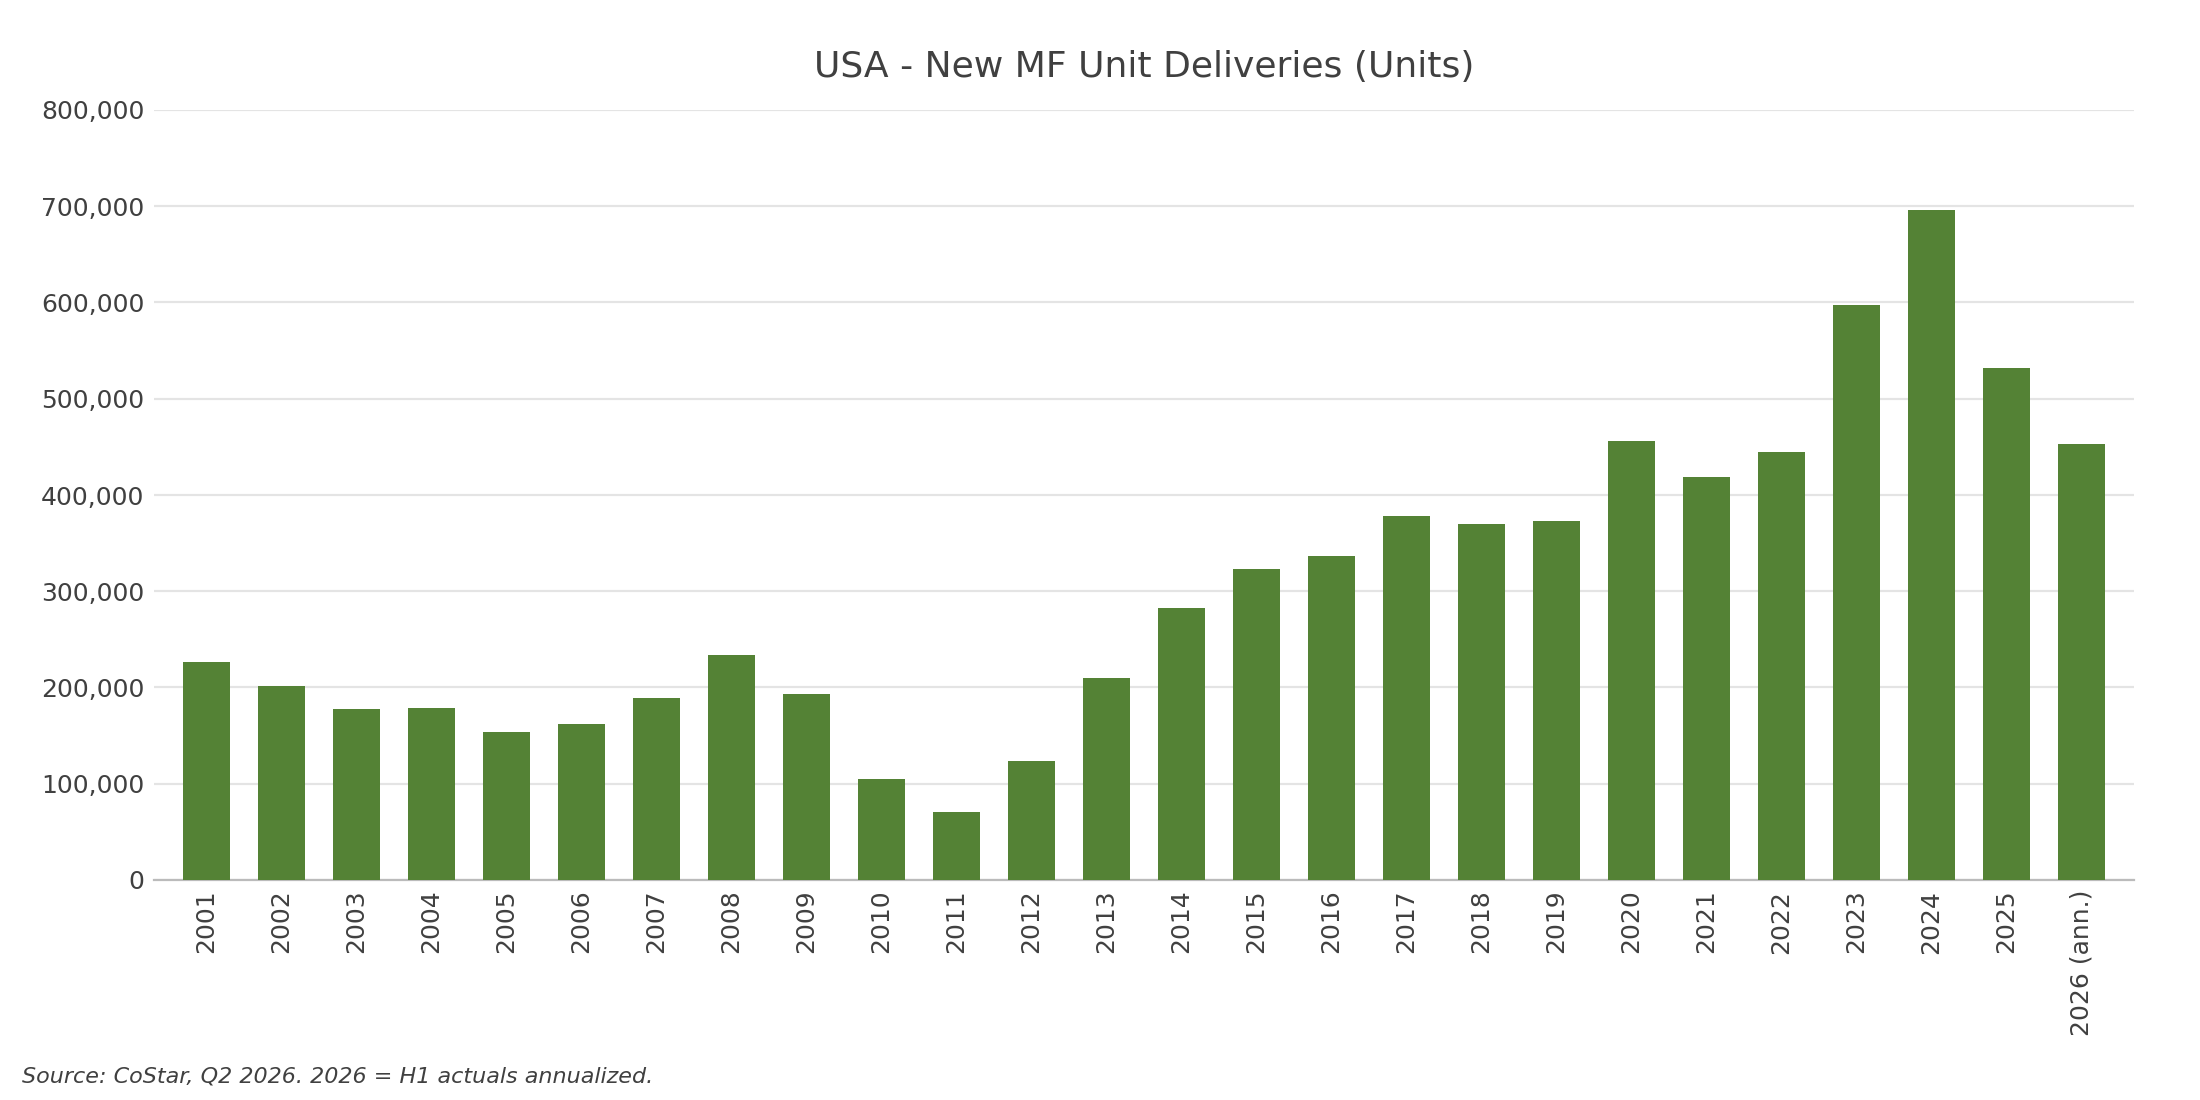
U.S. Multifamily Net Deliveries | Source: CoStar, Q2 2026; 2026 annualized from first-half figures | Chart: CRE42
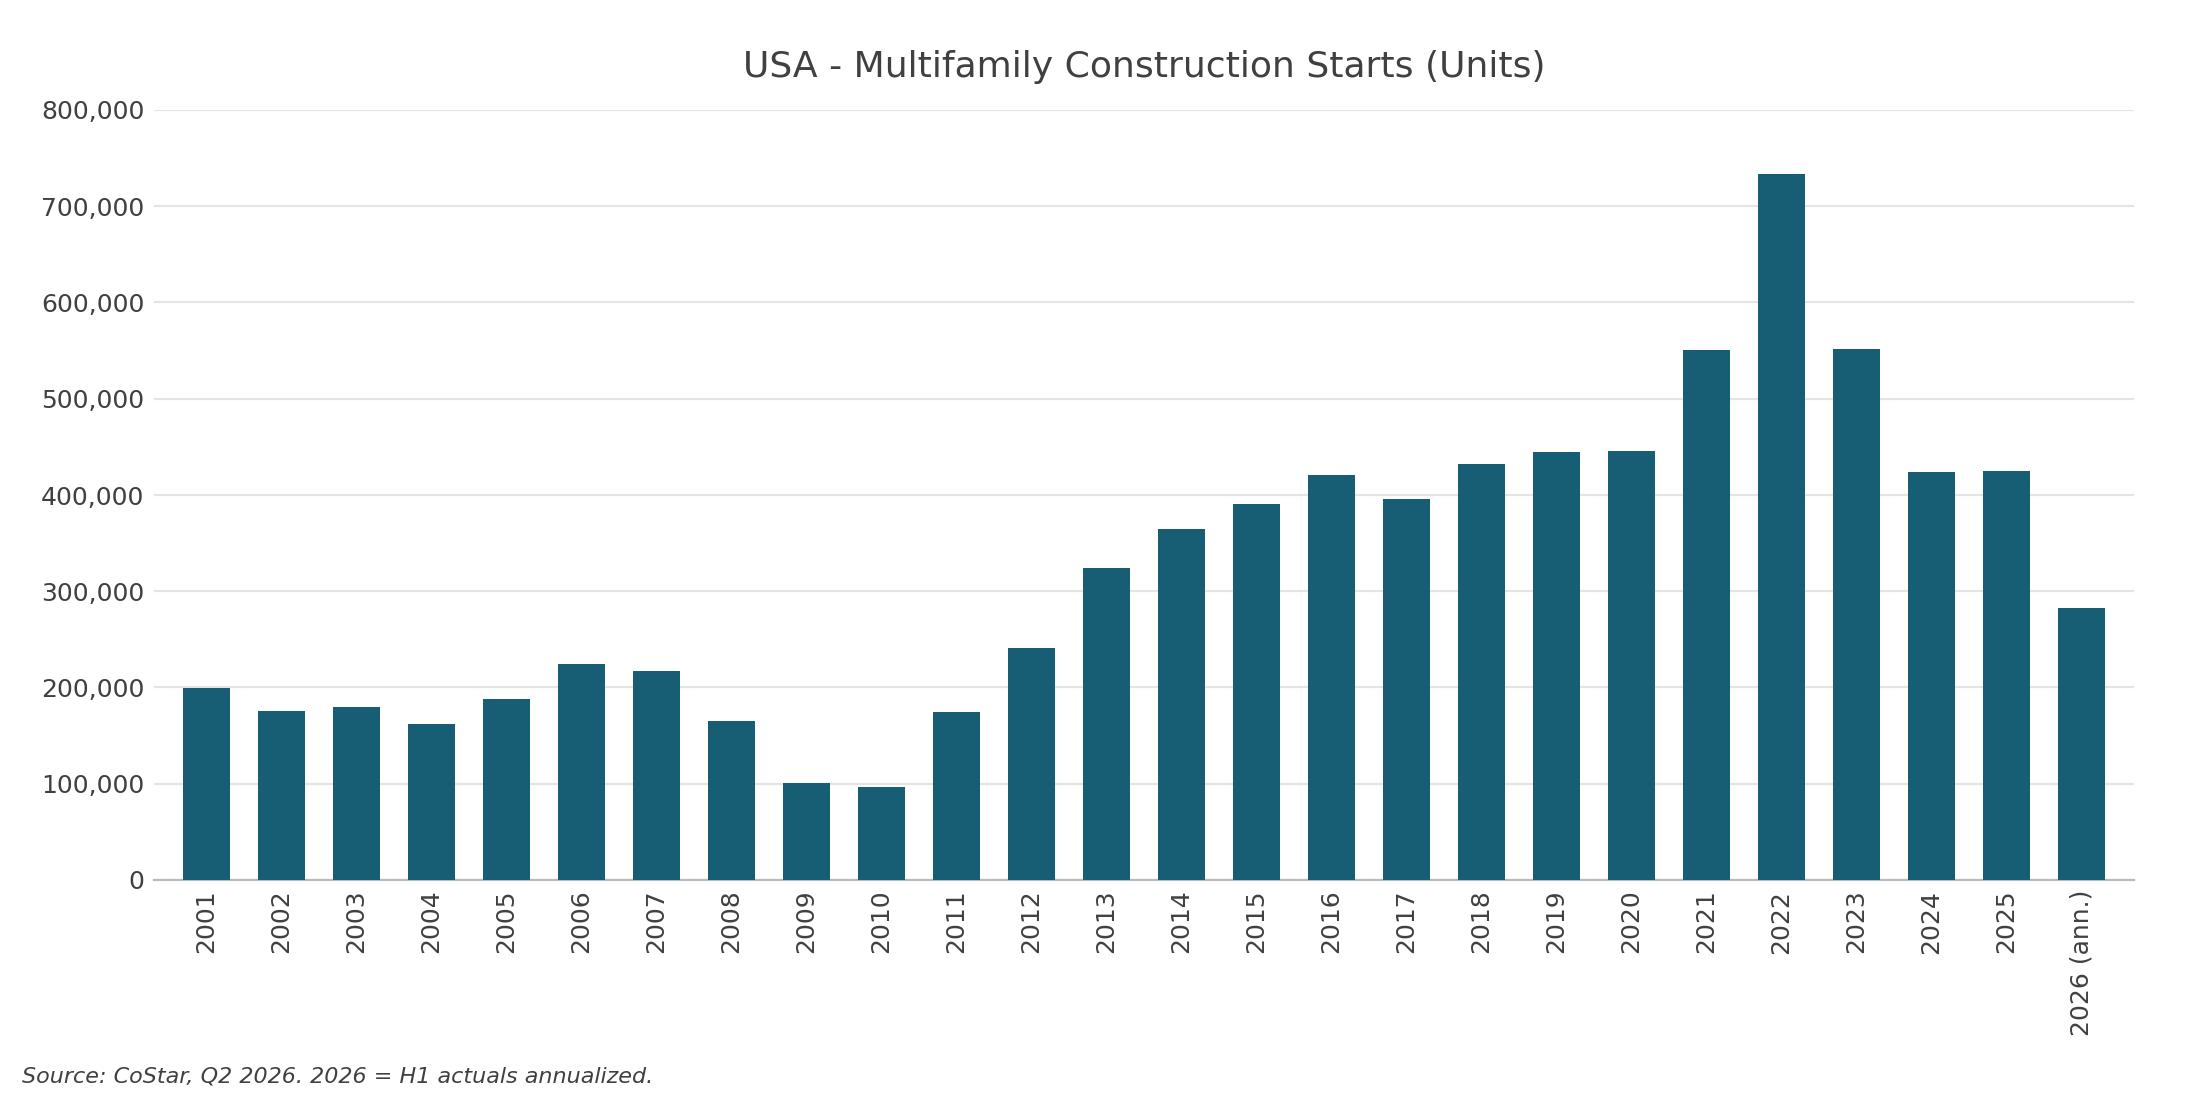
U.S. Multifamily Construction Starts | Source: CoStar, Q2 2026; 2026 annualized from first-half figures | Chart: CRE42
Part II: Divergence, Austin vs. Boston
Austin and Boston are similar in the ways that matter to apartment demand: large student populations and strong technology, healthcare and research employment. Both cities have great demand bases but differ greatly when considering ease and cost of new construction, as reflected in the supply boom in Austin vs. very moderate new construction in Boston.
Austin remains the fastest-growing large metro in America: +14.8% from April 2020 through mid-2025 (to 2.62M), still adding over 2% a year. Boston grew +1.8% over the same five years (to 5.03M), modest but positive while peer gateway metros shrank.
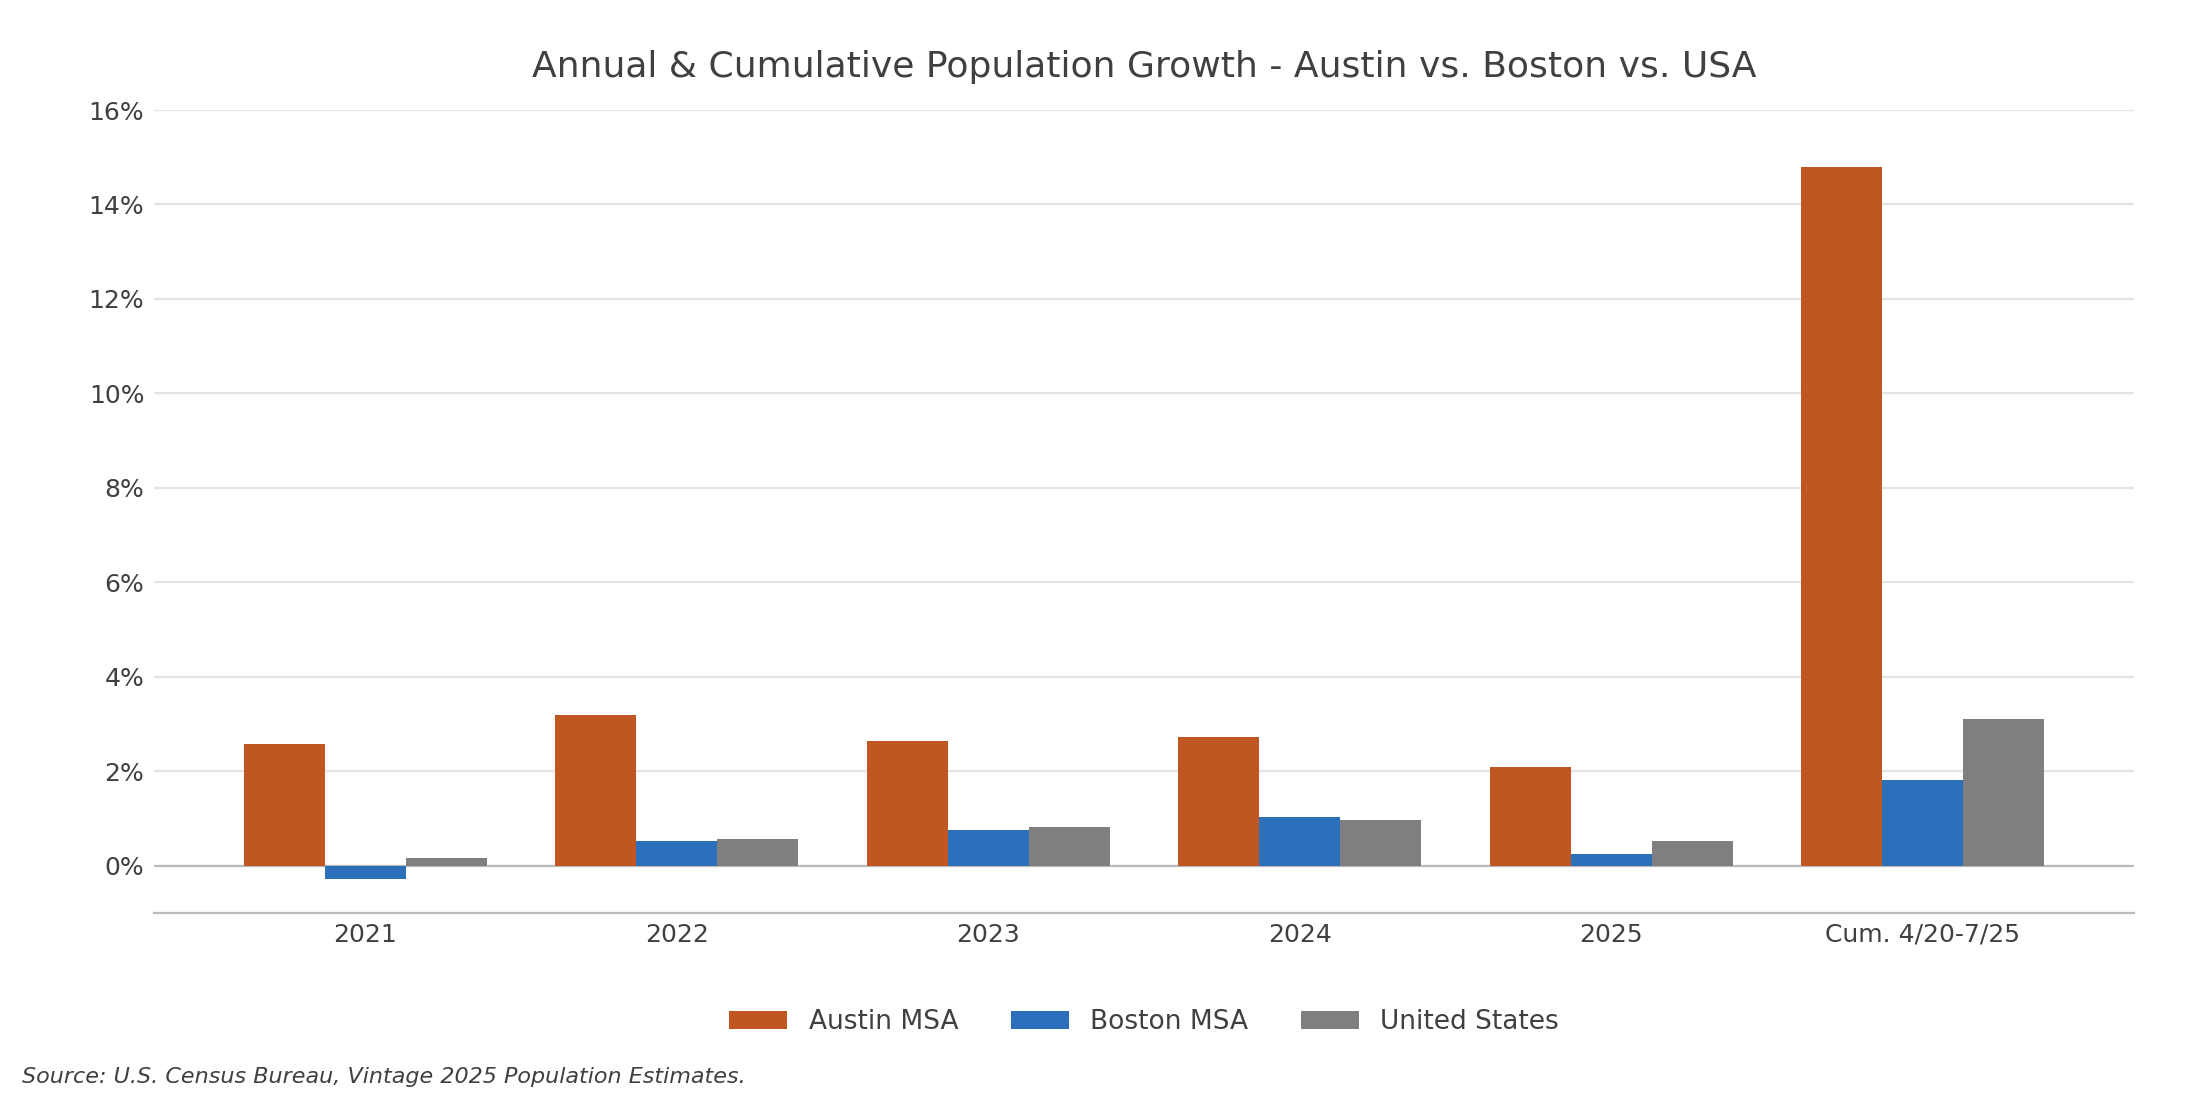
Population Growth, Austin vs. Boston, April 2020 to July 2025 | Source: U.S. Census Bureau, Vintage 2025 Population Estimates | Chart: CRE42
Growth rates say how fast each metro is adding people; the age structure says who they are. Austin’s pyramid carries a pronounced 25 to 39 bulge, the prime renter cohort, at 26% of the population in 2024 against 22% in Boston, while Boston carries the heavier 55-plus block (31% versus 22%). The two pyramids below share one time slider: drag it to watch Austin’s bulge arrive over the last two decades, or switch to the state or county pair.
Austin developers met pandemic-era rent growth with a torrent: deliveries peaked at ~32,000 units in 2024, more than four times Boston’s ~7,500. Boston’s constrained pipeline barely moved. Both markets have now pulled back hard: Austin started just ~3,200 units in H1 2026 (versus ~31,000 in full-year 2022).
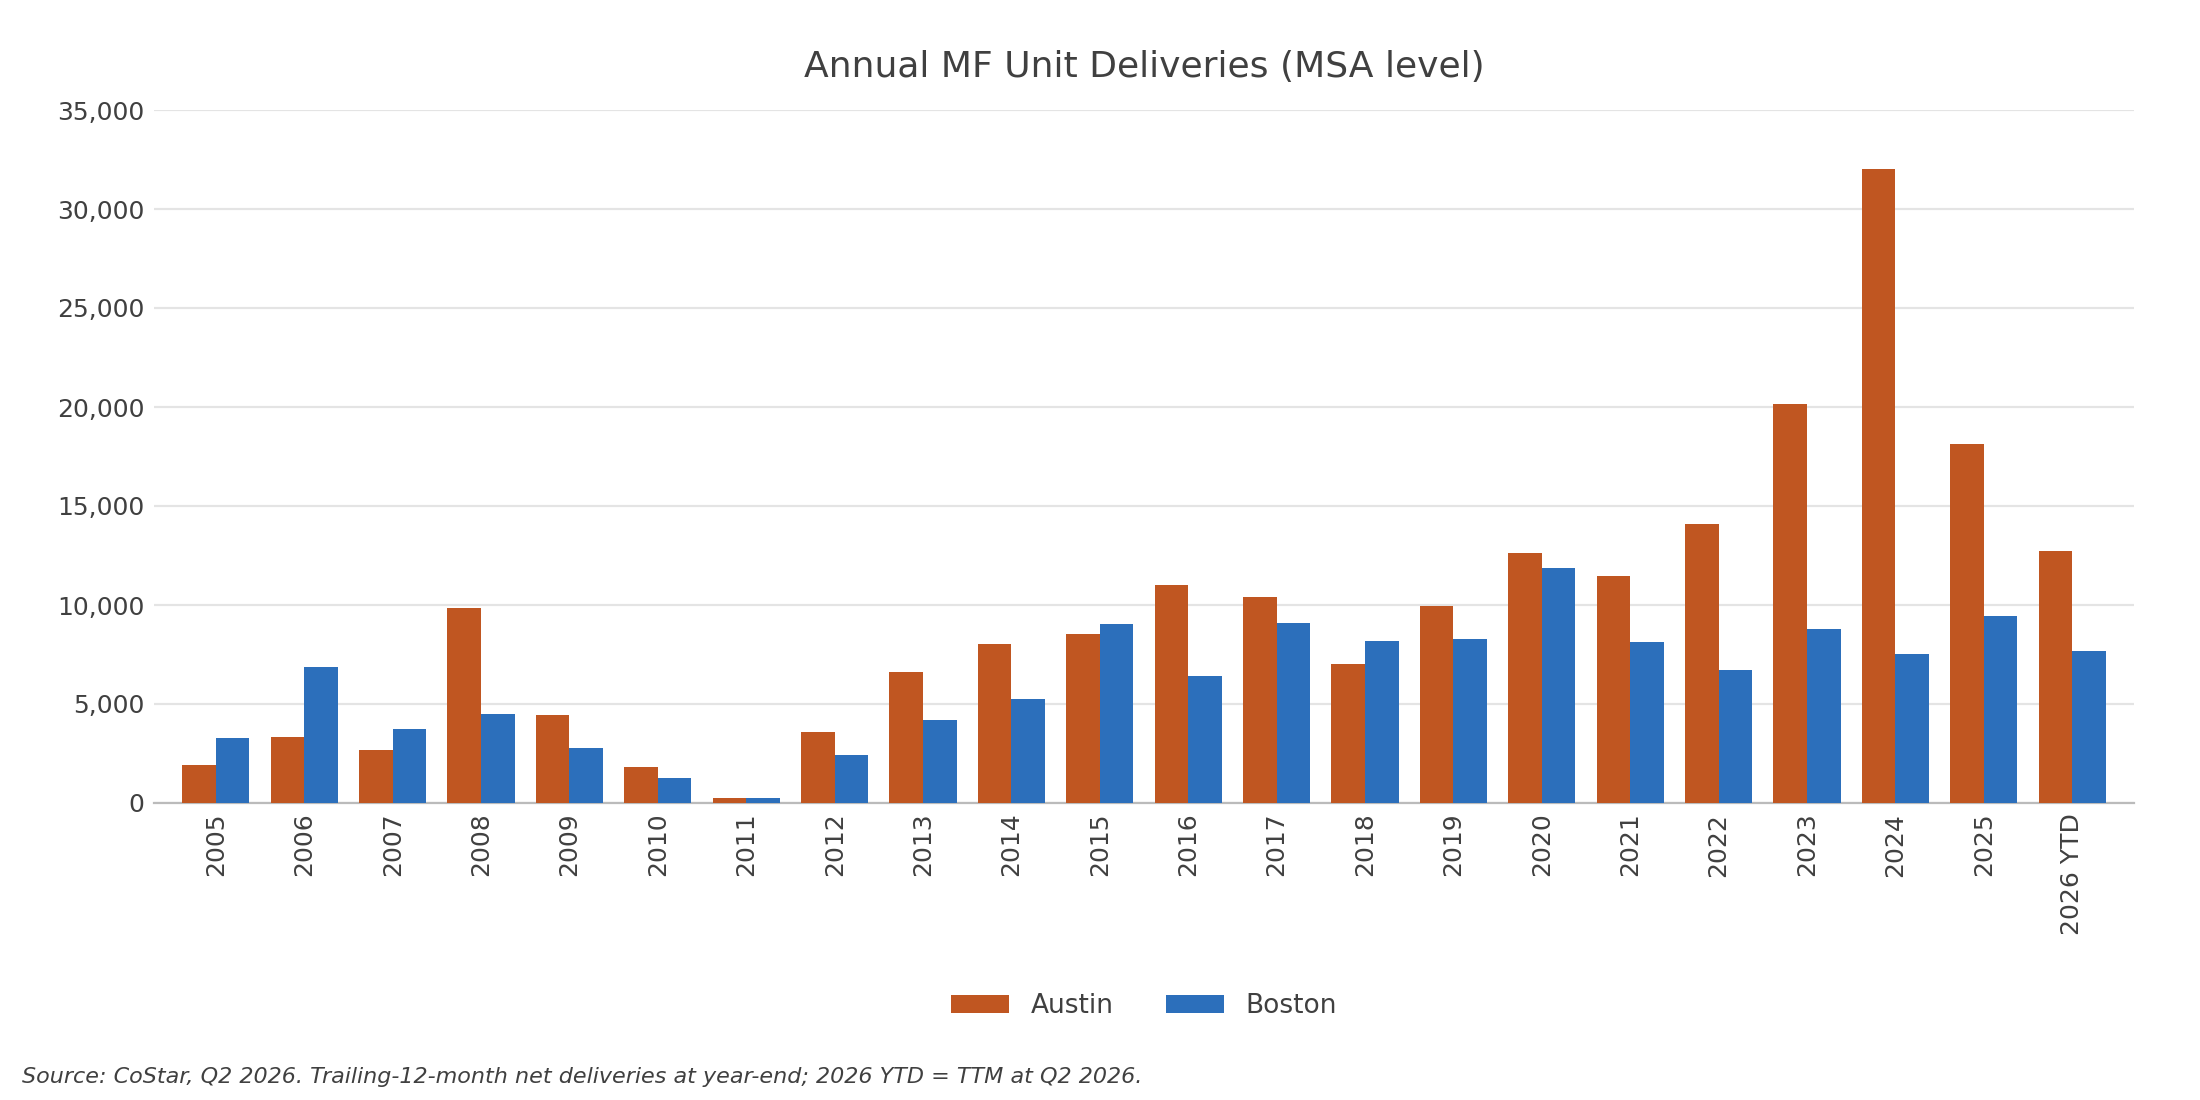
Annual Multifamily Net Deliveries, Austin vs. Boston | Source: CoStar, Q2 2026 | Chart: CRE42
The supply divergence set the rent paths. Austin asking rents are down ~10% from their 2022 peak ($1,736 → $1,562); Boston rents ground steadily higher to $3,016. The Boston premium over Austin, 56% in 2021, has widened to 93%.
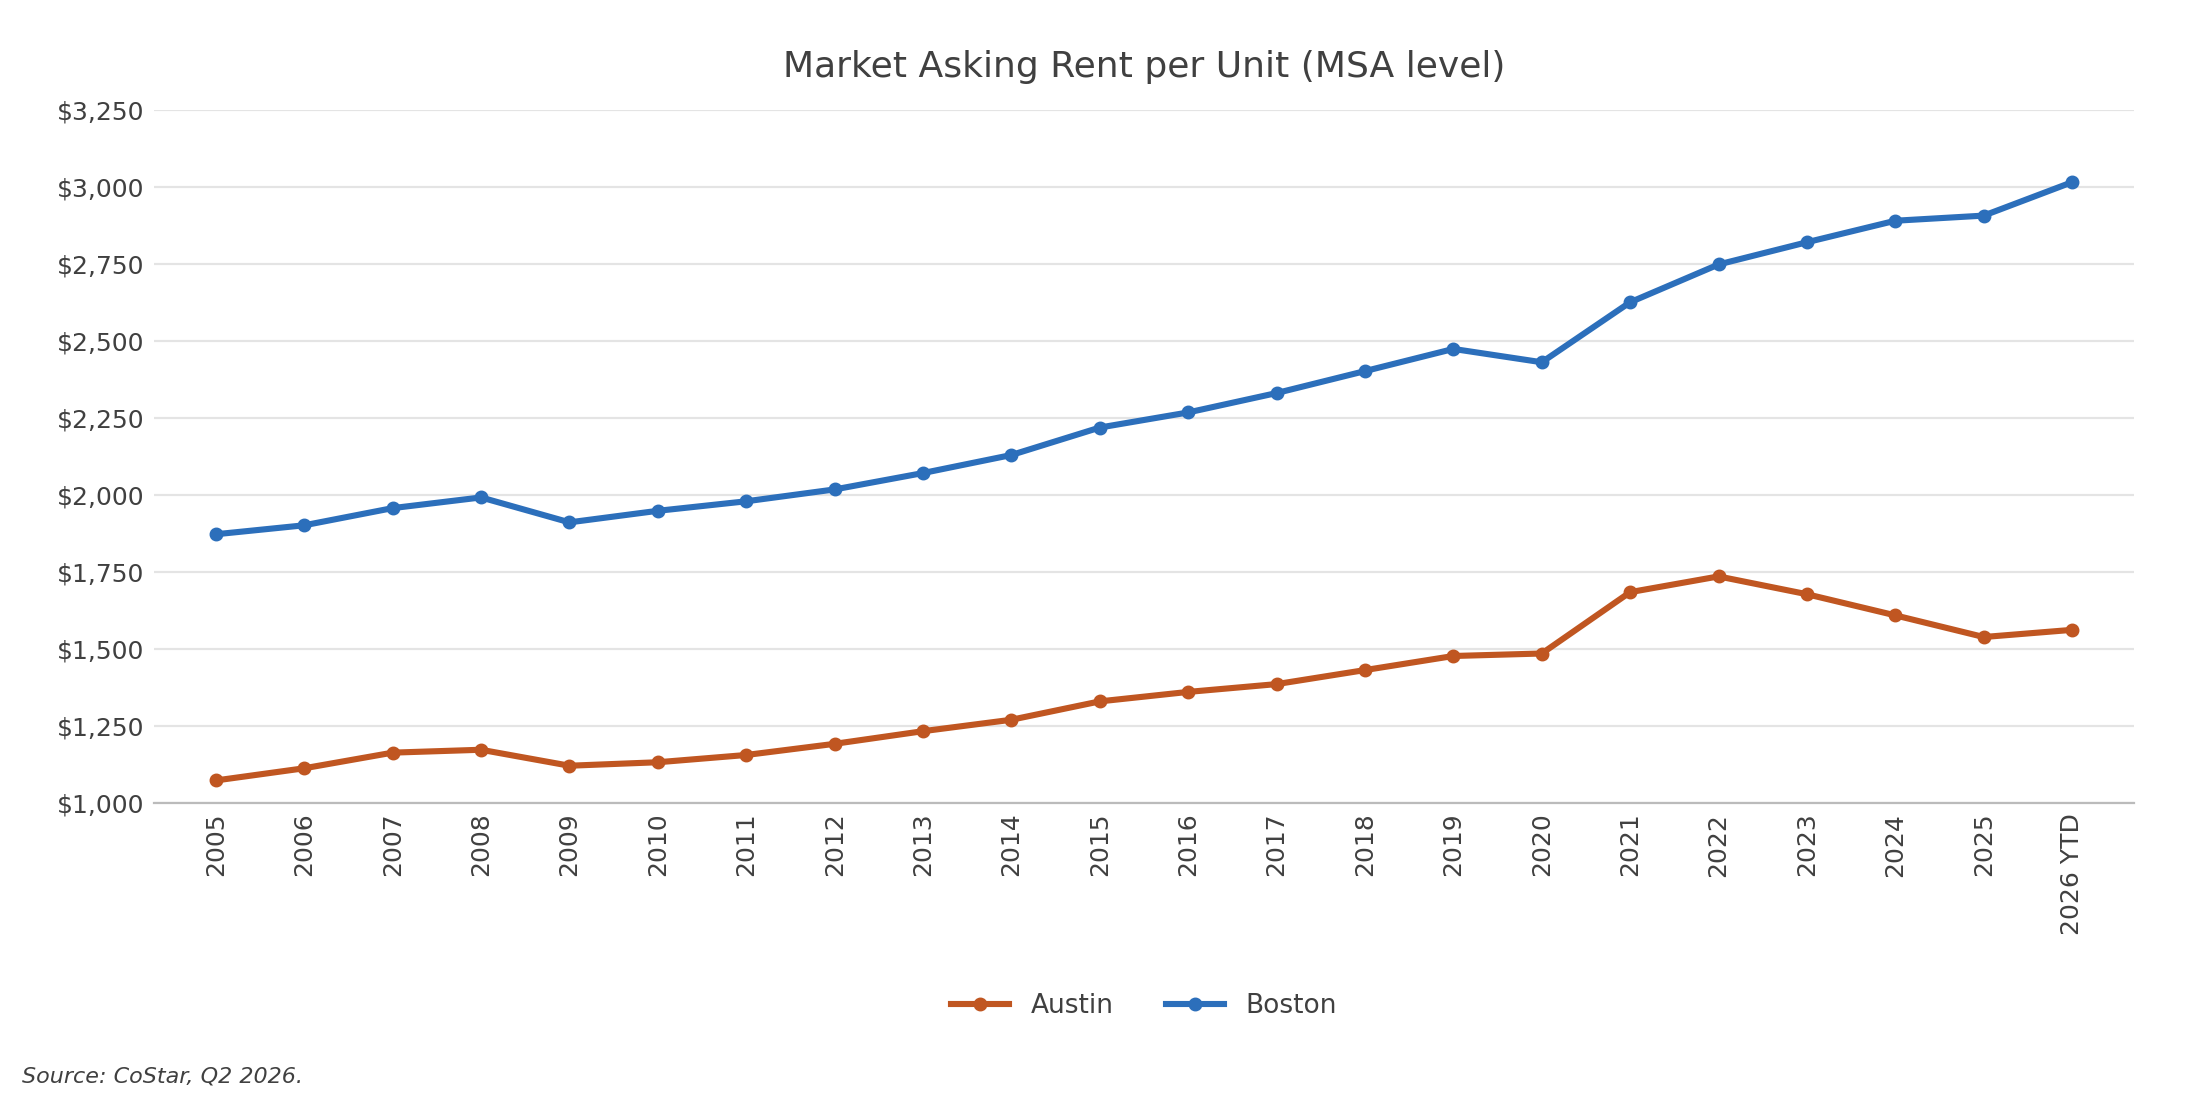
Market Asking Rent per Unit, Austin vs. Boston | Source: CoStar, Q2 2026 | Chart: CRE42
Austin vacancy peaked at 15.8% at the end of 2024 and has ground down to 12.2% by mid-2026 on record absorption: trailing-twelve-month absorption of ~20,800 units against only ~12,700 delivered. Boston sits at 5.7%, about where it always sits. The debate: how fast does Austin’s recovery run, and what is that recovery worth relative to Boston’s certainty?
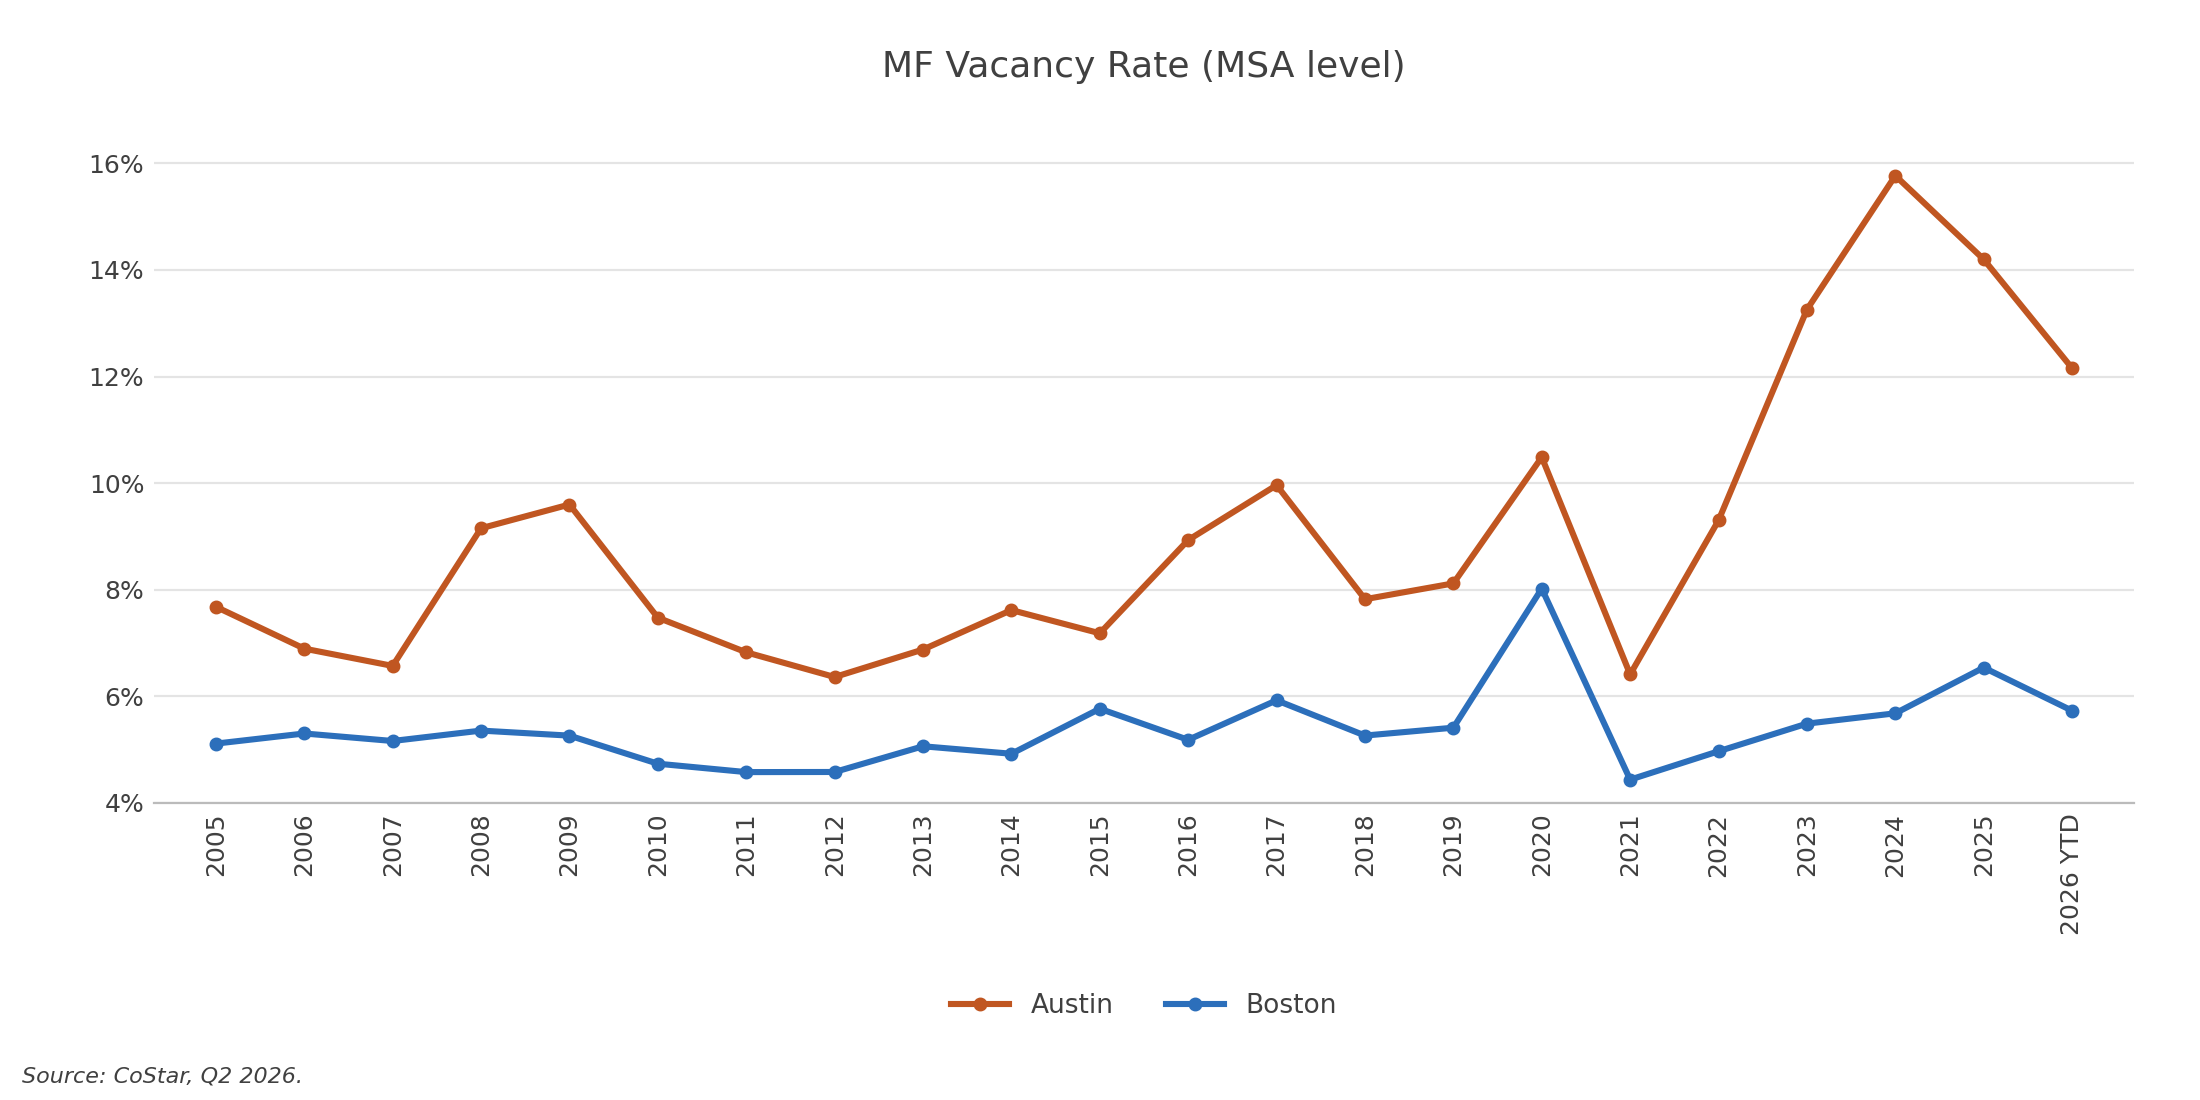
Multifamily Vacancy Rate, Austin vs. Boston | Source: CoStar, Q2 2026 | Chart: CRE42
Part III: The Submarkets
| Vacancy | Asking Rent | Under Constr % of Inventory | |
|---|---|---|---|
| MSA level (Q2 2026) | |||
| Austin MSA | 12.2% | $1,562 / unit | 4.4% |
| Boston MSA | 5.7% | $3,016 / unit | 5.0% |
| Submarket level | |||
| North Austin | 14.5% | $1.78 / SF | 1.5% |
| East Cambridge | 5.2% | $5.19 / SF | 6.7% |
| Micromarket level | |||
| The Domain | 4.7% | $2.46 / SF | 0% |
| Kendall Square | 6.3% | $5.32 / SF | 16.8% |
Source: CoStar, data through Q2 2026. Full history on the Compare tabs of the companion workbook.
The Domain / North Burnet (Austin)
Austin’s “second downtown” has already worked through its glut: micromarket vacancy is down to ~4.7%, below Kendall’s, with zero units under construction and asking rents growing again (+2.8% YoY) while the surrounding North Austin submarket still digests 14.5% vacancy. The bear case: recovery at the Domain is already partly priced, the submarket around it is still soft, and a 608-unit project (Domain South End) is slated for 2028.
East Cambridge / Kendall Square (Boston)
The strongest rent block in one of America’s most supply-constrained metros: $5.32/SF asking, ~6% vacancy, anchored by MIT and the biotech cluster. Two wrinkles: Kendall’s office/lab market, the employment engine behind those rents, is carrying roughly 17% total availability in the current downturn, and the micromarket has a real pipeline: ~16.8% of inventory under construction, including a 439-unit delivery in 2027, the subject’s lease-up year.
Domain comp set (CoStar, Q2 2026)
| Property | Class | Units | Built | Vac | Ask/SF | Eff/SF |
|---|---|---|---|---|---|---|
| The Bowen | A | 339 | 2021 | 2.9% | $3.28 | $2.90 |
| Flatiron Domain | A | 364 | 2020 | 4.4% | $2.92 | $2.91 |
| Alexan Braker Pointe | A | 314 | 2023 | 3.8% | $2.26 | $1.82 |
| Bridge at Kenzie | A | 279 | 2014 | 11.1% | $2.22 | $2.04 |
| The Standard at Domain Northside | A | 563 | 2016 | 4.6% | $2.19 | $2.00 |
| Gallery at Domain | A | 903 | 2015 | 6.8% | $2.14 | $1.87 |
| Griffis at The Domain | B | 755 | 2012 | 2.8% | $2.07 | $2.07 |
| Overture Domain | B | 189 | 2018 | 9.5% | $2.92 | $2.47 |
| Domain South End (pipeline) | B | 608 | 2028 | – | – | – |
Kendall comp set (CoStar, Q2 2026)
| Property | Class | Units | Built | Vac | Ask/SF | Eff/SF |
|---|---|---|---|---|---|---|
| Proto | A | 280 | 2018 | 6.4% | $7.53 | $7.47 |
| One65 Main | B | 300 | 2022 | 4.7% | $6.82 | $6.78 |
| Watermark Kendall East | A | 144 | 2013 | 6.9% | $5.52 | $5.48 |
| 100 Memorial Drive | C | 261 | 1972 | 5.4% | $5.51 | $5.47 |
| Prism Apartments | A | 136 | 2021 | 3.7% | $5.25 | $5.05 |
| Vivo Apartment Homes | A | 91 | 2015 | 3.3% | $5.12 | $4.92 |
| Watermark Kendall West | A | 321 | 2004 | 4.7% | $5.02 | $4.99 |
| Third Square Apartments | A | 471 | 2008 | 8.5% | $4.44 | $4.40 |
| Kendall Square (pipeline) | A | 439 | 2027 | – | – | – |
Condensed; full comp exports (unit mixes, concessions, sale history) in the companion workbook. Senior-living and pre-2000 outliers omitted.
Locked assumptions: 150 units · 120,000 rentable SF · 800 SF average unit · Operating margin 50% of effective gross rent* · sale at end of Year 5 (12/31/2031) valued at Year-6 NOI ÷ exit cap · no debt, no transaction costs.
*Operating margin covers all operating expenses, real estate taxes, management, insurance and vacancy. Deliberately simplified for class. The same 50% margin is applied to both markets for simplicity; in reality, properties in Boston typically operate at a higher margin, since operating costs do not scale with rent; high-rent markets keep more of each rent dollar as NOI. Effective rent = market rent × (1 − months free ÷ 12); concessions represent economic softness, separate from physical vacancy inside the margin.
Comp references (CoStar, Q2 2026): Domain-area Class A ~$2.40 asking PSF (2020+ vintage $2.26–$3.28), concessions ≈ 1 month; Kendall Class A ~$5.50 asking PSF, concessions ≈ 0.5 month. Market caps: Austin 5.7%, Boston 5.2%. Source: CoStar 08.30–31.2026; basis: MITCRE Fall 2025 case study, recalibrated.
Notes
[1] ↩
Companion workbook. multifamily-case-study-austin-boston-h2-2026.xlsx: Austin and Boston MSA, submarket and micromarket histories with embedded CoStar-style charts, the Domain and Kendall comp sets, three comparison tabs, national context tabs, and the Cash Flow Austin / Cash Flow Boston model tabs whose blue input cells mirror the decision model above. CoStar, Q2 2026.
Sources
- CoStar Group, Austin and Boston multifamily market, submarket and micromarket reports, exported 08.30 to 08.31.2026, data through Q2 2026. Inventory, deliveries, absorption, vacancy, asking rents, rent growth, construction pipeline, sale prices and cap rates. costar.com
- U.S. Census Bureau, Vintage 2025 Population Estimates, metropolitan and county totals. census.gov
- U.S. Census Bureau, American Housing Survey 2023, housing units by structure type. census.gov
- Federal Reserve Bank of St. Louis (FRED), ETOTALUSQ176N (total housing units), POPTHM (population), TTLHH (households), MSPUS (median sales price), MORTGAGE30US (30-year mortgage rate). fred.stlouisfed.org
- National Association of Realtors, Profile of Home Buyers and Sellers 2025. nar.realtor
- CDC National Center for Health Statistics, Births: Final Data for 2024, NVSR 75-02. cdc.gov/nchs
- Zillow Research (2026) and Harvard Joint Center for Housing Studies, State of the Nation’s Housing 2026, for the shortage-estimate range. Quantifying the Structural U.S. Housing Shortage carries the full estimate table and methodology.
Methodology & Data Notes
Data Period
Every CoStar series on this page is cut at the last closed quarter, Q2 2026 (June 30, 2026), following the CRE42 house convention. Exports were pulled 08.30 to 08.31.2026, so the comp-level and submarket snapshots reflect property records as of that pull date against Q2 2026 market statistics. No CoStar forecast or quarter-to-date row appears in any chart or table. National multifamily deliveries and starts for 2026 are annualized by doubling first-half figures, and the year 2000 is excluded from the national supply series because CoStar’s first quarter carries an opening-stock artifact.
Geographic Levels
Three levels appear on this page and they are not interchangeable. MSA is the full metropolitan market. Submarket is CoStar’s own boundary set: The Domain sits inside North Austin, and East Cambridge and Kendall Square sit inside Harvard MIT. Micromarket is the block-level geography around each subject building. Rents are quoted per unit at the MSA level and per square foot at the submarket and micromarket levels, matching CoStar’s own reporting basis.
Rent versus Own
The owner’s monthly cost is approximated as the median home price multiplied by the sum of the prevailing 30-year mortgage rate plus two percent, divided by twelve, which serves as an amortization proxy, plus a further two percent annual carry for taxes, insurance and upkeep. The result is expressed as a multiple of the CoStar median asking rent. This is the same formula used on U.S. Home Affordability, so the two pages are directly comparable.
The Decision Model
The model is deliberately simplified for classroom use. Both buildings are 150 units and 120,000 rentable square feet, purchased 1/1/2027 for all cash and sold 12/31/2031 at the group’s exit cap rate applied to Year-6 net operating income. A flat 50 percent operating margin is applied to effective gross rent in both markets; this is a simplification, since properties in higher-rent markets such as Boston typically operate at a higher margin because operating costs do not scale with rent. Physical vacancy sits inside that margin. Concessions are entered separately as months of free rent, so effective rent equals market rent multiplied by one minus months divided by twelve. Rent growth applies from Year 2. Returns are gross: no debt and no transaction costs. The on-page model, the standalone prototype and the Cash Flow Austin and Cash Flow Boston tabs of the companion workbook return identical results to the basis point, and were checked against an independent reference implementation.
Guidance Prices
Guidance prices are set by CRE42 for the exercise rather than drawn from a live listing, calibrated so that neither market is the obvious answer at the default assumptions. They are the starting point for discussion, not a valuation.