Overview
The United States population of 347 million is shaped by three converging demographic forces: the delayed household formation of 72 million Millennials — the largest living generation — now entering peak homebuying years, the retirement of approximately 70 million Baby Boomers driving unprecedented senior housing demand, and a total fertility rate (TFR) of 1.6 births per woman (2024) that places the country well below the 2.1 replacement threshold. With net immigration declining sharply from 2.7 million in 2024 to 1.3 million in 2025, the U.S. population profile may look increasingly like the rapidly aging developed countries of Asia and Europe without a change in trajectory.
U.S. Population Structure (2025)
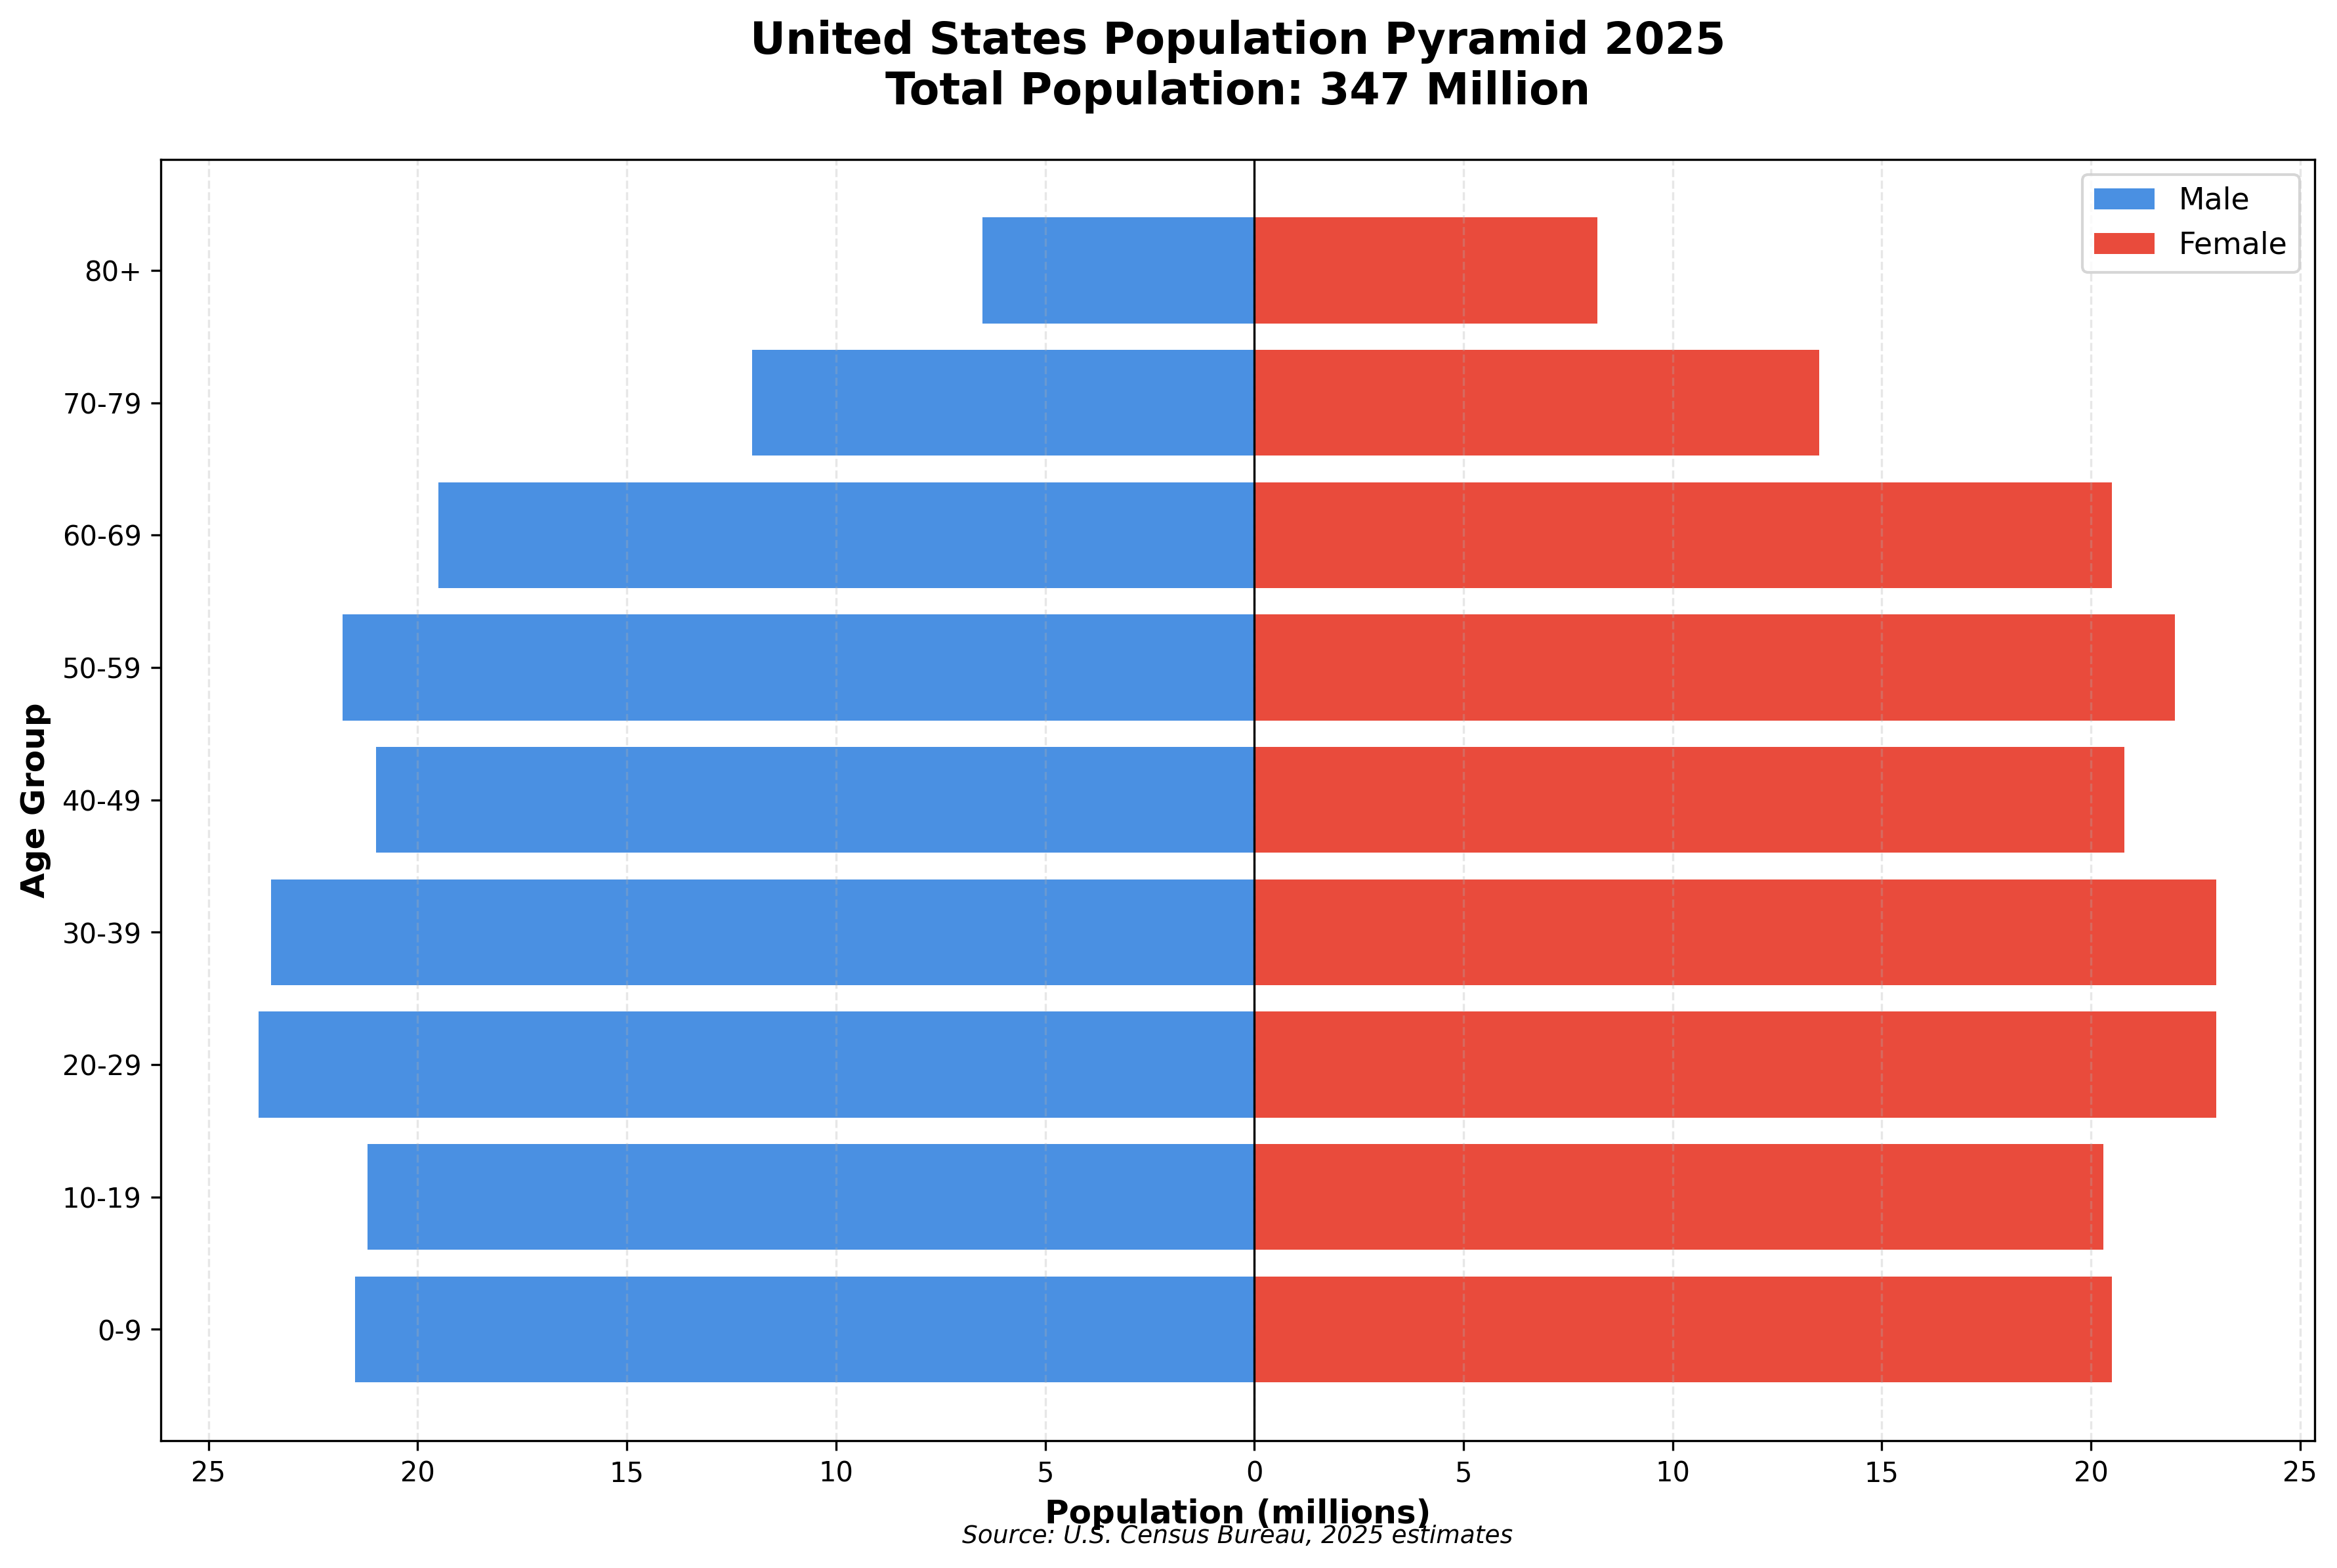
U.S. Population Structure (2025) — Total Population: 347 Million. Source: U.S. Census Bureau
Key Observations from the 2025 Population Pyramid
Document Links
demographics-us.xlsx — Source data: first-time homebuyer age (NAR), mean age of first-time mother (CDC), U.S. total fertility rate (CDC/World Bank)
Context & Discussion
Millennials (born 1981–1996): Delayed family formation and increased multifamily rental demand
The median age of first-time homebuyers in the United States rose from 30 in 2008 to 40 in 2025, according to the National Association of Realtors' annual Profile of Home Buyers and Sellers.[2] This ten-year shift has affected the largest generation in U.S. history: approximately 72 million Millennials, of whom roughly 46 million are currently in the 30–39 age range that historically represented the core first-time homebuyer cohort. The result is an estimated 19 million additional rental apartment units of demand beyond what would have existed if homebuying patterns had remained at 2008 levels.[1]
Several factors drove this shift. The Global Financial Crisis of 2008–2009 created an extremely challenging labor market for young adults entering the workforce, producing a large cohort of "boomerang kids" who returned to live with parents. Student debt loads — averaging approximately $37,000 per borrower as of 2024[3] — reduced the savings capacity of young households and delayed mortgage qualification. Tighter post-GFC mortgage underwriting standards raised the bar for loan approval. And perhaps most importantly, median home prices surged approximately 101% from their 2009 cyclical low ($216,000) to the 2022 peak ($433,000), far outpacing wage growth over the same period (see U.S. Home Affordability Crisis).[4]
Delayed family formation reinforced the cycle: the mean age of first-time mothers rose from 25.0 years in 2007 to 27.5 in 2023 (CDC). Couples who delay children tend to delay homebuying further, extending their tenure in rental apartments. For CRE investors, the key question is not whether Millennials will eventually buy homes — most will — but how many years of incremental rental demand remain before this cohort transitions. With the oldest Millennials now 44 and the youngest 29, the multifamily demand tailwind from this generation likely extends at least another 5–10 years, while Gen Z (see below) begins entering the same pipeline behind them.
Baby Boomers (born 1946–1964): Approaching peak senior housing demand
The Baby Boomer generation — approximately 70 million people still living — is entering the age range that drives senior housing demand. The oldest Boomers turned 79 in 2025; the youngest will turn 61. Over the next decade, the U.S. population aged 75 and older is projected to grow from 26 million to 37 million, an increase of approximately 42%. Industry estimates suggest the country will need 5+ million additional senior housing units by 2035, spanning independent living, assisted living, memory care, and skilled nursing facilities.[5]
The investment implications of the aging Boomer generation extend beyond senior facilities and include medical office buildings, outpatient healthcare facilities, and the single-family homes Boomers will eventually vacate, which will re-enter the housing supply and may moderate home price growth in some suburban markets over the longer term.
Gen X (born 1965–1980) and Gen Z (born 1997–2012): Smaller replacement generations for Boomers and Millennials
Gen X, at approximately 65 million people, is roughly 10% smaller than the Boomer generation it is replacing in the workforce and in peak-earning consumer roles. This matters for CRE because peak-earning years (roughly ages 45–60) are when consumers spend the most on housing, retail goods, and services. The smaller size of Gen X means slightly less aggregate demand in these categories compared to what Boomers generated at the same life stage — a headwind that is partially offset by higher per-capita income growth and dual-income household prevalence.
Gen Z, at approximately 69 million people, is about 4% smaller than the Millennial generation. While this gap is narrower than the Boomer-to-Gen X transition, it still implies modestly lower baseline demand for rental apartments, entry-level homes, and early-career urban services as Gen Z moves through its 20s and 30s over the next decade. However, Gen Z is also entering the rental market in an environment of even higher home prices and interest rates than Millennials faced, which could push their homebuying age even later and extend the multifamily rental demand cycle further. The net effect: slightly fewer people, but potentially longer rental durations per person.
Immigration and fertility: Shaping the future of U.S. demographics
The U.S. total fertility rate (TFR) — the average number of children a woman is expected to have over her lifetime — fell to 1.6 births per woman in 2024, continuing a decline from a recent peak of 2.12 in 2007. The replacement-level TFR (the rate at which a population replaces itself without immigration) is 2.1. At current fertility rates, each generation of native-born Americans is approximately 24% smaller than the one before it.
Immigration has been the primary driver of U.S. population growth in recent years, but the pace has shifted rapidly. Net international migration reached 2.7 million in 2024, accounting for 84% of the nation’s 3.2 million-person population increase that year — the fastest annual growth rate since 2001. However, Census Bureau estimates released in January 2026 show net international migration fell to 1.3 million in the year ending July 2025, a decline of 54%. Overall U.S. population growth slowed to just 0.5% (1.8 million people), the lowest rate since the early pandemic period. The Census Bureau projects net immigration could fall further to approximately 321,000 by mid-2026 if current trends continue.[6]
The U.S. fertility decline, while significant, is moderate compared to many other developed economies. South Korea’s TFR fell to 0.72 in 2023 — the lowest ever recorded for a major economy. China’s TFR dropped to approximately 1.0 following decades of the one-child policy. Japan (1.2), Italy (1.2), and Greece (1.3) face similar or worse trajectories. These extreme low-fertility environments are already creating severe labor shortages, collapsing housing demand in non-urban areas, and forcing massive government intervention — dynamics explored in detail in the next tile, Global Demographics & Economic Competitiveness.
Notes
[1] Estimated additional rental demand from delayed homebuying. Methodology: U.S. population aged 30–39 (~46 million, representing the cohort that historically would have achieved homeownership by age 30 but now rents until approximately age 40). Subtract 20% for individuals living with parents or in other non-rental arrangements. Divide by 1.9 average occupants per rental unit (National Multifamily Housing Council, 2021). Calculation: 46M × 0.80 ÷ 1.9 ≈ 19.4 million units. This is a simplified point-in-time snapshot of the additional rental demand created by delayed homeownership; actual demand is a flowing pipeline as cohorts age in and out of the affected range. ↩
[2] National Association of Realtors, Profile of Home Buyers and Sellers (2025 edition). NAR data is based on an annual mail survey (~6,100 respondents in 2025). Note: Alternative data sources including the New York Federal Reserve and the Federal Housing Finance Agency (FHFA) show median first-time homebuyer age of approximately 32–33 in 2024–2025. The discrepancy likely reflects methodological differences in sampling and definition of "first-time buyer." CRE42 reports the NAR figure as the most widely cited industry benchmark while noting this range. ↩
[3] Federal Reserve Bank of New York / Education Data Initiative. Average student loan debt per borrower, as of Q4 2024. Total outstanding U.S. student loan debt: approximately $1.77 trillion across ~43.2 million borrowers. ↩
[4] FRED series MSPUS — Median Sales Price of Houses Sold for the United States. Source: U.S. Census Bureau and U.S. Department of Housing and Urban Development. Annual values represent the average of four quarterly observations, rounded to the nearest $1,000. 2009 annual: $215,650; 2022 annual: $432,950. See U.S. Home Affordability Crisis for full analysis. ↩
[5] The 5+ million unit estimate for additional senior housing demand by 2035 is derived from industry sources including the National Investment Center for Seniors Housing & Care (NIC), American Seniors Housing Association (ASHA), and demographic projections from the U.S. Census Bureau. This figure encompasses independent living, assisted living, memory care, and skilled nursing facilities. The 75+ population projection (26 million to 37 million by 2035) is from Census Bureau population estimates and projections. ↩
[6] U.S. Census Bureau, Vintage 2025 Population Estimates (released January 27, 2026). Net international migration: 2.7 million (year ending July 2024), 1.3 million (year ending July 2025). The 321,000 projection for mid-2026 is from Census Bureau trend extrapolation. Congressional Budget Office immigration projections provide supplementary long-term estimates. ↩
Methodology & Data Notes
Population Data
Population figures are from the U.S. Census Bureau, 2025 estimates. Total population: 347 million. Generational cohort sizes are approximate and vary by source depending on exact birth-year cutoffs used. This tile uses the following standard definitions: Baby Boomers (1946–1964), Gen X (1965–1980), Millennials (1981–1996), Gen Z (1997–2012).
Homebuyer Age Data
First-time homebuyer age data is from the National Association of Realtors' annual Profile of Home Buyers and Sellers, which has tracked this metric since 1981. The NAR survey is mail-based (~6,100 respondents in 2025) and self-reported. Alternative sources (NY Fed Consumer Credit Panel, FHFA) report lower figures (median ~32–33 in 2024–2025), likely due to different sampling methodologies and definitions of "first-time buyer." See demographics-us.xlsx, "Homebuyer Age" tab.
Fertility Rate
Total fertility rate (TFR) data is from the CDC National Center for Health Statistics and the World Bank. TFR represents the average number of children a woman would have over her lifetime if current age-specific fertility rates remained constant. The replacement-level TFR is 2.1 for developed countries. See demographics-us.xlsx, "Fertility Rate" tab.
Immigration
Net immigration figures are from U.S. Census Bureau Vintage 2025 Population Estimates (released January 27, 2026) and Congressional Budget Office projections. Net international migration dropped from 2.7 million (year ending July 2024) to 1.3 million (year ending July 2025), a decline of 54%. The Census Bureau projects a further decline to approximately 321,000 by mid-2026 if current trends continue. Immigration levels are subject to significant policy-driven variation; historical averages over the prior decade were approximately 1.0 million annually.
Senior Housing Demand
The 5+ million unit estimate for additional senior housing demand by 2035 is derived from industry sources including the National Investment Center for Seniors Housing & Care (NIC), American Seniors Housing Association (ASHA), and demographic projections from the Census Bureau. This figure encompasses independent living, assisted living, memory care, and skilled nursing facilities.
Sources
1. U.S. Census Bureau. Population estimates and projections (2025); Vintage 2025 Population Estimates (released January 27, 2026). census.gov
2. National Association of Realtors. Profile of Home Buyers and Sellers (2025 edition). nar.realtor
3. CDC National Center for Health Statistics. National Vital Statistics System; Trends in Mean Age of Mothers in the United States, 2016 to 2023 (June 2025). cdc.gov/nchs
4. Federal Reserve Bank of New York. Quarterly Report on Household Debt and Credit (Q4 2024). Student loan debt per borrower data. newyorkfed.org
5. National Multifamily Housing Council. Research Notes Newsletter (September 2021). Average occupants per rental unit: 1.9.
6. U.S. Bureau of Labor Statistics. Employment and wage data. bls.gov
7. Federal Reserve Bank of St. Louis (FRED). Median home price, unemployment rate, historical economic data. fred.stlouisfed.org
8. PopulationPyramid.net. Visual population structure data. populationpyramid.net
9. World Bank. International fertility rate comparisons. data.worldbank.org
10. Congressional Budget Office. Immigration projections and labor force estimates. cbo.gov
11. National Investment Center for Seniors Housing & Care (NIC). Senior housing demand and supply data. nic.org
12. American Seniors Housing Association (ASHA). Senior housing industry research. seniorshousing.org