Post-GFC Price Surge Creates Structural Rental Demand
Overview: The post-Great Financial Crisis economic environment has created a sustained affordability crisis for younger potential first-time homebuyers. While unemployment recovered from its 9.6% peak (2010) to near-full-employment levels (4.4% in 2025), median home prices surged ~101% from their 2009 bottom ($216,000) to the 2022 peak ($433,000). Even with current price moderation to ~$414,000, homes remain ~92% above 2009 levels while wages have not kept pace, rendering homeownership difficult or impossible for the median household.
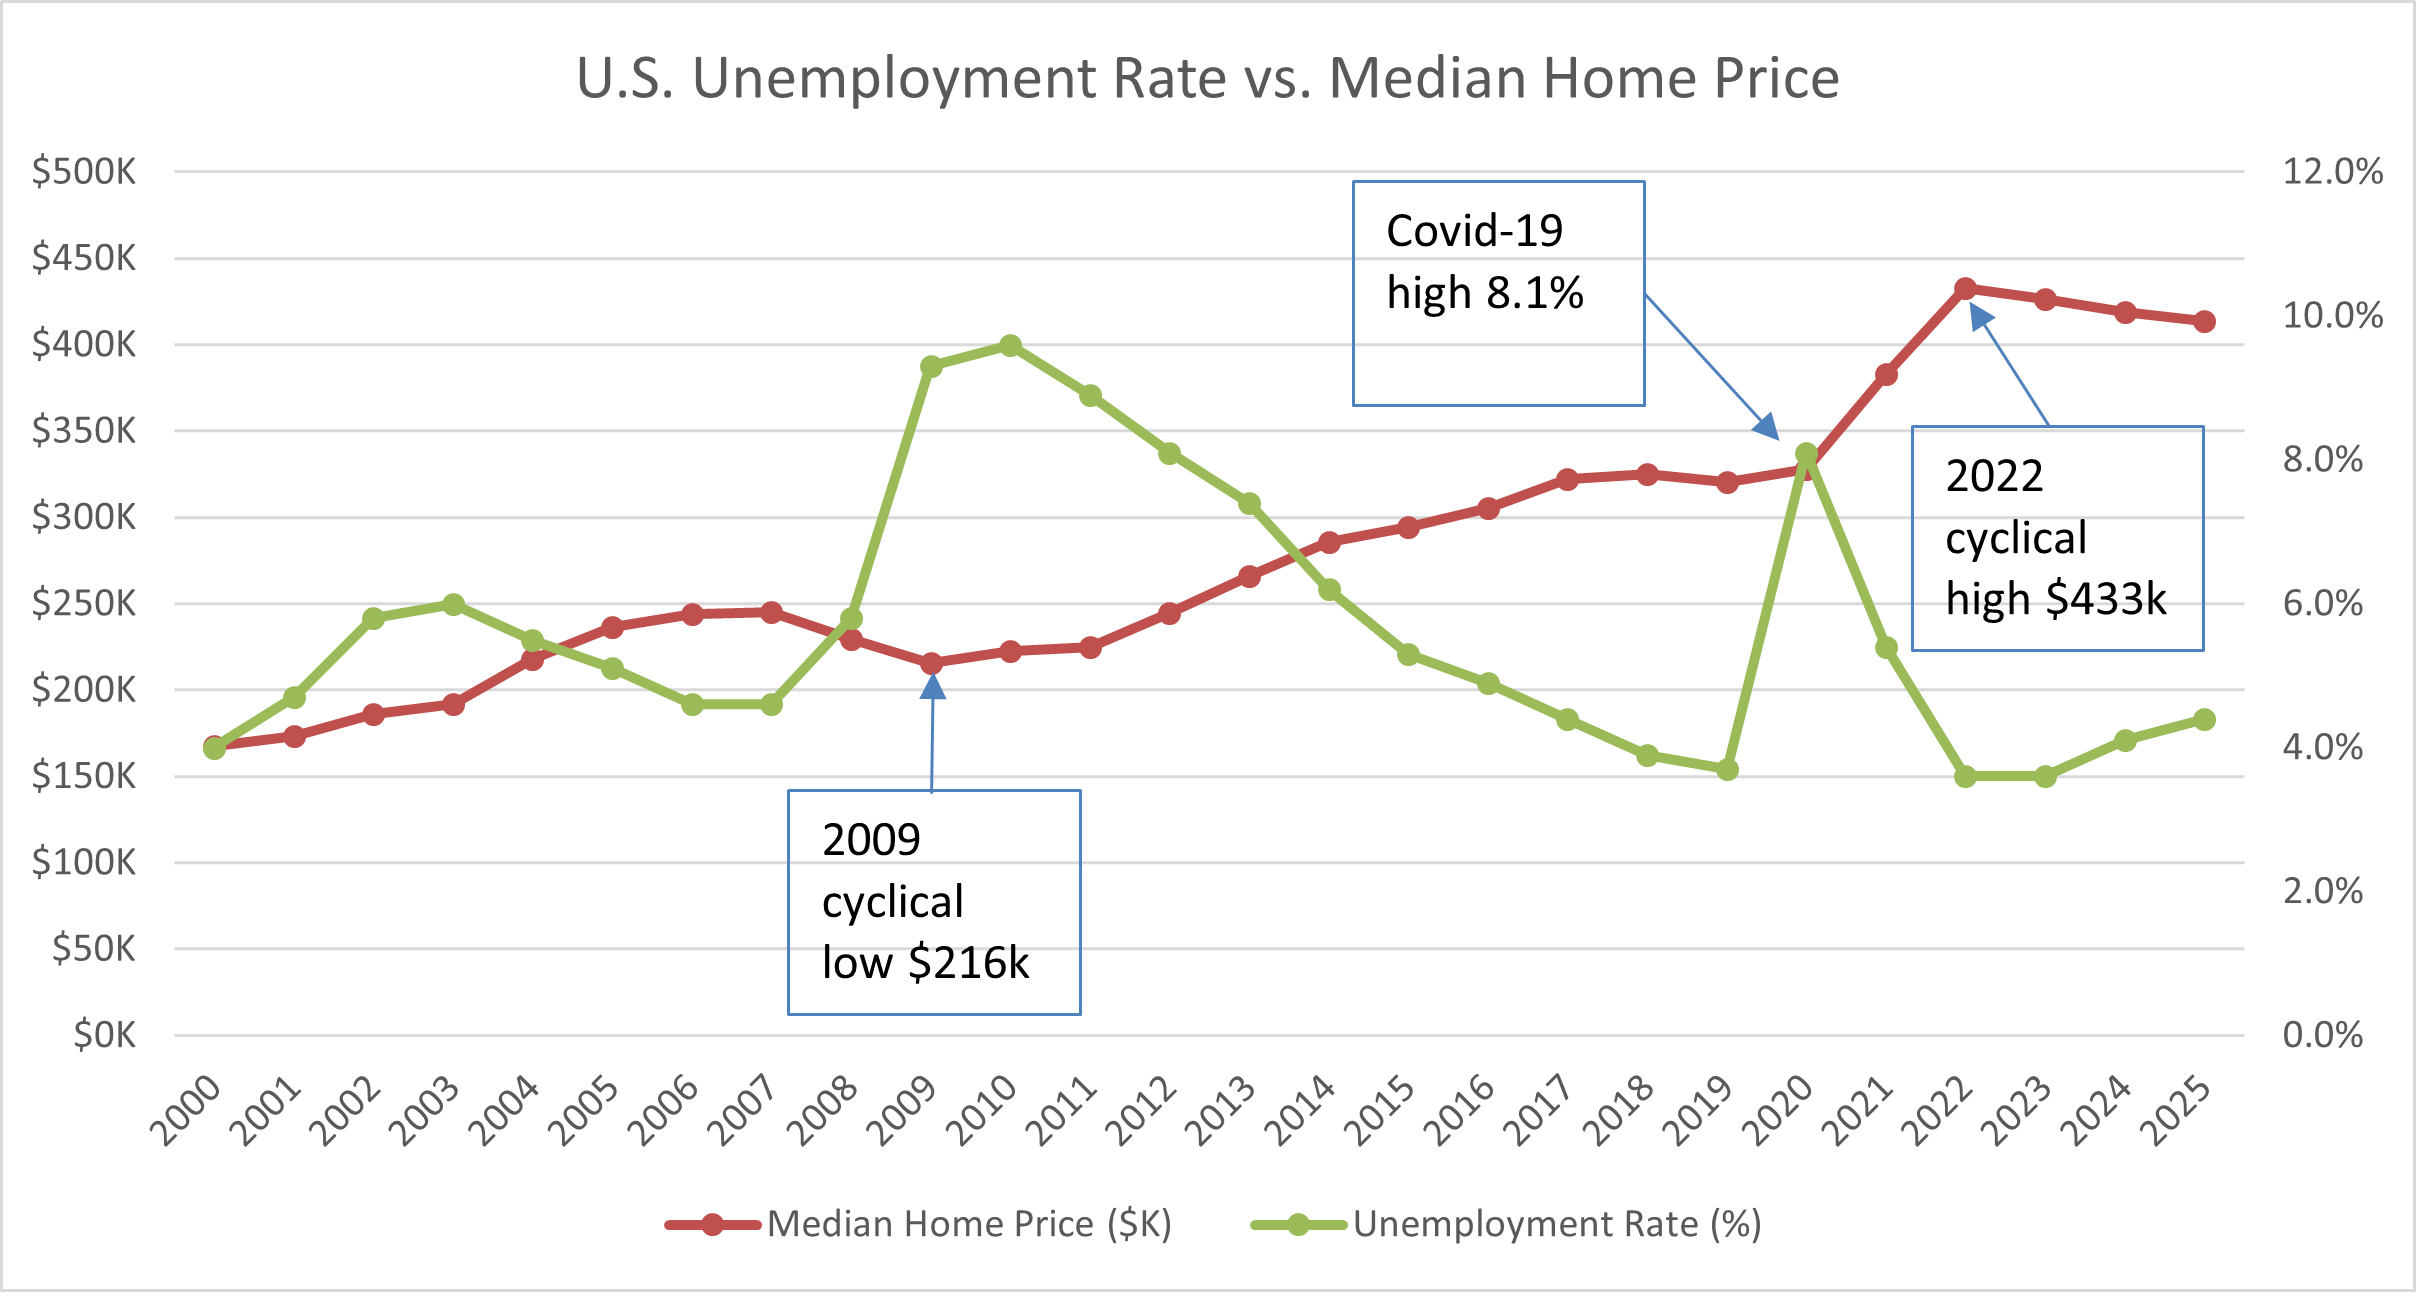
U.S. Unemployment Rate vs. Median Home Price (2000–2025)
Chart: Median Home Price vs. Median Household Income (2000–2024)
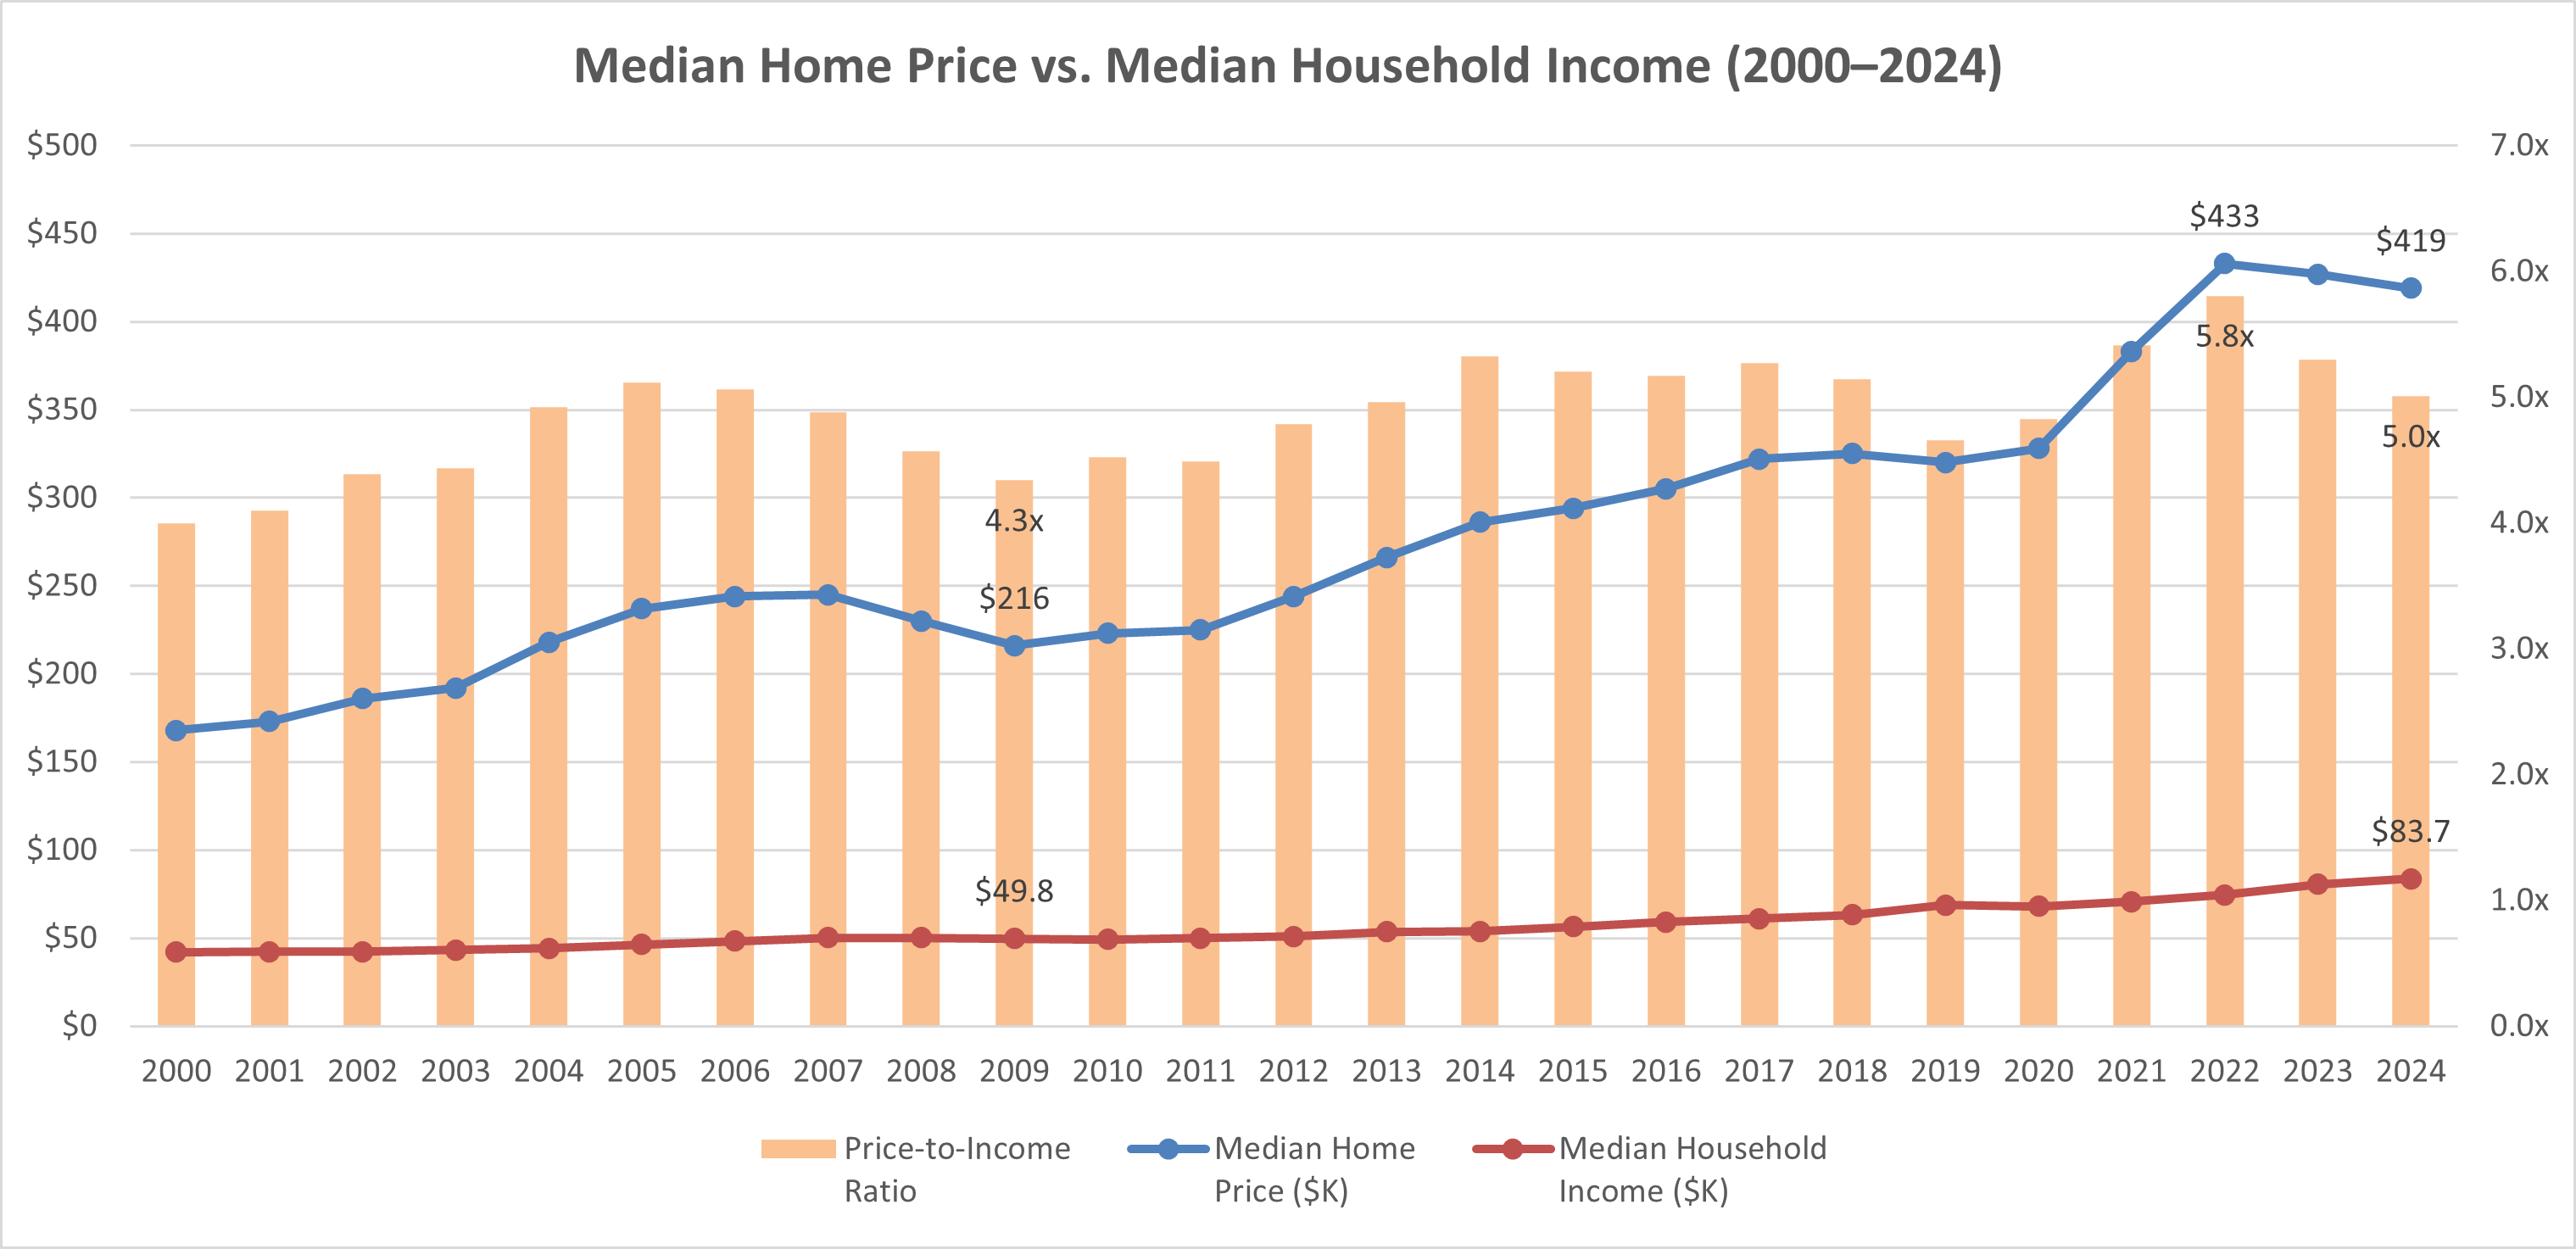
Median Home Price vs. Median Household Income (2000–2024) | Sources: FRED MSPUS (Census/HUD), FRED MEHOINUSA646N (Census Bureau CPS ASEC) | Chart: CRE42
Document Links
multifamily-home-affordability.xlsx — FRED home price data, unemployment rates, median household income, price-to-income ratios, Redfin affordability analysis, rent-vs-buy gap, embedded charts
Key Observations
Context & Discussion
Labor Market Collapse (2008–2012)
Unemployment peaked at 9.6% (2010) — the highest rate since 1983. Companies slashed payrolls, froze hiring, and eliminated entry-level positions. Millennials who graduated college between 2008–2012 entered the worst job market in generations, with many experiencing what economists call “labor market scarring” — a permanent reduction in lifetime earnings estimated at 10–15%. The “boomerang kids” phenomenon emerged as young adults moved back with parents, unable to form independent households or save for down payments. Student loan payments began while income prospects dimmed, delaying household formation by 3–5 years for millions. See Delayed Family Formation Impact on Housing Demand for detailed analysis of these long-term demographic effects.
Home Price Explosion (2009–2022)
From the 2009 price bottom ($216,000) to the 2022 peak ($433,000), median home prices increased ~101% in just 13 years. During this same period, cumulative wage growth was approximately 30%, creating an unprecedented affordability gap. Multiple factors drove this surge: (1) New construction collapsed post-GFC and never recovered to pre-2008 levels, creating a 3–5 million unit housing deficit (see Quantifying the U.S. Structural Housing Shortage); (2) Institutional investors purchased thousands of single-family homes as rentals; (3) Federal Reserve kept interest rates near zero from 2009–2021, increasing buying power for those with access to credit; (4) NIMBYism and restrictive zoning prevented supply response in high-demand metros; and (5) Remote work during COVID triggered bidding wars for suburban homes with space. By the time millennials recovered from the GFC job market (~2015–2016), paid down student debt, and reached traditional homebuying age (late 20s/early 30s), homes were 50–100% more expensive than when they graduated college.
Current U.S. Housing Market
Despite unemployment recovering to 4.4% (essentially full employment) and home prices moderating from the 2022 peak, the fundamental affordability equation remains challenging. With median household income around $84,000 and median home price at $414,000, the price-to-income ratio stands at 5.0x versus the historically sustainable 3.5–4.0x. A 20% down payment ($83,000) would take the median household 7–10 years to save. Monthly payments (20% down, 6.7% mortgage rate) total approximately $2,800–3,200 including taxes and insurance, requiring household income of $110,000–$120,000 to meet the 28% housing cost ratio standard. The median household cannot afford the median home, even with full employment. This is not a temporary displacement but a fundamental restructuring of the housing ladder’s first rung.
Affordability Trend: Improving but Still Challenging
The price-to-income ratio has improved meaningfully since its 2022 peak of 5.8x, declining roughly 14% to 5.0x by 2024. Two factors are driving this: median household income surged from $74,600 to $83,700 (a 12% increase in two years, partly reflecting post-pandemic wage catch-up), and home prices moderated slightly from $433,000 to $419,000. Combined with mortgage rates gradually declining from their ~7.8% peak (October 2023) toward ~6.1% by late 2025, these data are consistent with the February 2026 Redfin analysis showing affordability improving in 37 of the 50 largest metros. However, the improvement is highly regional — markets like Austin and Phoenix have seen meaningful corrections, while supply-constrained coastal metros remain largely out of reach. The same dynamic applies to multifamily rental affordability, where new supply deliveries in Sun Belt markets have softened rents while supply-constrained Northeast and West Coast markets continue to see rent growth. The critical forward-looking question is whether these improving trends will sustain: if new construction continues to slow — multifamily starts have already fallen sharply from their 2022 peak — and the structural housing shortage persists, the recent affordability gains could reverse even if incomes continue to grow.
February 2026 Update
As of December 2025, Redfin reports that homebuyers need to earn at least $111,252 per year to afford the median-priced home — down from $115,870 a year earlier and a peak of ~$122,000 in June 2025 — as mortgage rates have declined from ~7.0% to ~6.1% and price growth has slowed. Meanwhile, the income needed to afford the median rental has risen to $76,020 (from $74,464 in 2024), narrowing the buy-to-rent premium from 66% in late 2023 to 46% in late 2025. Affordability is improving in 37 of the 50 most populous metro areas. However, with estimated median household income at approximately $86,000, the typical household still falls roughly $25,000 short of the income required to purchase a home, and 64% of single Americans report struggling to afford either rent or mortgage payments compared to 39% of married couples.
Implication for Multifamily Real Estate
The share of Americans in their 30s who own a home has fallen from approximately 69% in 1980 to under 50% in 2024, according to John Burns Research analysis of Census data.[a] A major driver is the sharp decline in household formation itself: 32.5% of adults aged 18–34 now live with parents or family, up from 22.5% in 1960, meaning these individuals are counted within an existing owner-occupied household rather than as independent renters or buyers.[b] This is why the widely cited household homeownership rate — 65.7% as of Q4 2025, near its long-term average — can be misleading: the denominator has shrunk as fewer young adults form households at all, keeping the household ownership rate stable even as individual ownership among 30-somethings has declined by nearly 20 percentage points over four decades.[c]
Millions of would-be homebuyers remain in the rental demand pool, extending apartment rental periods from the historical 6–8 years to 10–15+ years (see Delayed Family Formation). The first-time buyer share has collapsed to 21% (versus 40% historical norm), meaning 19% fewer people are accessing homeownership — these households represent permanent or semi-permanent rental demand. For multifamily investors, this represents a fundamental market shift with sustained demand tailwinds unprecedented in modern real estate history.
[a] John Burns Research analysis of U.S. Census Bureau CPS microdata on individual homeownership rates by age cohort (1980–2024), as cited by Jay Parsons, JPR Research (2026). ↩
[b] U.S. Census Bureau, 2024 American Community Survey (18–34 living with parents: 32.5%); 1960 figure from Census Bureau decennial data via CPS historical tables. ↩
[c] U.S. Census Bureau, Housing Vacancies and Homeownership Survey (Q4 2025, released February 3, 2026). FRED series RHORUSQ156N. Long-term average (~65.3%) calculated from 1965–2025 quarterly data. ↩
Sources
1. Federal Reserve Bank of St. Louis (FRED). Median Sales Price of Houses Sold for the United States (MSPUS). Source: U.S. Census Bureau and U.S. Department of Housing and Urban Development. fred.stlouisfed.org/series/MSPUS
2. U.S. Bureau of Labor Statistics. Civilian Unemployment Rate (UNRATE). Source: Current Population Survey (Household Survey). fred.stlouisfed.org/series/UNRATE
3. National Association of Realtors. 2025 Profile of Home Buyers and Sellers (November 2025). nar.realtor/research-and-statistics
4. Redfin. Affordability Is Improving: Buyers Must Earn $111,000 to Afford the Median Home (February 11, 2026). redfin.com
5. Redfin. Homebuyers Need to Earn $35K More Than Renters to Afford Housing (February 11, 2026). redfin.com
6. U.S. Census Bureau. American Community Survey — Median Household Income. census.gov
7. Federal Reserve Bank of Atlanta. Wage Growth Tracker. atlantafed.org
8. Federal Reserve Bank of St. Louis (FRED). Median Household Income in the United States (MEHOINUSA646N). Source: U.S. Census Bureau, Current Population Survey ASEC. fred.stlouisfed.org/series/MEHOINUSA646N
9. U.S. Census Bureau. Housing Vacancies and Homeownership (CPS/HVS, Q4 2025). FRED series RHORUSQ156N. fred.stlouisfed.org/series/RHORUSQ156N
10. John Burns Research. Analysis of U.S. Census Bureau CPS microdata on individual homeownership rates by age cohort (1980–2024). As cited by Jay Parsons, JPR Research (2026).
11. U.S. Census Bureau. 2024 American Community Survey — Young adults (18–34) living in parental home. census.gov/programs-surveys/acs
Methodology & Data Notes
Median Home Price
FRED series MSPUS — Median Sales Price of Houses Sold for the United States. Source agency: U.S. Census Bureau and U.S. Department of Housing and Urban Development. Published quarterly; annual values represent the average of four quarterly observations. Coverage: new residential sales (single-family homes). Annual averages are rounded to the nearest $1,000 for chart labels. Last FRED update: February 20, 2026 (2025 annual: $413,650).
Unemployment Rate
FRED series UNRATE — Civilian Unemployment Rate. Source agency: U.S. Bureau of Labor Statistics, Current Population Survey (Household Survey). Published monthly; annual values represent the average of twelve monthly observations.
Note on Series Selection
MSPUS tracks new home sales (Census Bureau / HUD). The NAR existing-home median price is a separate, typically lower series. This page uses the Census/HUD new-home series as published on FRED, consistent with the primary source citation. Redfin data in the February 2026 Update section uses MLS listings data, which covers both new and existing homes.
Redfin Affordability Methodology
Redfin defines “affordable” as a monthly housing payment of no more than 30% of household income. Income calculations assume a 20% down payment (15% in the rent-vs-buy report), prevailing mortgage rates, property taxes, and insurance. Median household income is estimated using Census ACS 2023 base data adjusted with the Atlanta Fed 12-month moving average wage growth tracker. Metro data covers Core-Based Statistical Areas (CBSAs) for the 50 most populous metro areas.
Price-to-Income Ratio
Calculated as median home price (FRED MSPUS, $K) divided by median household income (FRED MEHOINUSA646N, $K). MEHOINUSA646N is published annually by the Census Bureau via the Current Population Survey Annual Social and Economic Supplement (CPS ASEC); the 2024 value ($83,730) was released September 10, 2025. Both series use nominal (current) dollars, so no inflation adjustment is needed for the ratio. Historical benchmark of 3.5–4.0x is based on Federal Reserve and academic research on sustainable housing cost ratios. The 28% housing cost ratio standard referenced on this page is the conventional mortgage underwriting guideline (front-end ratio). Note: MSPUS tracks new home sales only while MEHOINUSA646N covers all household types — the ratio is approximate but directionally accurate and consistent across the full 2000–2024 time series.
Related Topics
Delayed Family Formation Impact on Housing Demand — NAR first-time homebuyer age hits 40; fertility falls to 1.60; wealth transfer bifurcating the housing market; prime rental-age population peaks ~2028
Quantifying the U.S. Structural Housing Shortage — Nine institutional estimates ranging from 1.2M to 8.0M units; methodology comparison and implications
U.S. Demographics and Economic Forces — Millennial delayed homeownership, Boomer senior housing demand, generational sizing, fertility decline
U.S. Senior Living Demand — Baby Boomer demographic wave and its implications for senior housing