Overview: The U.S. has underbuilt housing relative to demand since the Great Financial Crisis, a fact on which nearly all housing analysts agree. But estimates of the actual shortfall range from 1.2 million to 8.0 million units among major non-partisan institutions — a spread that reflects fundamentally different methodologies and definitions of what constitutes a “balanced” housing market. The most commonly cited estimates cluster between 2.5 and 5 million units, representing 1.5–3.5% of the total U.S. housing stock. For commercial real estate investors, the directional conclusion matters more than the precise figure: the U.S. has a structural housing deficit that has persisted for over a decade, is not being resolved by current construction levels, and provides a long-term tailwind for rental demand — particularly in supply-constrained markets.
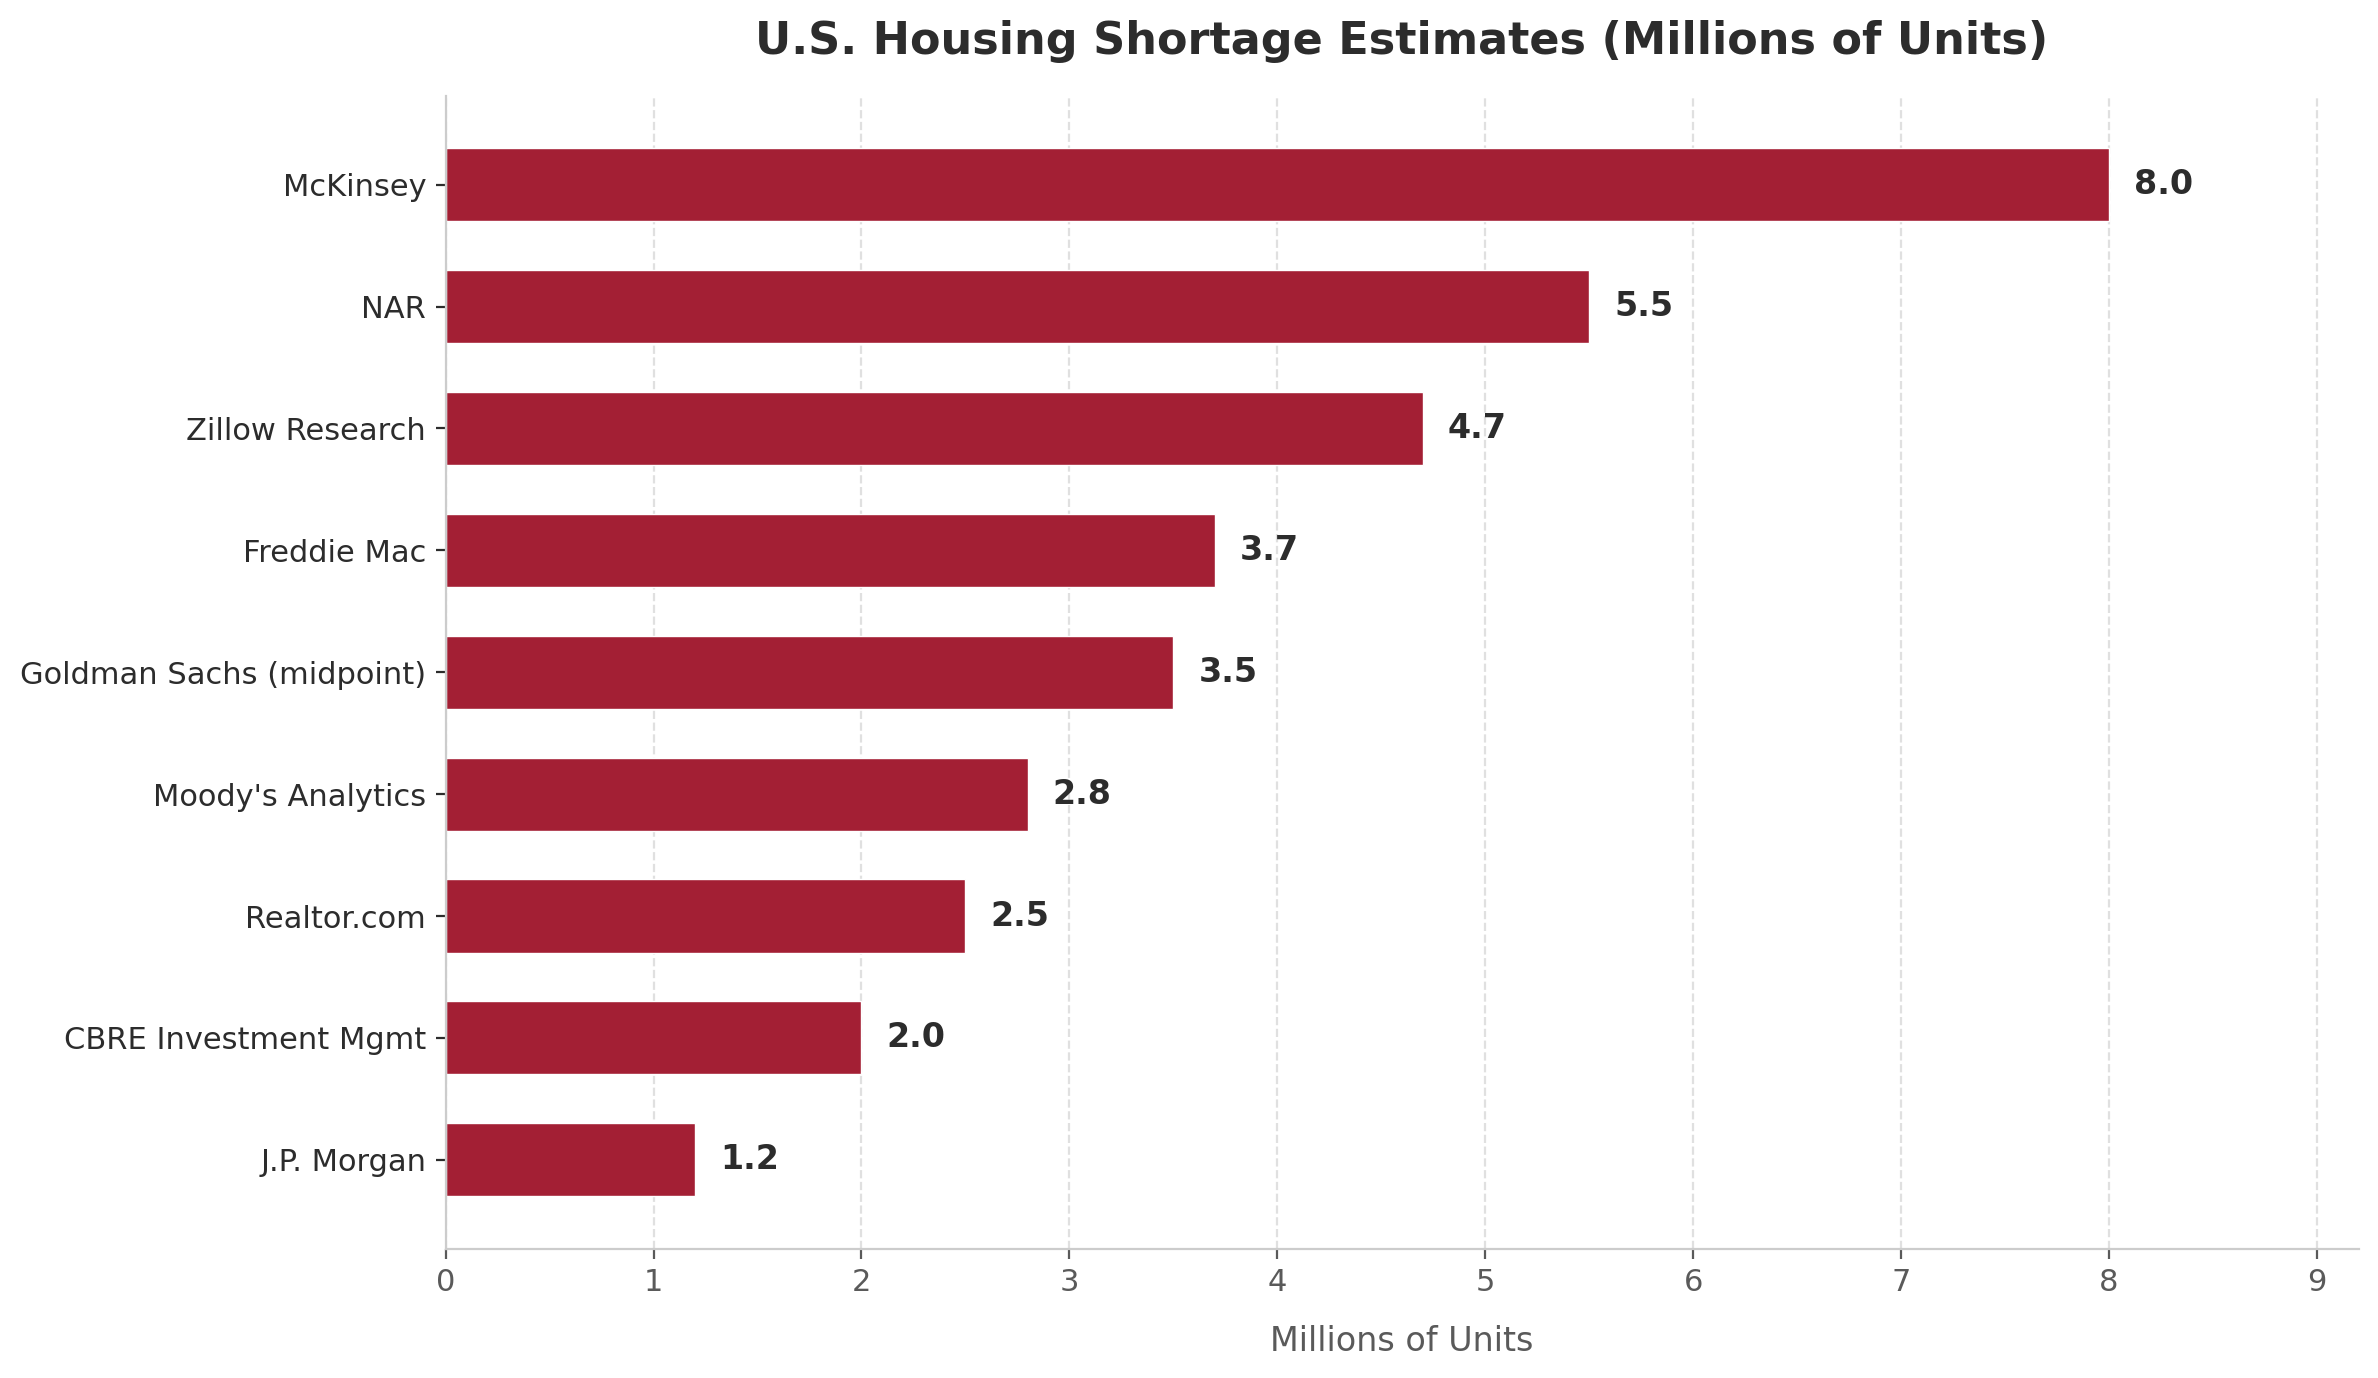
Selected Estimates of U.S. Housing Shortage (Millions of Units) | Sources: See individual citations below | Note: Goldman Sachs range is 3–4M; midpoint shown.
| Organization | Shortage Estimate (Millions) | Year of Estimate |
|---|---|---|
| J.P. Morgan | 1.2 | 2025 |
| CBRE Investment Mgmt | ~2.0 | 2025 |
| Realtor.com | 2.5 | 2024 |
| Moody’s Analytics | 2.8 | 2024 |
| Goldman Sachs (midpoint) | 3.5 | 2025 |
| Freddie Mac | 3.7 | 2024 |
| Zillow Research | 4.7 | 2025 |
| NAR | 5.5 | 2021 |
| McKinsey | ~8.0 | 2024 |
Excluded (noted for context): Brookings (~5M, left-leaning), Congressional Republicans (~20M), Cato Institute (~0, libertarian), NAHB (1.5M, 2021 — stale), McClure & Schwartz (academic, ~0 aggregate shortage). Goldman Sachs range is 3–4M; midpoint shown.
Key Takeaways
Context & Analysis
The GFC Inflection Point
The origin of today’s deficit is not in dispute. Before the financial crisis, the U.S. was producing approximately 1.8 million housing units annually. From 2009 through 2016, completions fell below 1 million every year. Production has recovered since 2017, averaging approximately 1.3 million units annually from 2017–2024, but this pace has been insufficient to close the gap created during the lost decade of construction. The ratio of population growth to housing unit growth, which hovered around 1.5 before the GFC, spiked as high as 5.0 new people per added housing unit by 2011 before gradually normalizing.
Supply Constraints Are Structural, Not Cyclical
Goldman Sachs identifies land use regulations as the primary constraint on U.S. housing supply, noting that height restrictions limit construction to two or three stories on roughly 60% of residential land in the 240 largest metros. The share of vacant, developable land near city centers has declined from over 70% in the 1960s to about 40% today. These are not factors that will resolve with a change in the interest rate cycle. Tariffs on building materials — lumber, steel, copper, cabinets — are adding an estimated $17,500 per new home according to a December 2025 Center for American Progress analysis, which projects 450,000 fewer homes built through 2030 as a result. Potential construction labor shortages from immigration policy changes add further near-term headwinds on top of structural barriers.
Geographic Distribution: Not All Markets Are Short
The shortage is not evenly distributed. Zillow’s metro-level data shows the largest absolute deficits in New York (402,000 units), Los Angeles (339,000), Boston (151,000), San Francisco (140,000), and Washington, DC (132,000). Meanwhile, some Sunbelt markets that built aggressively during the post-pandemic boom — including Austin, Houston, Phoenix, and parts of Florida — currently have elevated vacancy and soft rents, suggesting localized oversupply even within a nationally undersupplied market. This regional divergence is a critical consideration for CRE investment strategy, as national shortage figures can mask significant local variation in both directions.
Why the Estimates Diverge So Widely
Measuring a national housing shortage requires answering a deceptively simple question: how many more units would need to exist for supply and demand to be “balanced”? The answer depends on subjective choices about what vacancy rate is normal, whether people sharing housing by necessity should count as unmet demand, and whether the goal is matching units to households or matching affordable units to incomes.
At the low end, J.P. Morgan focuses on the near-term gap between current supply and observable demand, producing an estimate of 1.2 million — and arguing the shortage has been overemphasized. CBRE Investment Management uses approximately 2 million as a working baseline, modeling 200,000 additional units per year beyond normal demand growth to close the gap over a decade. In the middle range, Goldman Sachs estimates 3–4 million units, identifying land use regulations as the most critical constraint and finding that zoning reform in major metros could add 2.5 million units over the next decade. Freddie Mac’s widely cited figure of 3.7 million compares actual vacancy rates to normalized historical averages. At the high end, Zillow’s “missing homes” methodology yields 4.7 million, capturing 8.1 million families currently doubled up with non-relatives. McKinsey’s estimate of approximately 8 million uses the broadest definition, incorporating housing quality, overcrowding, and cost burden alongside raw unit counts.
Sources
Washington Post, “How big is the U.S. housing shortage?” (February 2026)
Zillow Research, “U.S. Housing Deficit Grew to 4.7 Million” (July 2025) | zillow.com
Goldman Sachs, “The Outlook for U.S. Housing Supply and Affordability” (October 2025) | goldmansachs.com
CBRE Investment Management, “Digging Out of the U.S. Housing Affordability Crisis” (2025) | cbreim.com
Center for American Progress, tariff impact analysis (December 2025)
Congressional Research Service, “Estimates of a Housing Shortage” (2025) | congress.gov
J.P. Morgan Global Research, “The Outlook for the U.S. Housing Market in 2026” | jpmorgan.com
Freddie Mac Housing Research (2024) | freddiemac.com
Moody’s Analytics (2024)
McKinsey Global Institute (2024)
National Association of Realtors (2021)
Realtor.com (2024)
U.S. Census Bureau / American Housing Survey
Federal Reserve Bank of St. Louis (FRED)