
CRE42 Multifamily REIT Composite
Selected Multifamily REITs
The CRE42 multifamily composite blends three public apartment REITs chosen to span the two poles of the US apartment market. AvalonBay Communities (AVB) is the largest of the three, a coastal and gateway landlord and developer concentrated in New England, Metro New York/New Jersey, the Mid-Atlantic, the Pacific Northwest, and Northern and Southern California, with roughly 99,000 apartment homes at year-end 2025. Mid-America Apartment Communities (MAA) is a pure Sun Belt landlord with roughly 103,000 units across Atlanta, Dallas, Tampa, Charlotte, Austin, Nashville, and other southeastern and southwestern metros. Camden Property Trust (CPT) owns roughly 59,000 apartment homes across a different Sun Belt mix, led by Washington DC Metro, Houston, Phoenix, Dallas, and Atlanta. One coastal landlord plus two Sun Belt landlords give the composite exposure to both halves of the post-2021 supply divergence: the record wave of new apartment deliveries landed hardest in the Sun Belt markets MAA and CPT own.
Component Pricing and Scale
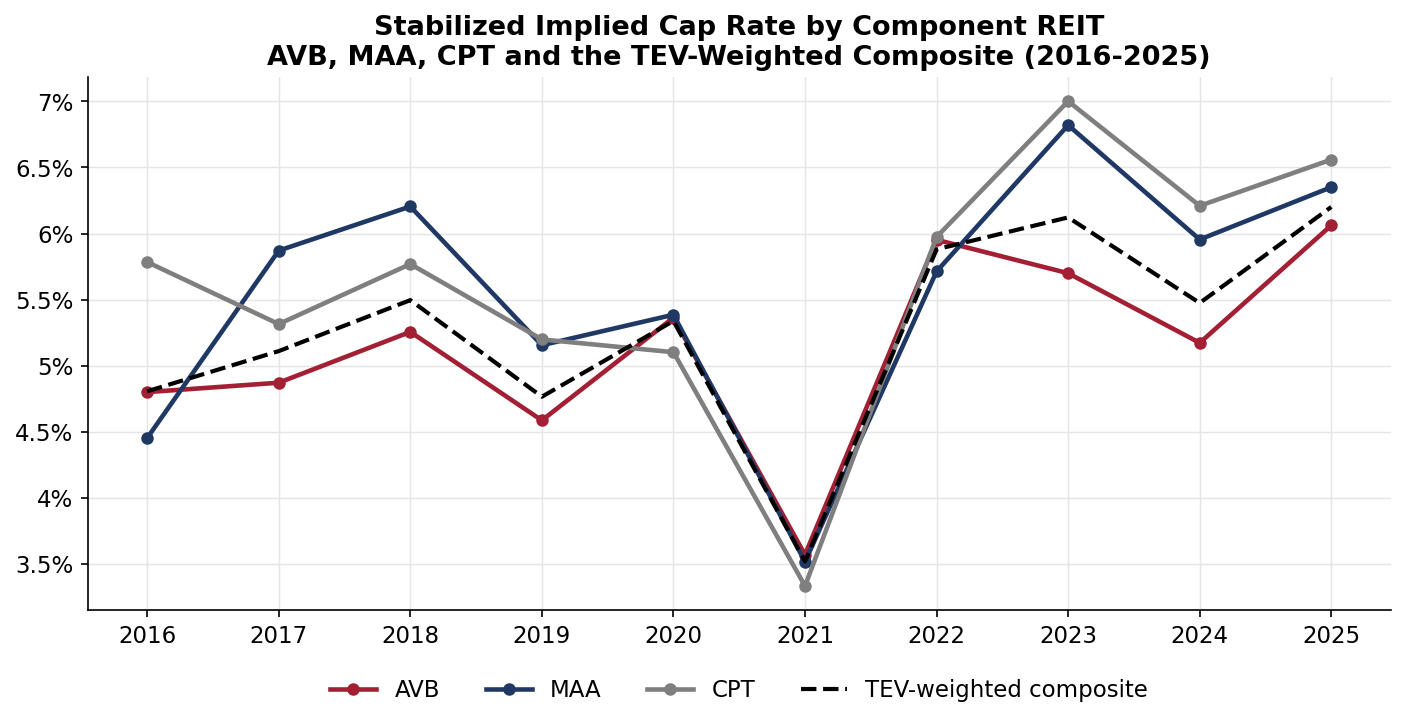
Source: Component FY2016–FY2025 Form 10-K and Q4 supplemental filings; CRE42-derived measures per the companion workbook.
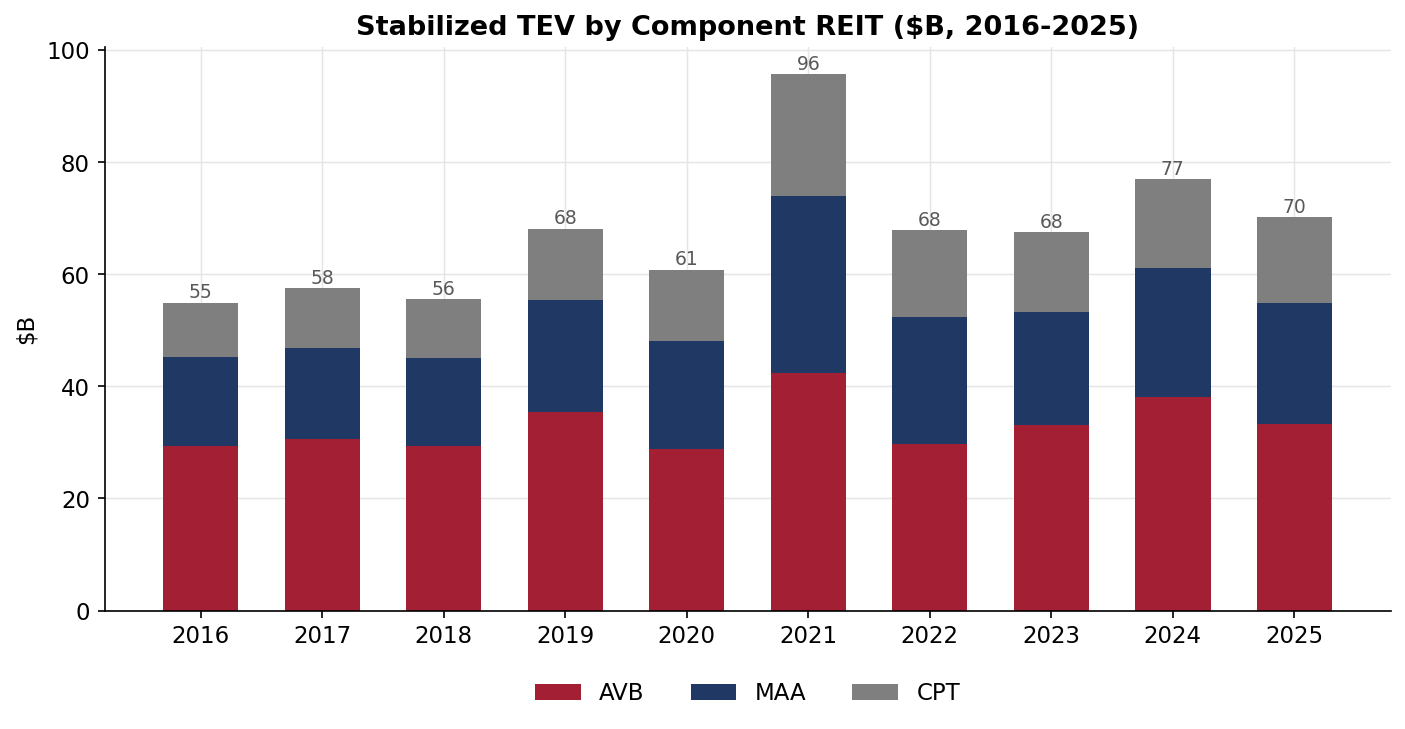
Source: Component FY2016–FY2025 Form 10-K and Q4 supplemental filings; CRE42-derived measures per the companion workbook.
Composite Construction
Every company-sourced figure (NOI, interest, land, development, debt, Core FFO, recurring capital expenditures, cash flow, distributions) is a TEV-weighted average across the three REITs, weighted by each REIT's stabilized TEV for that fiscal year. Calculation columns keep the identical formulas used on the single-company tabs, so the composite reads like a single large apartment REIT. The composite share price is composite market cap divided by composite share count, never a direct average of the three prices. MAA's 8.50% Series I preferred is treated as debt at liquidation value throughout. All figures are aggregate composite, not per share.
Notes
The composite is a synthetic construction; it is not a filing of any single company. Component figures trace to each company's Form 10-K and Q4 earnings release and supplemental for each fiscal year, per the Sources tab of the companion workbook. AVB year-end share prices are not published in its filings and are carried as market-data inputs sourced from AvalonBay investor relations historical data. A regional footprint cross-section (portfolio units by region and market) requires a separate property-table extraction and is not yet built for the multifamily components.
Companion workbook. multifamily-reit-metrics.xlsx – CRE42 multifamily REIT composite annual model (FY2016–FY2025), per-REIT and vs-market tabs, and market comparison data.