Composite Implied Cap Rate vs. 10-Yr UST (2016–2025)
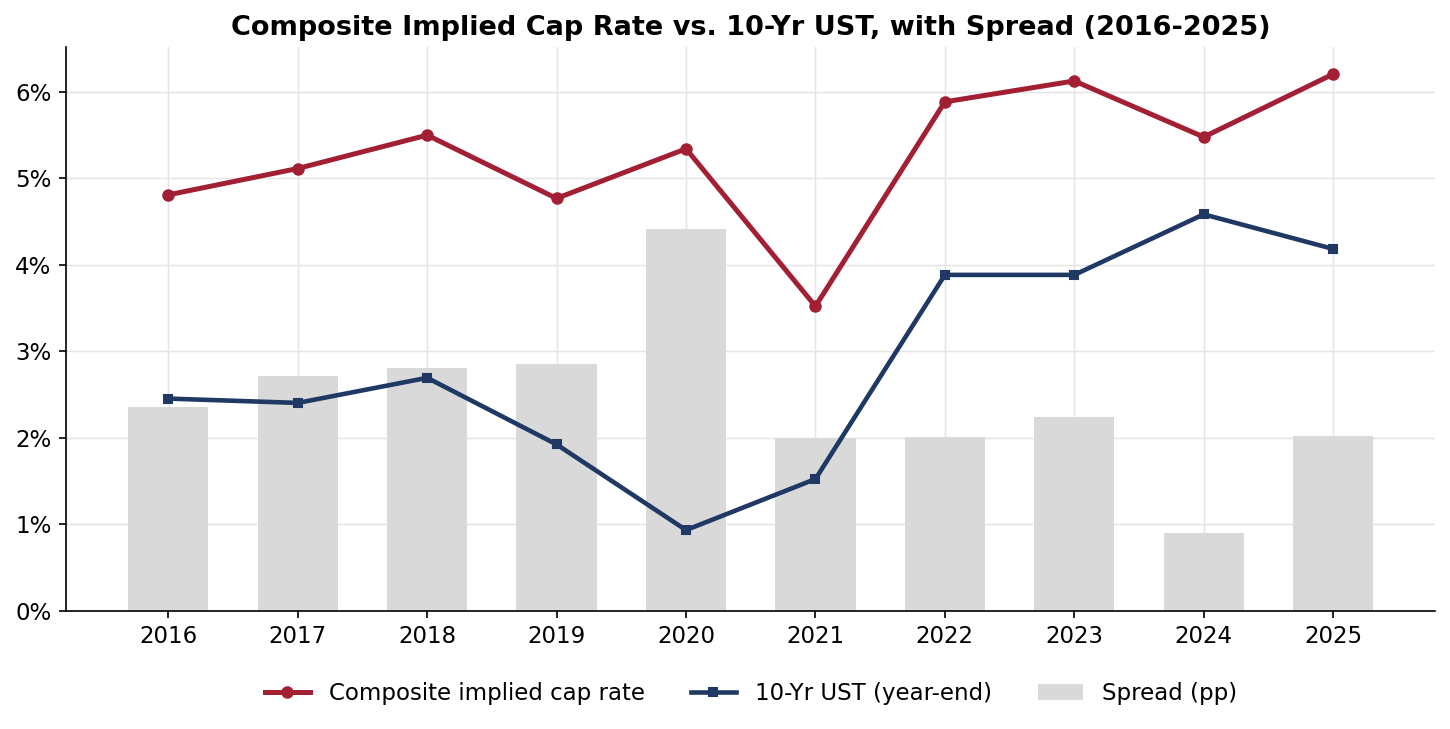
Sources: CRE42 multifamily REIT composite (component filings; CRE42-derived implied cap rate); FRED series DGS10, year-end.
The composite implied cap rate compressed from 4.81% in 2016 to 3.52% in 2021, then reset to 5.88% in 2022 and has widened unevenly since, ending 2025 at 6.20%. Unlike office, multifamily had a genuine compression phase to unwind: the 2021 trough was the lowest implied cap rate in any CRE42 composite.
The spread over Treasuries compressed through the cycle: 2.4 pp in 2016, 2.0 pp at the 2021 trough, and 2.0 pp in 2025, peaking at 4.4 pp in 2020 when the 10-year hit 0.93% and touching just 0.9 pp in 2024.
2025 decoupled from the UST: the 10-year fell from 4.58% at year-end 2024 to 4.18%, while the composite cap rate rose from 5.47% to 6.20%, taking the spread from 0.9 pp back to 2.0 pp. The incremental widening prices the supply wave, not the rate cycle.
Composite Cap Rate vs. Leveraged Equity Yield (2016–2025)
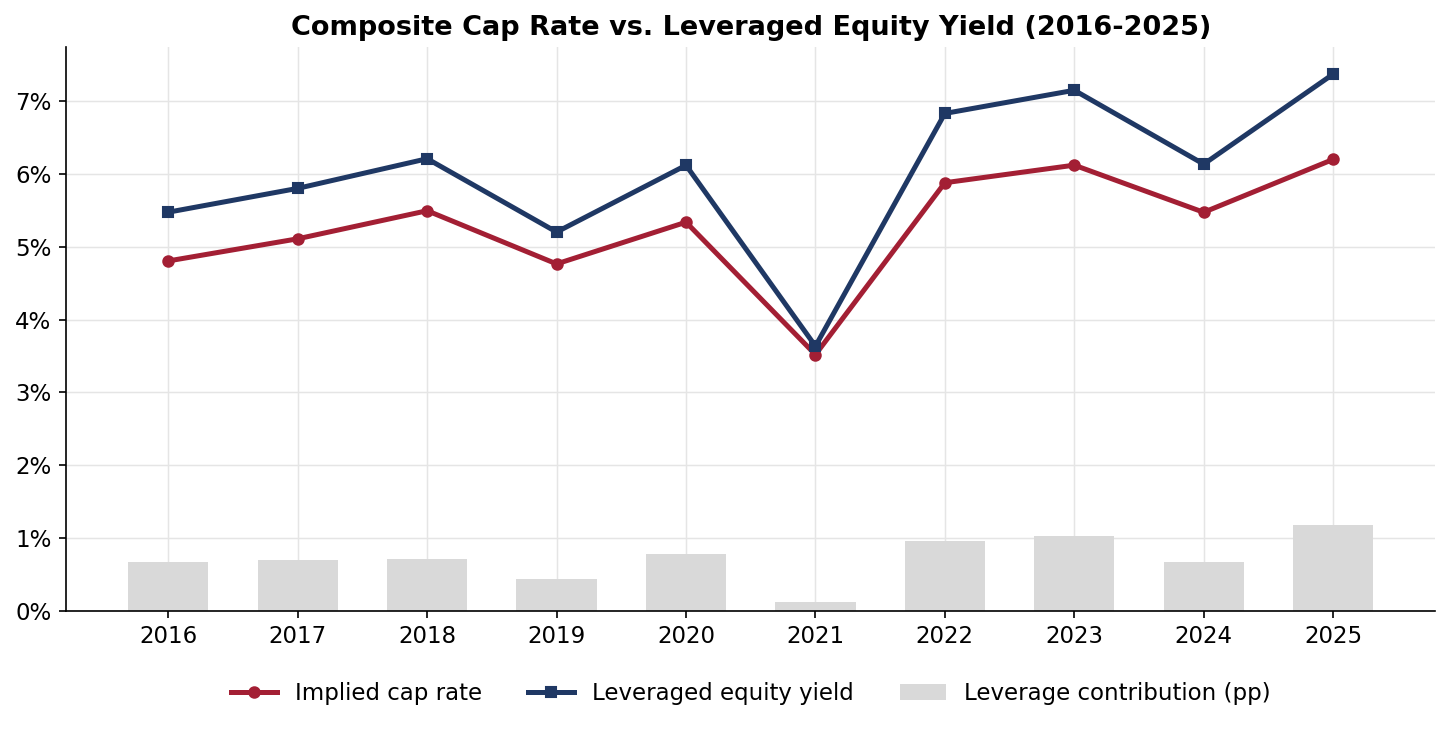
The composite leveraged equity yield fell from 5.5% in 2016 to 3.6% in 2021, then rose to 7.4% by 2025, its highest level of the decade; the largest one-year move was 2022 (3.6% to 6.8%).
Leverage contribution (equity yield less cap rate) ran 0.1 to 1.2 pp across the decade: apartment REITs carry the lowest leverage of the three CRE42 composites, so the equity yield tracks the cap rate closely, in contrast to office's 5.6 pp contribution in 2025.
A 7.4% leveraged yield on stabilized apartment cash flow, against 3.6% four years earlier, is the repricing in one number: the cash flow grew 35% while the equity that owns it was marked down 33%.
Public vs. Private Apartment Cap Rates (2016–2025)
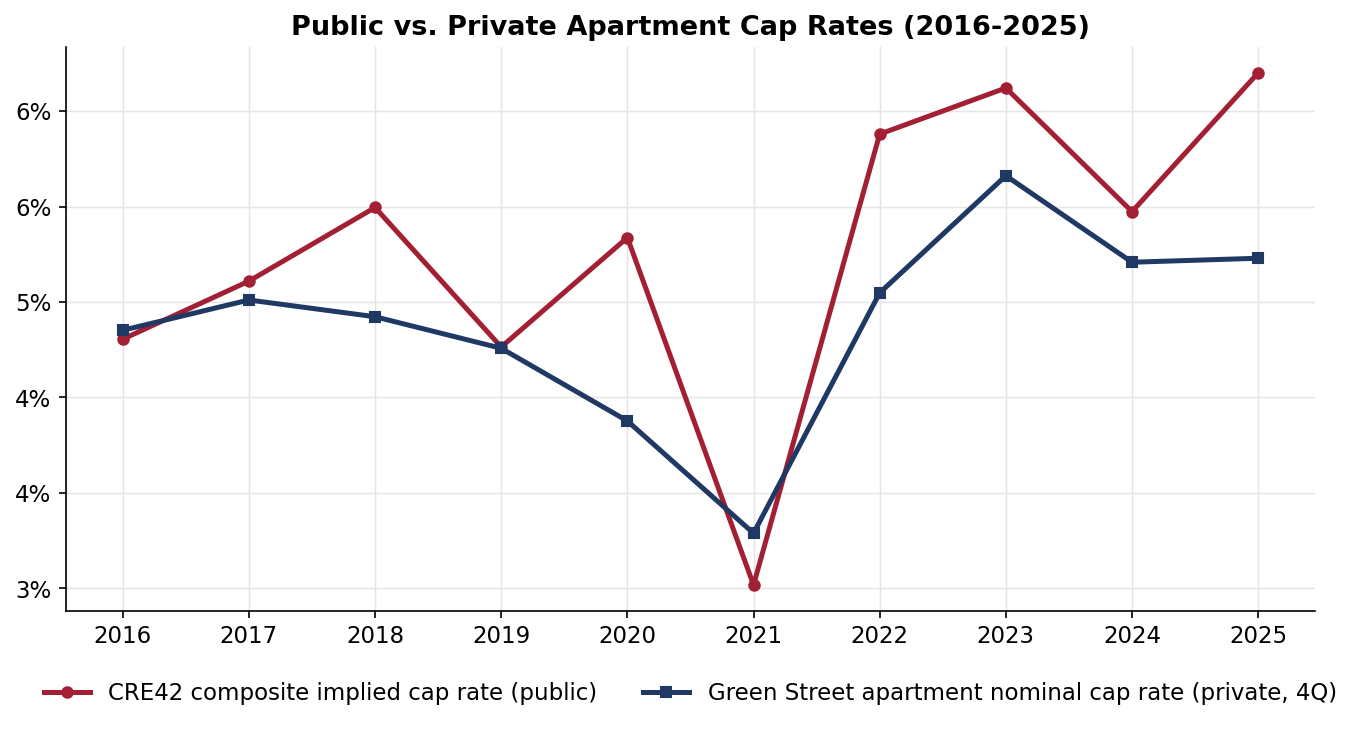
Sources: CRE42 multifamily REIT composite (public); Green Street apartment nominal cap rate, 50-market weighted average, 4Q values, as loaded in the companion workbook (July 2026).
The public composite (6.20% in 2025) prices roughly 100 bp WIDE of the Green Street private-market average (5.23%): the reverse of office, where the public composite prices far inside the private average.
The two series crossed at the 2021 trough (3.52% public against 3.79% private, the one year public priced inside), then split: public pricing reset immediately in 2022 (+240 bp in one year) while the private average widened more slowly, peaked at 5.66% in 2023, and has since re-tightened.
The CRE42 implied cap rate (trailing total NOI over stabilized TEV for the CRE42 multifamily composite portfolio) diverges from Green Street's cap rates (observed institutional transaction cap rates) as public markets currently price apartments meaningfully cheaper than private marks. Public equities often lead multiple expansion and contraction in the private markets, which can take time to come to fruition, in which case transactional cap rates should rise to find equilibrium. But we also know that markets are not always right and may have simply overreacted to negative market signals, in which case REIT values should rise to meet the private market.
Notes
Composite figures are a stabilized-TEV-weighted blend of AvalonBay, Mid-America, and Camden; see the CRE42 Multifamily REIT Composite page and the companion workbook for methodology. Implied cap rate = composite annual NOI / stabilized TEV; leveraged equity yield = leveraged property cash flow / stabilized market cap. Green Street cap rates are proprietary, licensed via MIT CRE.
Companion workbook.multifamily-reit-metrics.xlsx – CRE42 multifamily REIT composite annual model (FY2016–FY2025), per-REIT and vs-market tabs, and market comparison data.