Source: CoStar office national series, as loaded in the companion workbook (verified July 2026).
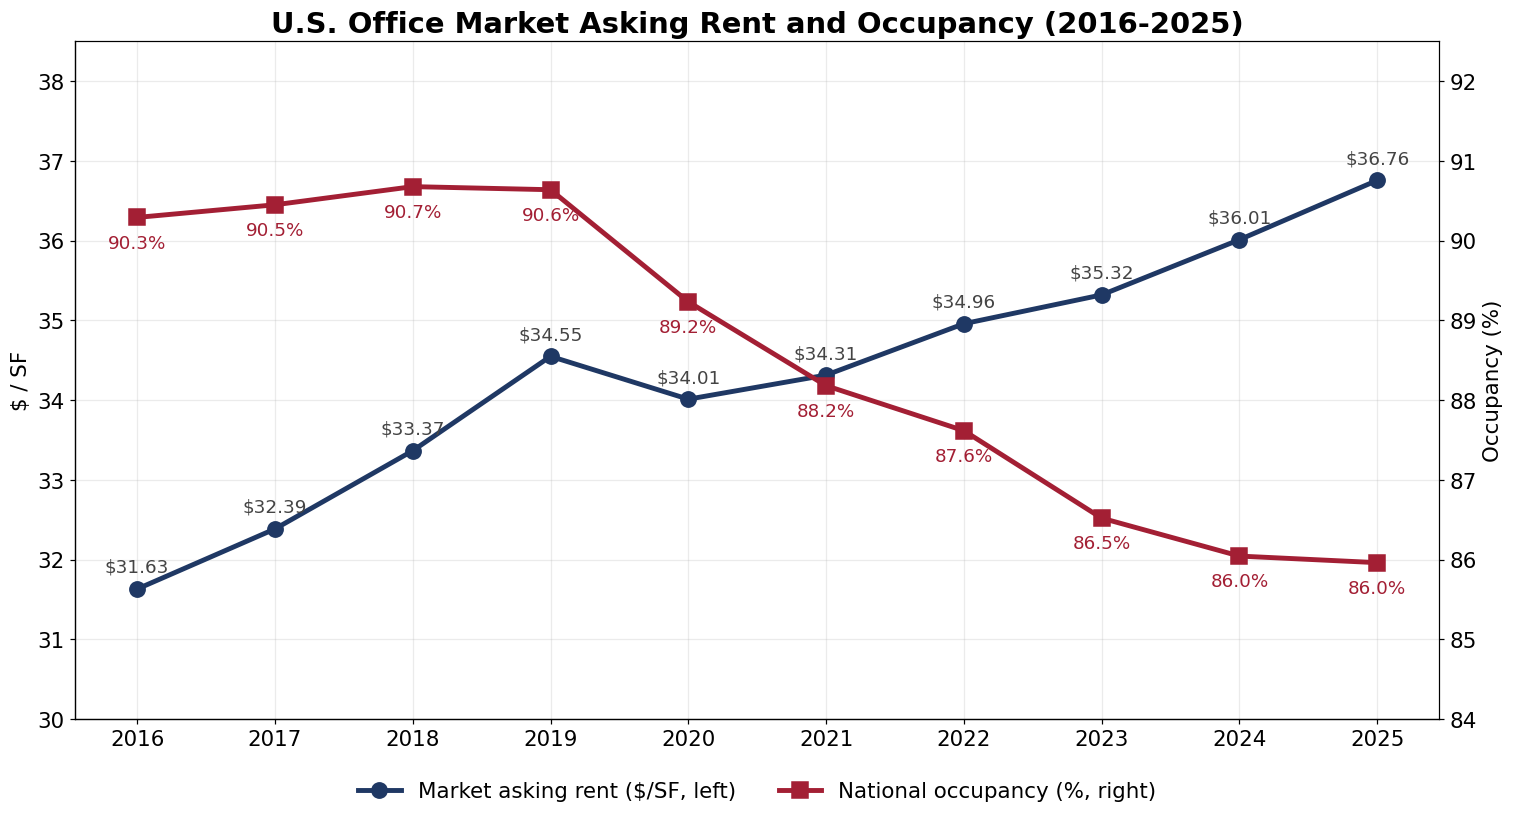
Asking rent rose from $31.63/SF in 2016 to $36.76 in 2025, a 16% increase over a decade in which CPI rose 34%: office rents fell roughly 18 points behind inflation. 2020 was the only negative year (-1.6%).
Occupancy peaked at 90.7% in 2018, held near 90.5% through 2019, then declined every year from 2020 through 2024, reaching 86.0% in 2025: a fall of roughly 470 basis points from peak.
Rent and occupancy tell different stories: nominal asking rents kept grinding higher (concession packages are not captured in asking rent), while the occupancy decline did not pause until 2025, the first year without erosion since 2019.
Rent Growth, Occupancy Change, and Market Revenue (2016–2025)
Sources: CoStar office national series; Green Street office series, as loaded in the companion workbook (verified July 2026).
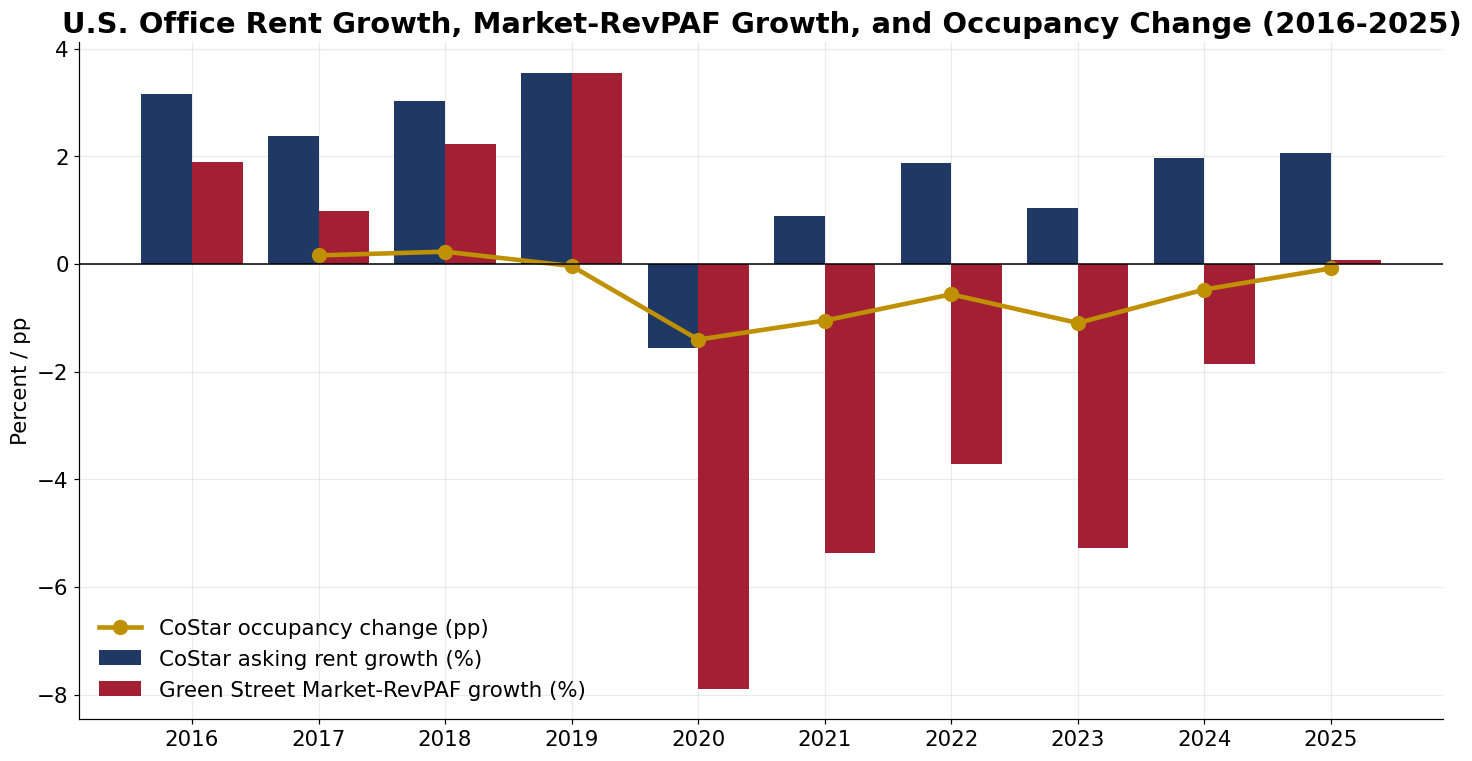
Asking rent growth averaged roughly 3% per year from 2016 through 2019, went negative in 2020 (-1.6%), and has run 1–2% per year since.
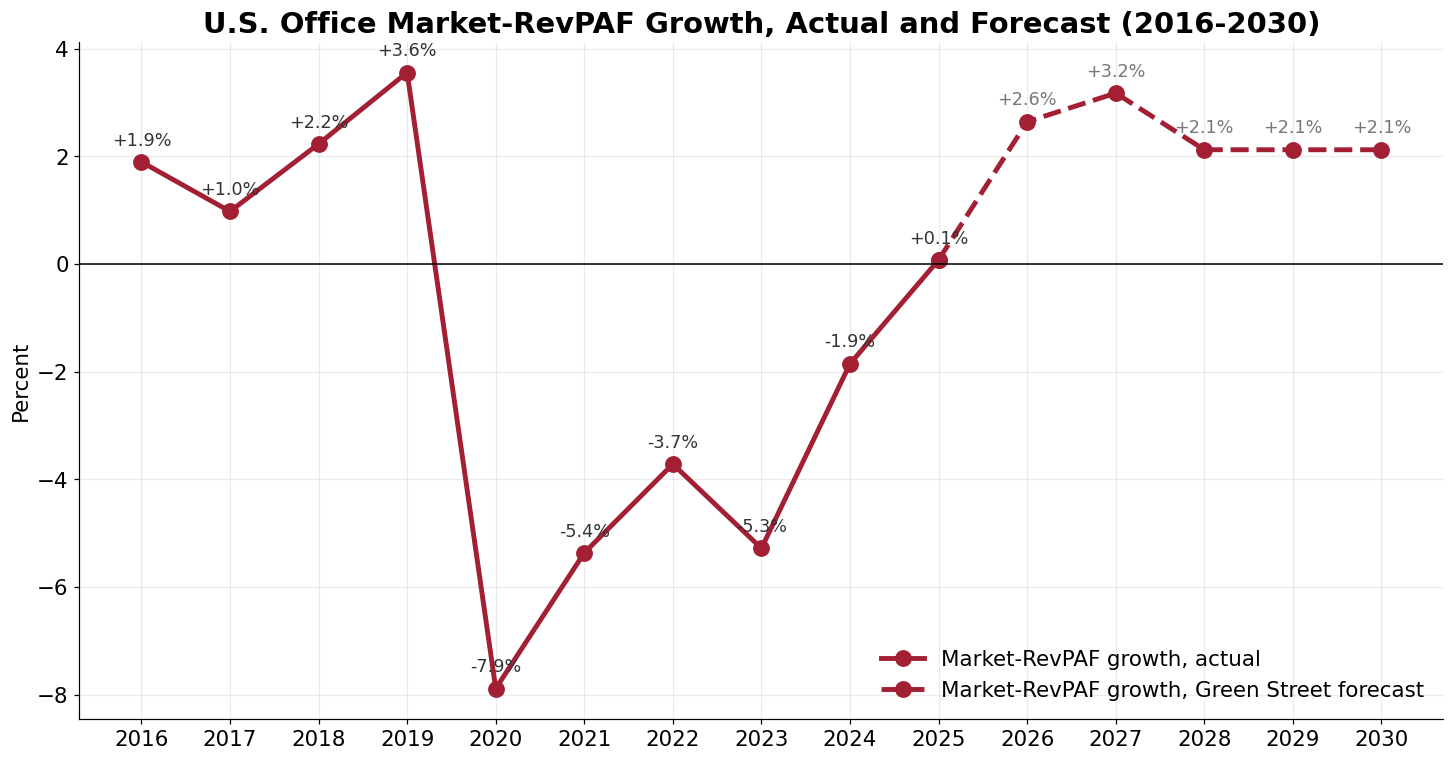
Market-RevPAF growth (rent times occupancy) was negative five consecutive years, 2020 through 2024 (-7.9%, -5.4%, -3.7%, -5.3%, -1.9%), before turning marginally positive (+0.1%) in 2025. Indexed, market revenue fell 22% from its 2019 peak.
Office has had no meaningfully positive market revenue year since 2019; the 2025 figure (+0.1%) is the first non-negative reading in six years.
Supply Growth, Actual and Forecast (2016–2030)
Source: Green Street office series, as loaded in the companion workbook (verified July 2026). 2026–2030 bars are Green Street forecasts.
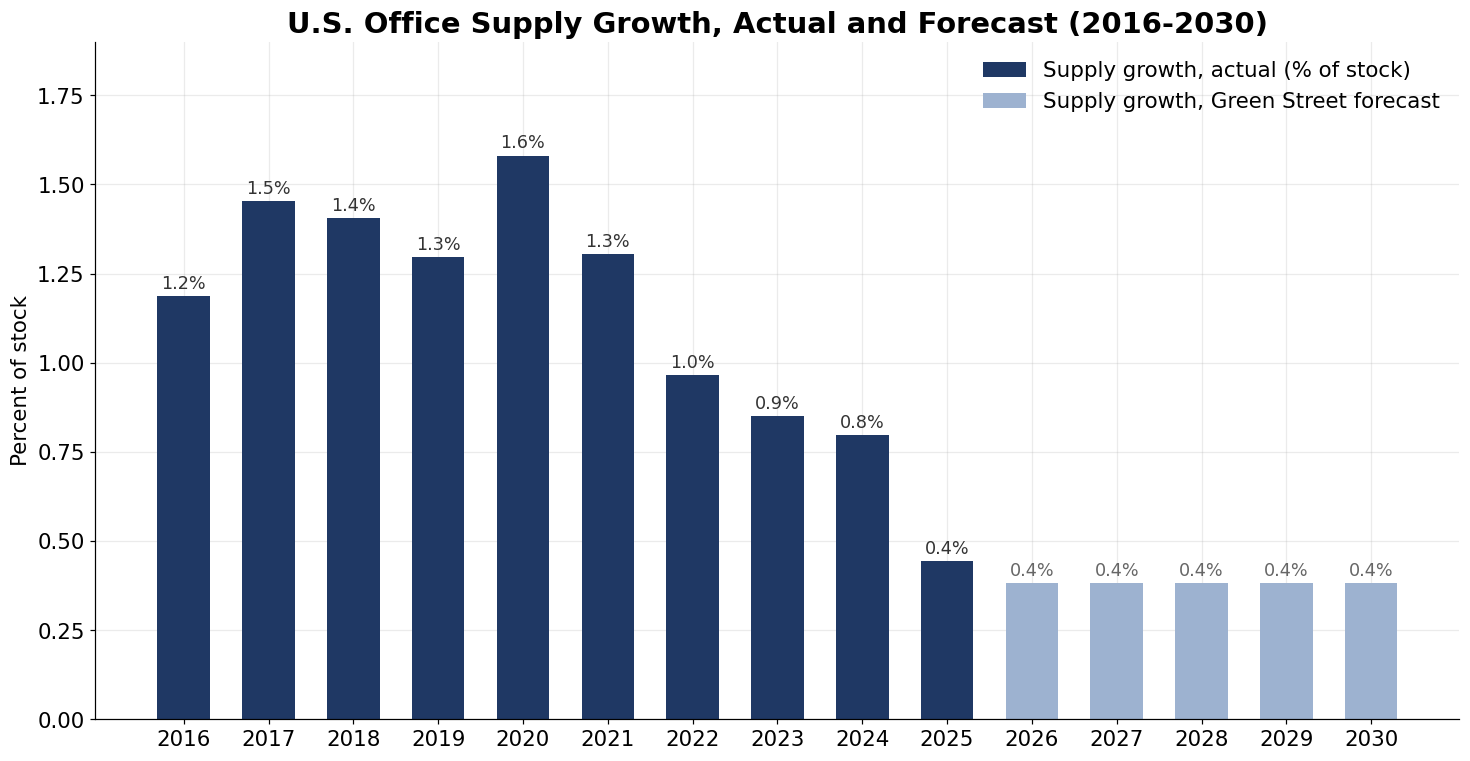
Office supply growth was modest even before the pandemic (1.2–1.6% of stock per year, 2016–2020) and has fallen every year since 2020, to 0.4% of stock in 2025, the lowest in the dataset.
Green Street forecasts supply growth of roughly 0.4% of stock per year through 2030: effectively a construction shutdown outside build-to-suit and conversion activity.
Supply did not cause this correction: office supply growth never exceeded 1.6% of stock in any year of the window. The office correction is a demand event.
Property Values vs. Construction Costs vs. CPI (2016–2025)
Sources: Green Street office CPPI, as loaded in the companion workbook (verified July 2026); FRED series WPU801 (construction PPI) and CPIAUCSL (CPI). All series indexed to 2016 = 100.
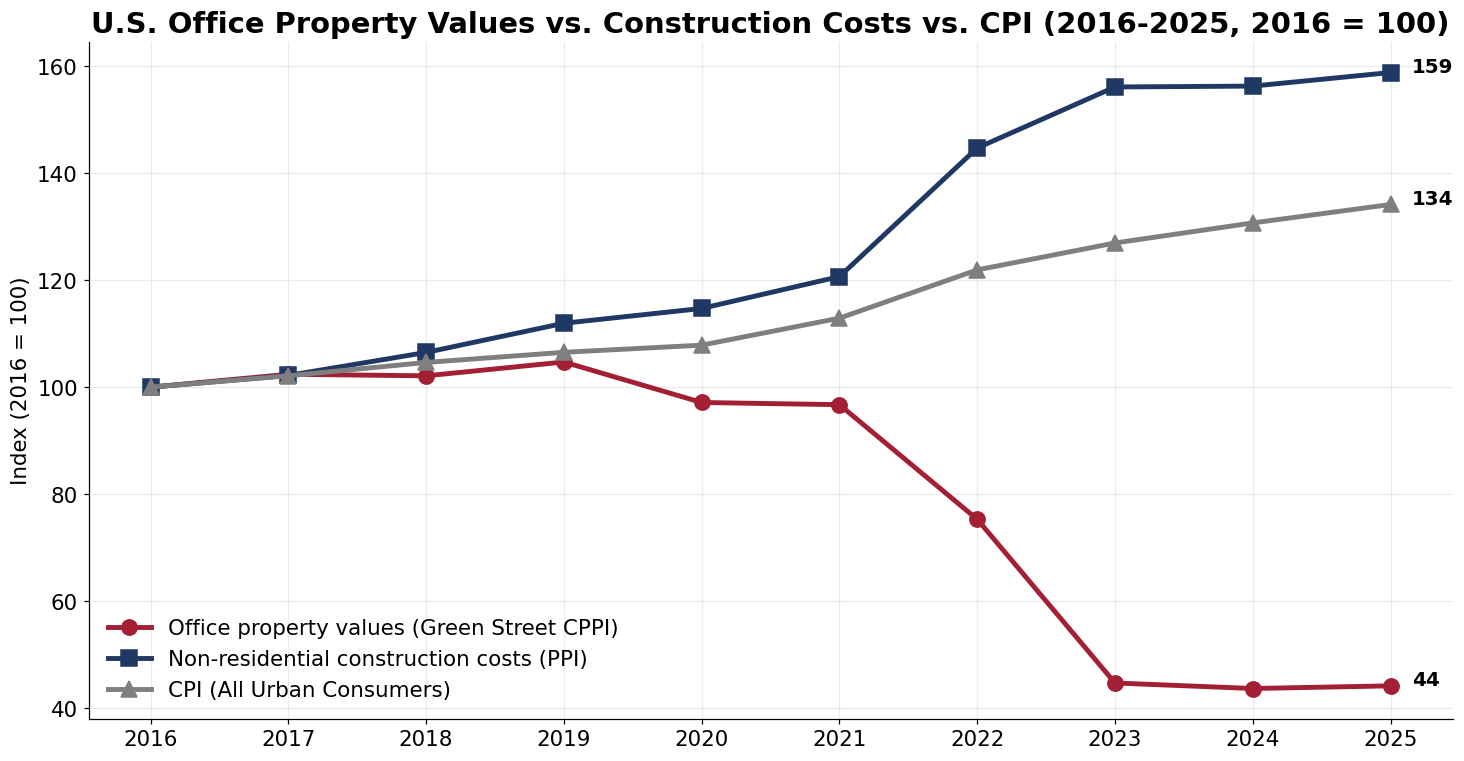
Office property values fell 56% from 2016 (Green Street CPPI: 100 to 44 in 2025) and 58% from their 2019 peak, with the largest declines in 2022 (-22%) and 2023 (-41%). Values have been roughly flat since 2023.
Construction costs rose 59% and CPI 34% over the same window: office market value and office replacement cost have moved in opposite directions for a decade.
The resulting gap is the widest in the CRE42 dataset: values at 44 against construction costs at 159 (both 2016 = 100) imply most existing office trades far below replacement cost, which is the arithmetic behind both the conversion movement and the construction shutdown.
Source: Green Street office series, as loaded in the companion workbook (verified July 2026). Dashed segment (2026–2030) is the Green Street forecast.
Green Street forecasts office Market-RevPAF growth of +2.6% in 2026 and +3.2% in 2027, easing to roughly +2.1% per year through 2030.
The forecast recovery follows five negative years and a 22% cumulative revenue decline; at 2–3% per year, market revenue would not recover its 2019 level until well past 2030.
The recovery mechanism is supply, not demand: with construction near zero and conversions removing stock, even weak absorption tightens the market slowly.
Notes
CoStar and Green Street series are proprietary, licensed via MIT CRE, and carried in the companion workbook's market tabs with source documentation on its Sources tab. Occupancy is 100 minus CoStar national office vacancy. Market-RevPAF is Green Street's revenue per available foot measure (rent times occupancy).
Companion workbook.office-reit-metrics.xlsx – CRE42 office REIT composite annual model (FY2016–FY2025), per-REIT and vs-market tabs, and market comparison data.