Overview
From the mid-1970s through today, U.S. trade policy moved from a largely insulated and protected economy gradually (and then suddenly) into a highly globalized free trade dynamic, and more recently back toward various forms of protectionism. Recognition that domestic manufacturing had become uncompetitive by the 1970s created the political and economic case for open trade, leading to four decades of trade liberalization culminating in China’s entry into the World Trade Organization in 2001 and a widening US trade deficit thereafter. By the mid-2010s, the political consensus supporting open trade had weakened considerably, and policy began shifting toward tariffs, domestic industrial subsidies, and supply chain restructuring. That shift has continued under successive administrations regardless of party. The U.S. goods-and-services trade deficit grew from $39.2 billion in 1992 to $891.7 billion in 2024, while the effective tariff rate fell from 2.6% in 1992 to a low of 1.2% in 2017 before rising to an estimated 6.17% in 2025.
Chart: U.S. Trade Deficit 1992–2024
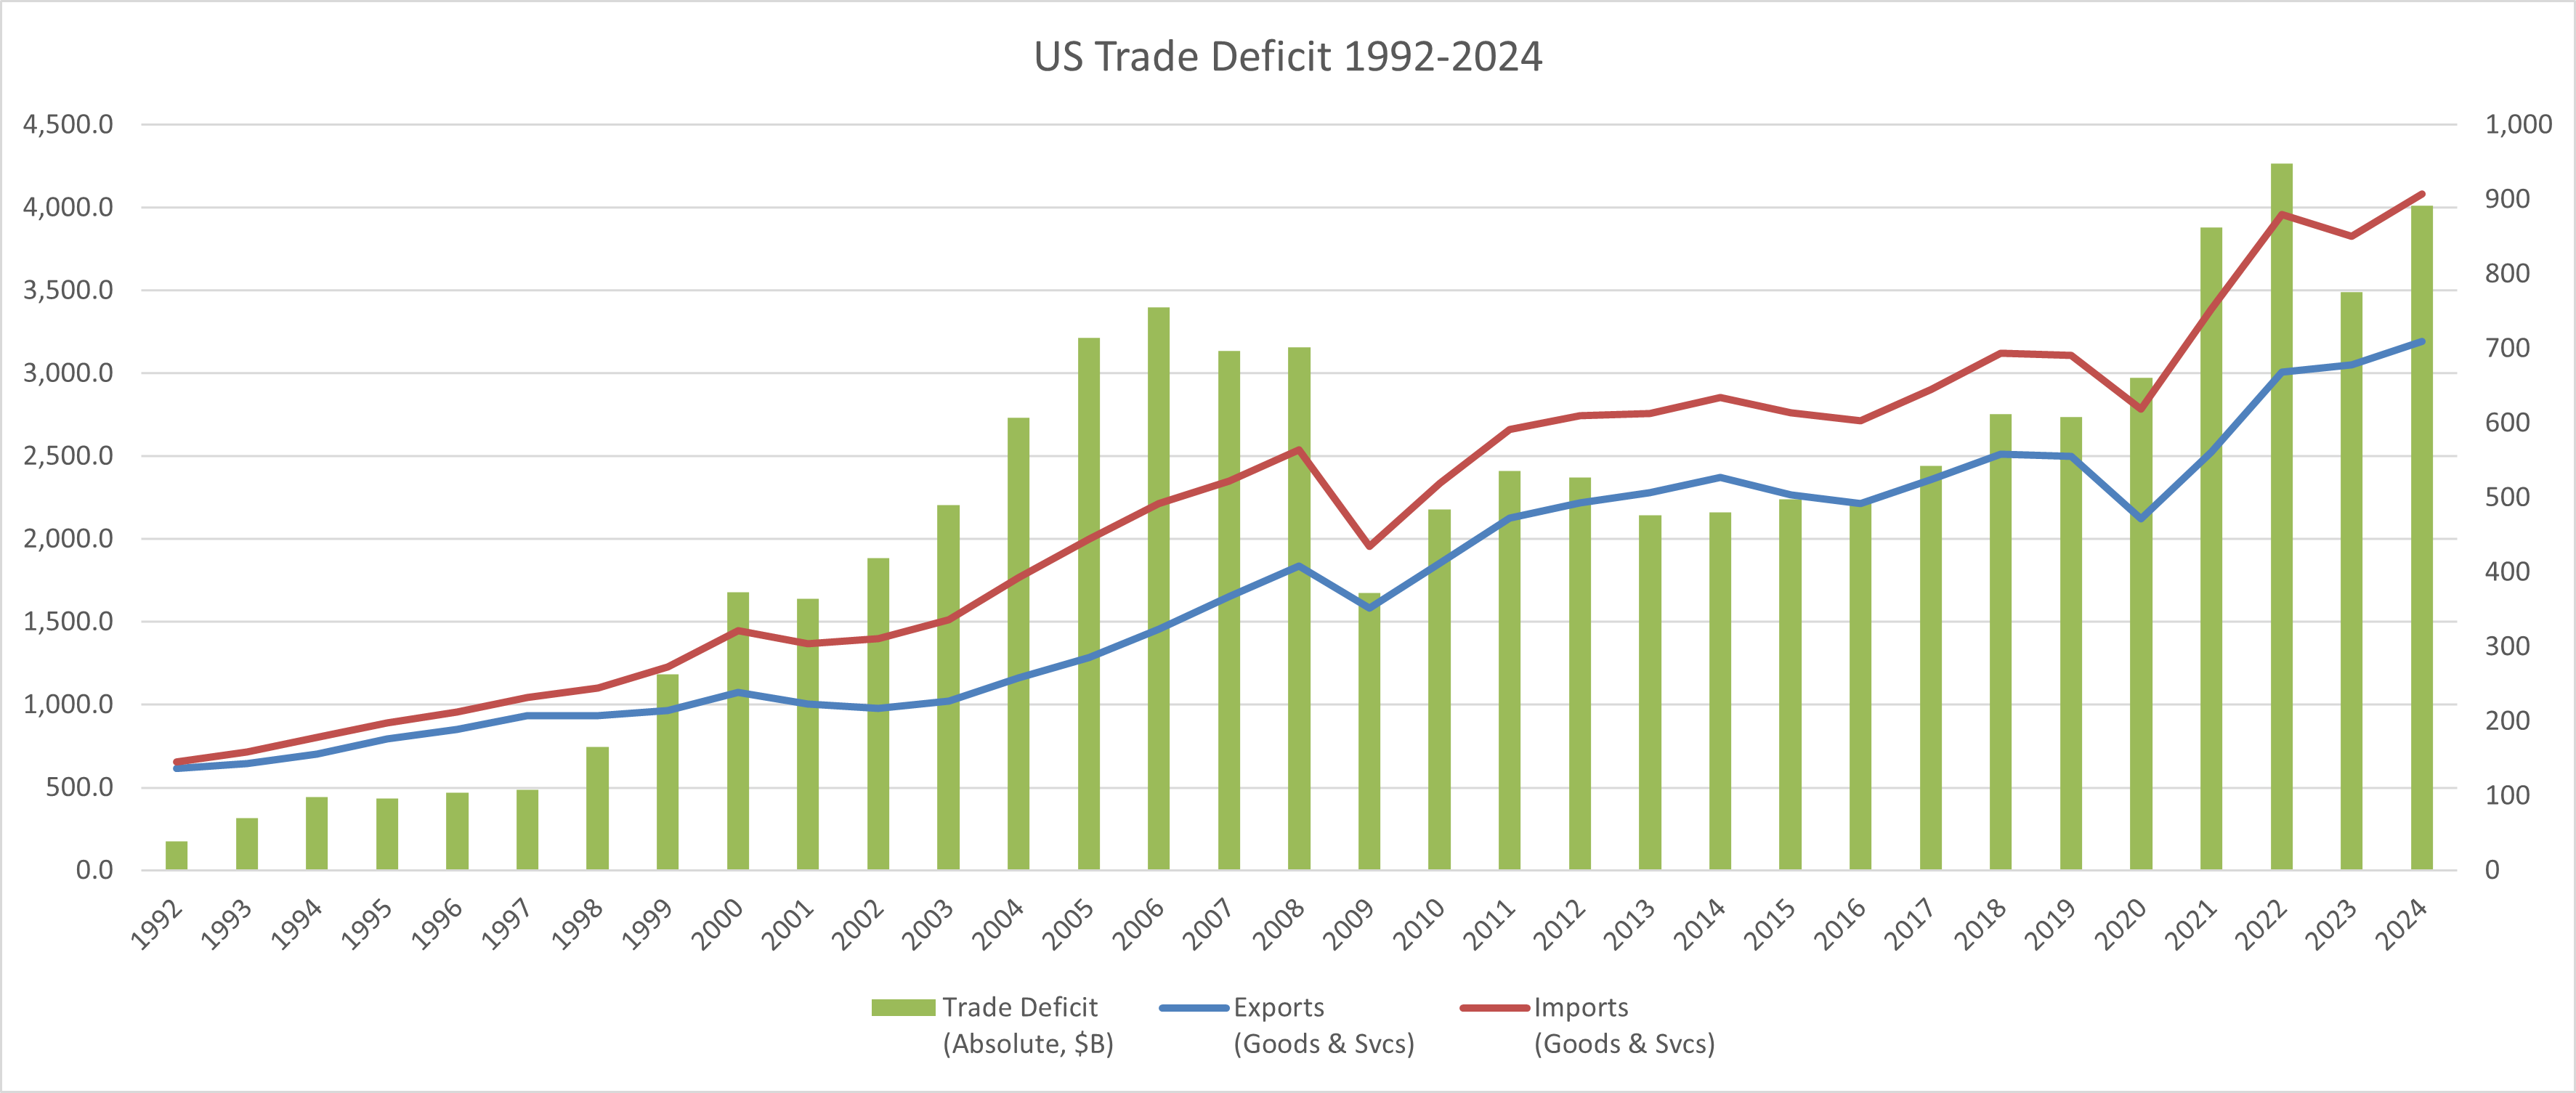
U.S. Trade Deficit 1992–2024: Exports & Imports vs. Deficit (Absolute) | Source: BEA/Census via FRED — Series BOPTEXP, BOPTIMP, BOPGSTB | Chart: CRE42
Chart: U.S. Tariff Revenue and Effective Rate 1992–2025
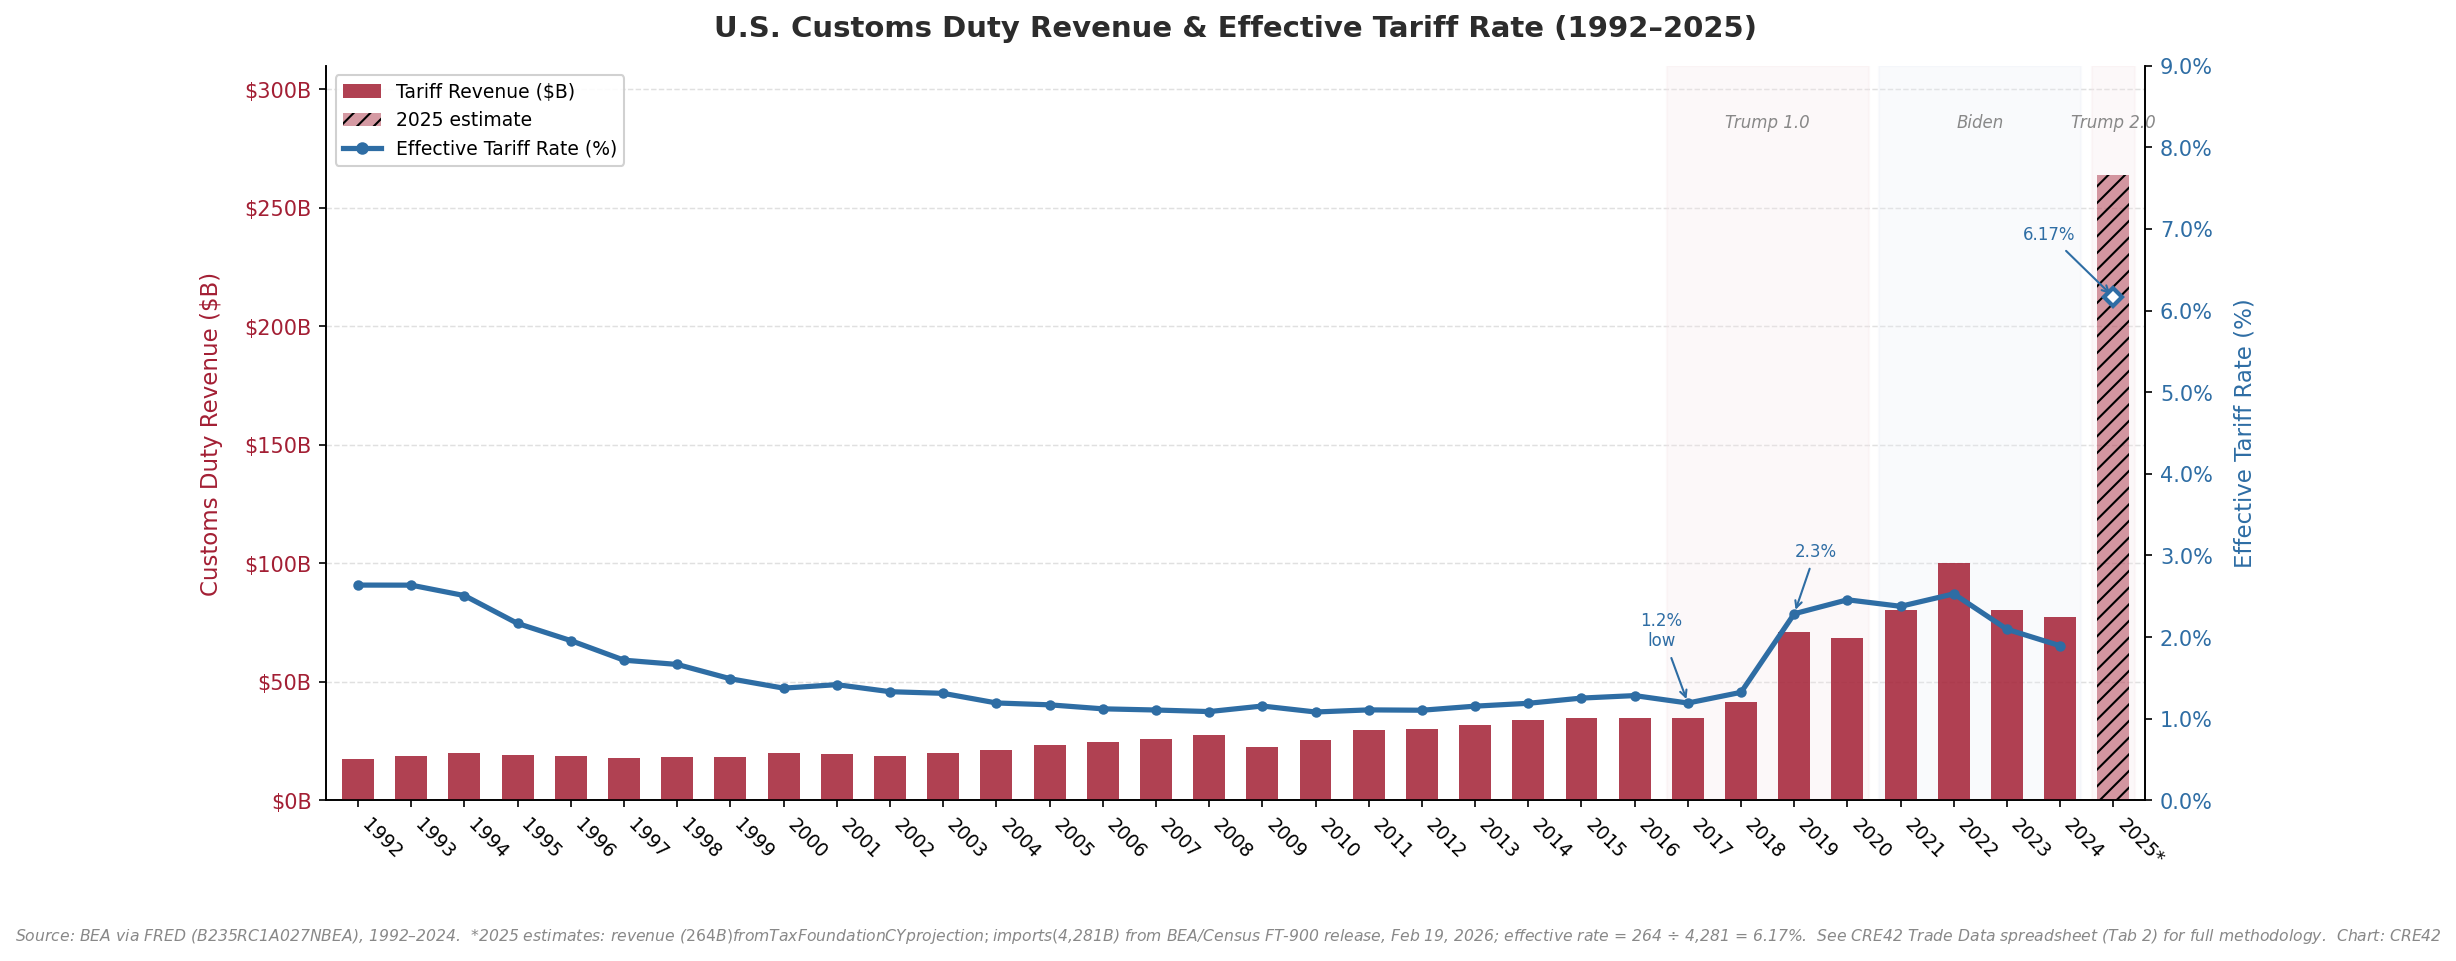
U.S. Customs Duty Revenue & Effective Tariff Rate 1992–2025 | Source: BEA via FRED (B235RC1A027NBEA); 2025 revenue estimate: Tax Foundation; 2025 imports: BEA/Census FT-900 release, Feb 19, 2026 | Chart: CRE42
*2025 figures are estimates. Revenue ($264B): Tax Foundation calendar-year projection. Imports ($4,281.0B): BEA/Census joint release, December 2025 (published February 19, 2026). Effective rate = 264 ÷ 4,281 = 6.17%. See Document Links for full methodology.
Document Links
trade-globalization-to-protectionism.xlsx — Seven-tab workbook: U.S. trade balance 1992–2024, tariff revenue and effective rates, industrial policy acts, manufacturing construction spending, ports and border crossings, and trading partners by year
Key Observations
Context & Discussion
Manufacturing Competitiveness and the Case for Free Trade
During the 1970s, U.S. manufacturing faced increasing competitive pressure from foreign producers, most visibly in the automobile industry. Japanese automakers — benefiting from newer production facilities, different labor cost structures, and targeted government industrial policy — gained significant U.S. market share during this period. Combined with the oil shocks of 1973 and 1979 and sustained inflation, the period produced a political and economic environment in which the existing model of domestically oriented, union-supported manufacturing appeared increasingly difficult to sustain. The share of U.S. workers represented by labor unions peaked at approximately 35% in the mid-1950s and had declined to under 20% by 1983 as manufacturing employment shifted and legislative and economic pressures reduced union influence. These conditions created the political and economic case for a deliberate shift toward open trade and global supply chains beginning in the mid-1980s.
Trade Liberalization: NAFTA, China’s WTO Entry, and the Free Trade Era
The Plaza Accord (1985) coordinated currency adjustments among the G5 nations, making U.S. exports more competitive internationally and establishing a framework for managed trade policy. NAFTA, enacted in 1994, eliminated tariffs across the U.S., Canada, and Mexico and created an integrated North American manufacturing and supply chain system. China’s entry into the WTO in 2001 was the most consequential single event of this era — it opened the full U.S. market to Chinese goods under WTO rules and accelerated the integration of Chinese manufacturing into global supply chains. The effective U.S. tariff rate declined steadily through this period, reaching a low of 1.2% in 2017. Consumer goods prices remained relatively stable and the political consensus broadly supported the direction of policy through the mid-2000s.
A Widening Deficit and Shifting Public Opinion
The 2008 financial crisis and subsequent recession drew renewed attention to domestic manufacturing employment and regional economic conditions in deindustrialized areas. Academic economists began publishing research quantifying the extent to which import competition — particularly from China — contributed to U.S. manufacturing job losses during the 2000s. Research by economists David Autor, David Dorn, and Gordon Hanson, published in the American Economic Review in 2013, estimated that increased import competition from China accounted for a significant share of the roughly 5.5 million U.S. manufacturing jobs lost between 2000 and 2010. Separately, analysis published by the Economic Policy Institute estimated that the growth in the U.S.–China goods trade deficit displaced 3.7 million U.S. jobs between 2001 and 2018, with the bilateral deficit growing from $83.0 billion to $419.2 billion over that period. Policy positions on trade began shifting across both parties during this period, though the formal tariff structure remained largely unchanged until 2018.
Protectionism as Bipartisan Policy
Section 301 tariffs imposed by the first Trump administration beginning in 2018 represented the first significant departure from the post-1985 trade liberalization trajectory, targeting approximately $360 billion in Chinese goods. The Biden administration largely maintained those tariffs and added domestic industrial policy legislation — the CHIPS and Science Act (2022), the Inflation Reduction Act (2022), and the Infrastructure Investment and Jobs Act (2021) — directing federal investment toward domestic semiconductor manufacturing, clean energy production, and infrastructure. Total tariff revenue collected under the Biden administration ($144.3 billion) exceeded that of the first Trump administration ($89.1 billion), reflecting continuity in the overall direction of trade policy across administrations. The second Trump administration has escalated tariffs further, with an estimated effective rate of 6.17% in 2025 and Tax Foundation projected annual revenue of approximately $264 billion. In February 2026, the Supreme Court ruled President Trump’s primary means for raising tariffs in 2025 (the International Emergency Economic Powers Act, “IEEPA”) invalid because it does not actually authorize the President to impose tariffs. President Trump responded by using Section 122 to impose blanket tariffs of 10% (later raised to 15%) on February 23, 2026; the statutory 150-day limit expires July 23, 2026. The constitutional authority for tariffs imposed under IEEPA is subject to ongoing litigation in federal courts. The status of potential IEEPA refunds and the future of Section 122 tariffs or other measures the Trump administration may pursue remain highly unclear at this writing in March 2026.
Key Trade Policy Milestones
| Year | Event | Significance |
|---|---|---|
| 1985 | Plaza Accord | G5 coordinated currency realignment; U.S. dollar depreciation boosted export competitiveness and signaled shift toward managed trade policy |
| 1994 | NAFTA enacted | Eliminated tariffs across U.S., Canada, and Mexico; created integrated North American manufacturing and supply chains |
| 2001 | China enters WTO | Most consequential trade liberalization event of the era; accelerated U.S.–China trade integration; bilateral goods deficit grew from $83B (2001) to $419B (2018) |
| 2018 | Section 301 tariffs (Trump 1.0) | First significant departure from post-1985 liberalization trajectory; targeted ~$360B in Chinese goods; effective tariff rate rose from 1.2% (2017) to 2.3% (2019) |
| 2020 | USMCA replaces NAFTA | Updated North American trade agreement with revised rules of origin, stronger labor provisions, and digital trade chapters |
| 2021–2022 | IIJA, CHIPS Act, IRA | Combined authorization of $1.5T+ in federal investment for infrastructure, domestic semiconductor manufacturing, and clean energy production |
| 2025–2026 | IEEPA tariffs / Section 122 (Trump 2.0) | Broad-based tariff escalation; estimated effective rate 6.17% (2025); Supreme Court ruled IEEPA tariff authority invalid (Feb 2026); administration pivoted to Section 122 blanket tariffs of 10% (later 15%) effective 2/23/26, statutory expiration 7/23/26; IEEPA refunds and future tariff authority remain unresolved |
CRE Implications
The shift in trade policy affects commercial real estate through several channels. Construction material costs — steel, aluminum, and certain electrical components — are directly affected by tariff levels, with implications for development budgets across all property types. Industrial and logistics real estate has experienced significant demand tied to supply chain restructuring, nearshoring activity, and the growth of U.S.–Mexico cross-border trade. Laredo, Texas ranked as the #1 U.S. port by trade value in 2023 at $339 billion — the first land crossing to hold that position — reflecting the magnitude of the Mexico trade shift. The manufacturing construction boom has created demand for large-format industrial facilities in semiconductor, battery, and other advanced manufacturing sectors. These topics are developed in detail in the Manufacturing Construction Boom, Shifting Trade Partners, and Tariffs, Construction Costs & CRE tiles.
Sources
1. Bureau of Economic Analysis / U.S. Census Bureau. U.S. International Trade in Goods and Services. FRED Series: BOPTEXP, BOPTIMP, BOPGSTB, BOPGTB, BOPSTTB. fred.stlouisfed.org
2. Bureau of Economic Analysis. Federal Government Current Tax Receipts: Taxes on Imports. FRED Series: B235RC1A027NBEA. fred.stlouisfed.org/series/B235RC1A027NBEA
3. U.S. Census Bureau and Bureau of Economic Analysis. U.S. International Trade in Goods and Services, December 2025. FT-900, released February 19, 2026. census.gov/foreign-trade/Press-Release/current_press_release/ft900.pdf
4. U.S. Census Bureau, Foreign Trade Division. Trade in Goods with China. Annual data 2001–2024. census.gov/foreign-trade/balance/c5700.html
5. U.S. Census Bureau, Foreign Trade Division. Top Trading Partners — Total Trade, Exports, Imports. 2020–2024. census.gov/foreign-trade/statistics/highlights/toppartners.html
6. Tax Foundation. Tariff Revenue Estimates, 2025. taxfoundation.org
7. U.S. Census Bureau via FRED. Total Construction Spending: Manufacturing. Series: TLMFGCONS. fred.stlouisfed.org/series/TLMFGCONS
8. Autor, David, David Dorn, and Gordon Hanson. The China Syndrome: Local Labor Market Effects of Import Competition in the United States. American Economic Review, 2013. aeaweb.org
9. Scott, Robert E. and Zane Mokhiber. Growing China Trade Deficits Cost 3.7 Million American Jobs Between 2001 and 2018. Economic Policy Institute, 2020. epi.org
10. Congressional Research Service. CHIPS and Science Act (R47523); Inflation Reduction Act (R47262); Infrastructure Investment and Jobs Act (R47034). crsreports.congress.gov
11. U.S. Census Bureau. Annual Trade Highlights 2018. census.gov/foreign-trade/statistics/highlights/annual.html
12. Bureau of Labor Statistics. Union Members Summary. Historical union membership data. bls.gov/news.release/union2.nr0.htm
Methodology & Data Notes
Effective Tariff Rate Calculation
The effective tariff rate is calculated as customs duty revenue (FRED: B235RC1A027NBEA) divided by total goods-and-services imports (FRED: BOPTIMP). This is a derived figure, not a published series. It represents the average realized rate across all imports, not the statutory rate on any specific category. Note that tariffs legally apply to goods only; dividing by total imports (goods and services) understates the effective rate on goods.
2025 Data Sources and Correction Note
The 2025 revenue figure ($264 billion) is a Tax Foundation calendar-year estimate based on U.S. Treasury monthly statements. The 2025 imports figure ($4,281.0 billion) is the actual full-year total from the BEA/Census FT-900 joint release for December 2025, published February 19, 2026 (imports increased $197.8 billion, or 4.8%, from the 2024 base of $4,083.2 billion). The effective rate of 6.17% = 264 ÷ 4,281. A prior version of the CRE42 Trade Data spreadsheet used a round-number estimate of $4,200B for 2025 imports; this has been corrected to the actual figure in the current version. The Tax Foundation CY figure ($264B) differs from the CRFB fiscal-year estimate (~$195B) due to FY vs. CY timing differences.
Trade Balance Series
All trade balance data (goods and services combined, goods only, services only) are from the BEA/Census joint release on a Balance of Payments basis, sourced via FRED. Figures are annual totals in nominal U.S. dollars. The goods-only bilateral deficit with China uses Census Bureau country-level data (census.gov/foreign-trade/balance/c5700.html), which is on a Census basis and not directly comparable to BOP-basis totals.
Manufacturing Construction
Data are from Census Bureau Total Construction Spending: Manufacturing (FRED: TLMFGCONS), representing the annual average of monthly seasonally adjusted annual rate (SAAR) figures in nominal dollars.
IEEPA / Section 122 Tariff Status
In February 2026, the Supreme Court ruled that IEEPA does not authorize the President to impose tariffs. The administration subsequently invoked Section 122 to impose blanket tariffs of 10% (later raised to 15%) effective February 23, 2026; the statutory 150-day limit expires July 23, 2026. The status of potential IEEPA refunds, ongoing IEEPA litigation in federal courts, and the future of Section 122 tariffs or successor measures remain unresolved as of March 2026. Verify current tariff levels against USTR and Commerce Department publications before relying on these figures.