
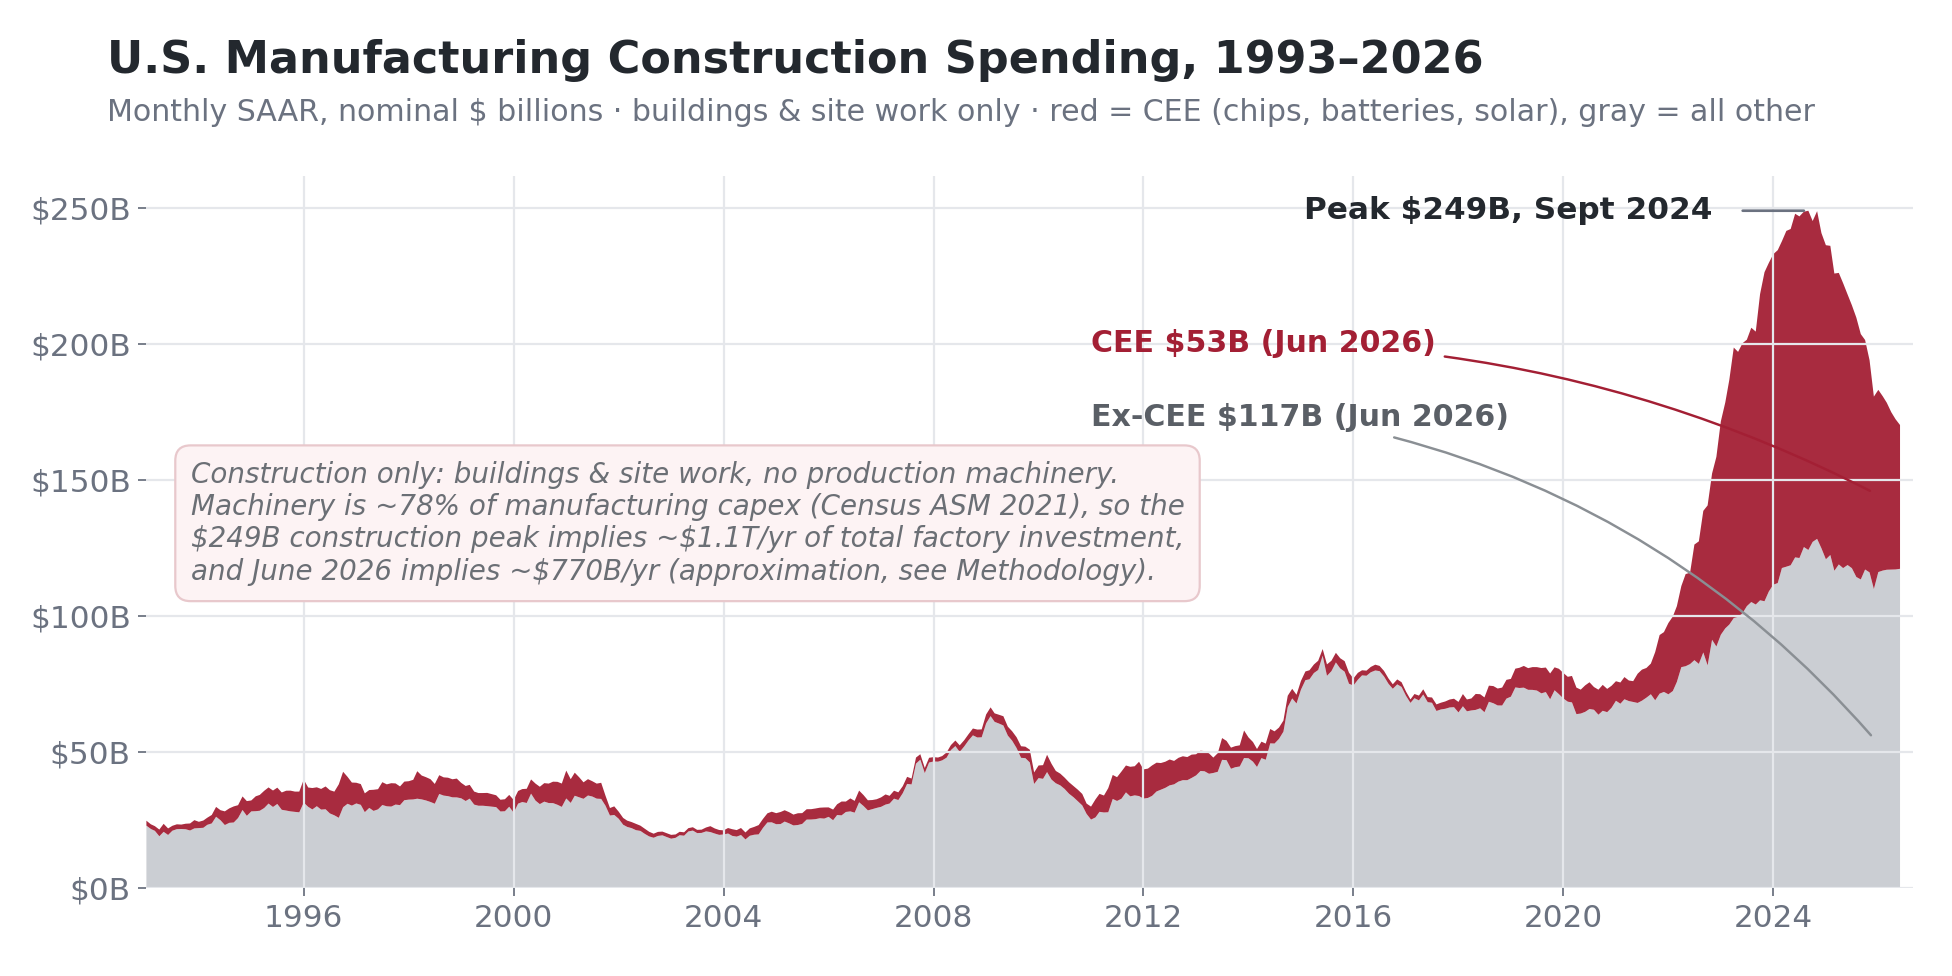
U.S. Manufacturing Construction Spending, 1993–2026: monthly, seasonally adjusted annual rate, nominal dollars, buildings and site work only (production machinery excluded). CEE = Census computer/electronic/electrical category (chip fabs, battery plants, solar and electrical equipment).[1] | Chart: CRE42
Manufacturing Job Growth Has Been Disappointing vs. Expectations
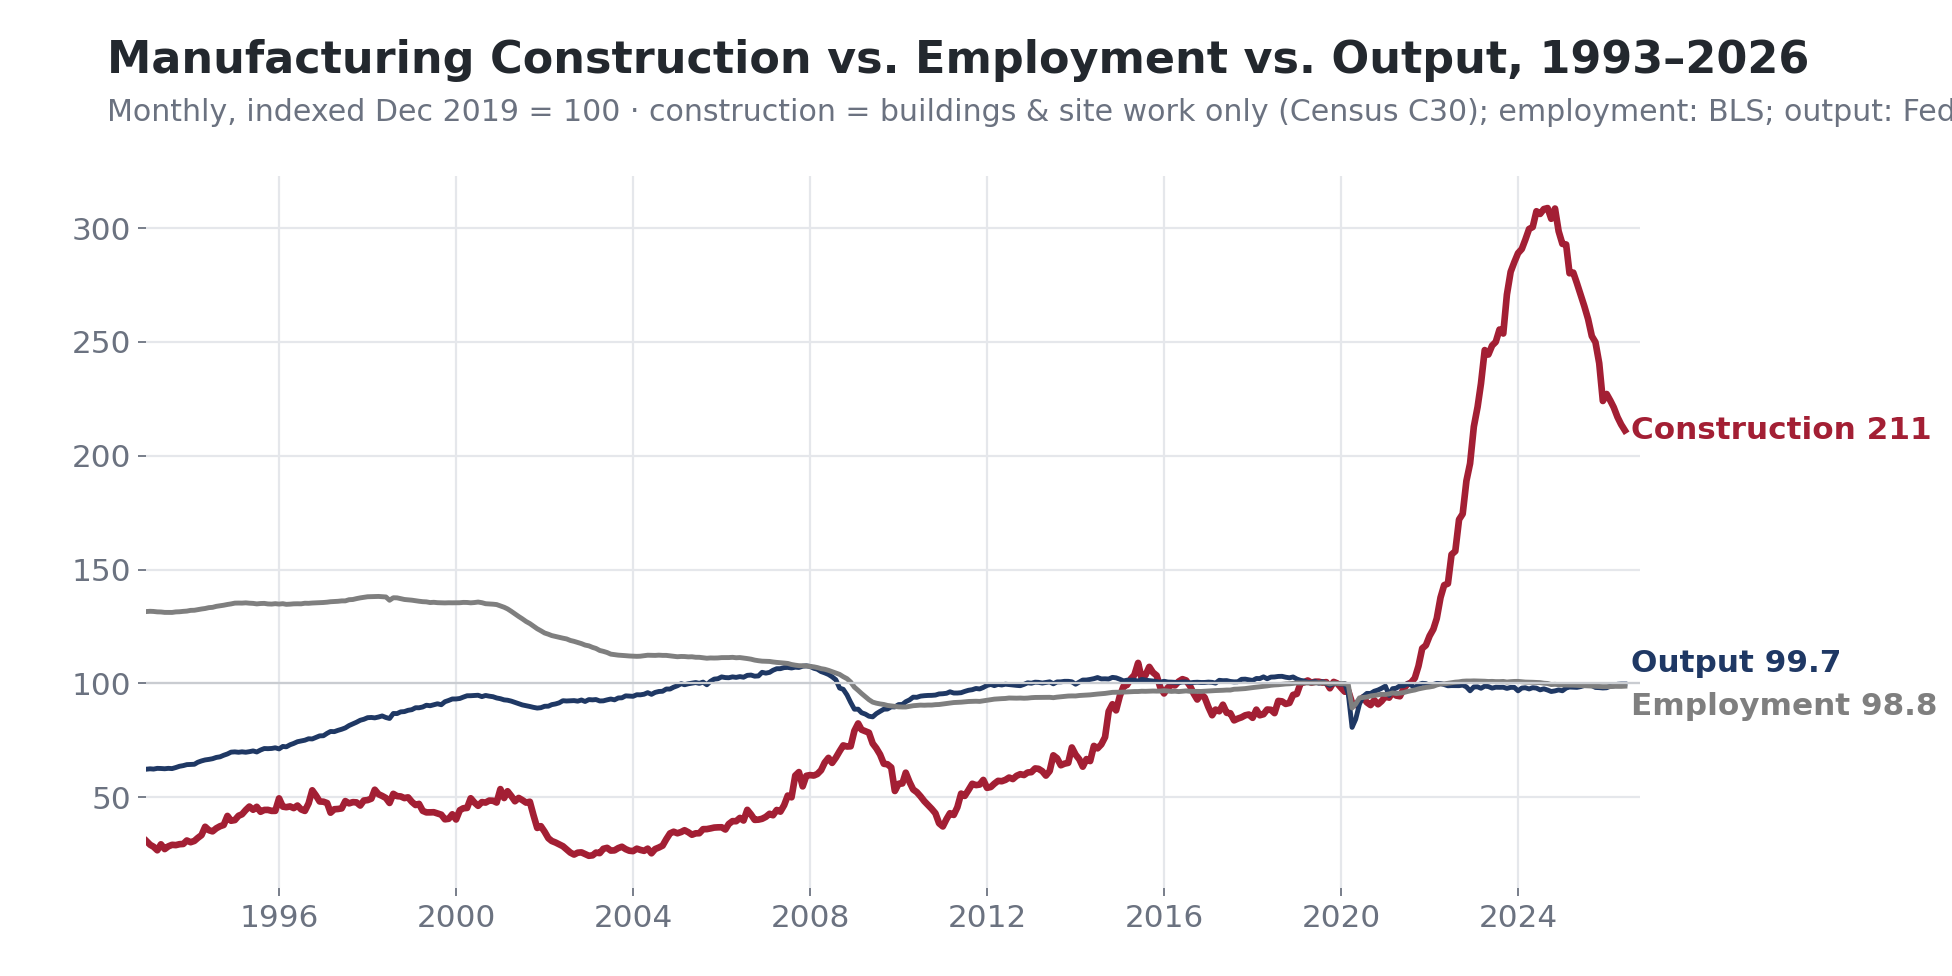
Manufacturing Construction vs. Employment vs. Output, 1993–2026: monthly, indexed to December 2019 = 100.[1][3][5] | Chart: CRE42
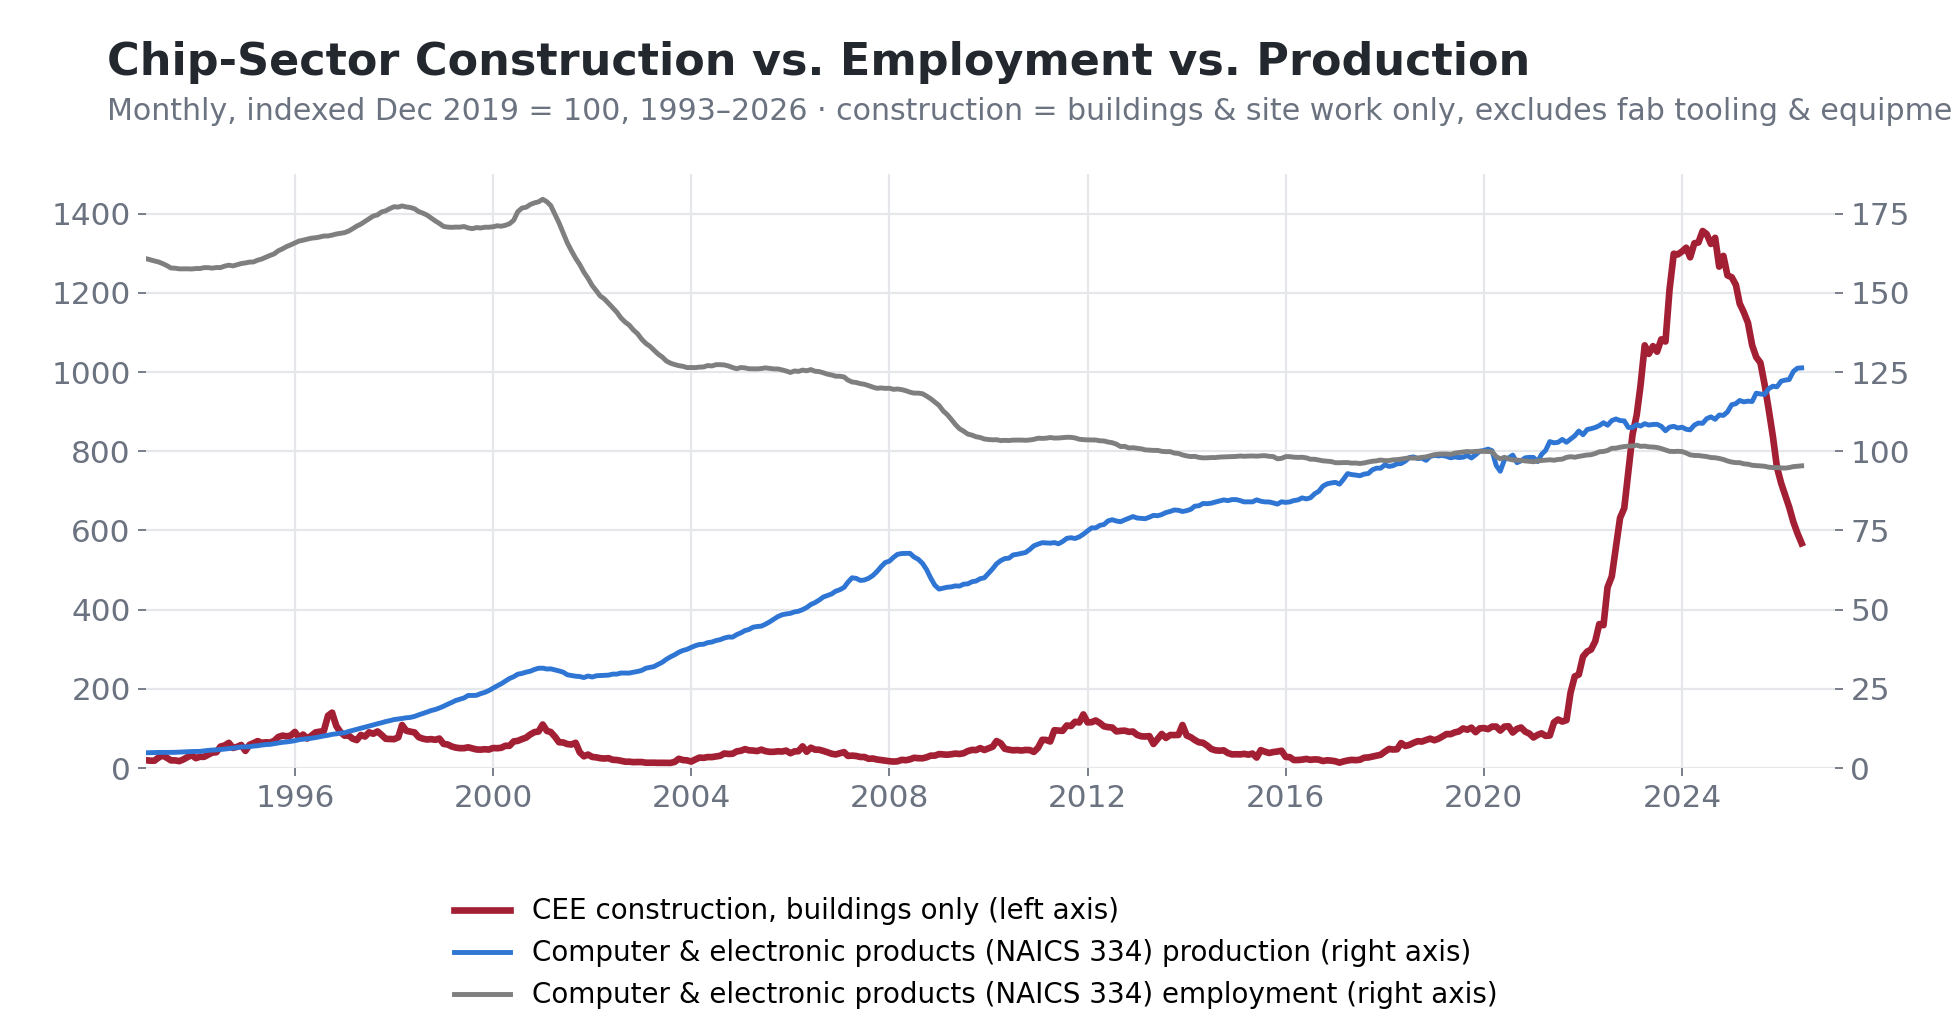
Chip-Sector Construction vs. Employment vs. Production: monthly, indexed to December 2019 = 100. Construction: Census C30 CEE category. Employment and production: computer & electronic products (NAICS 334).[1][4][5] | Chart: CRE42
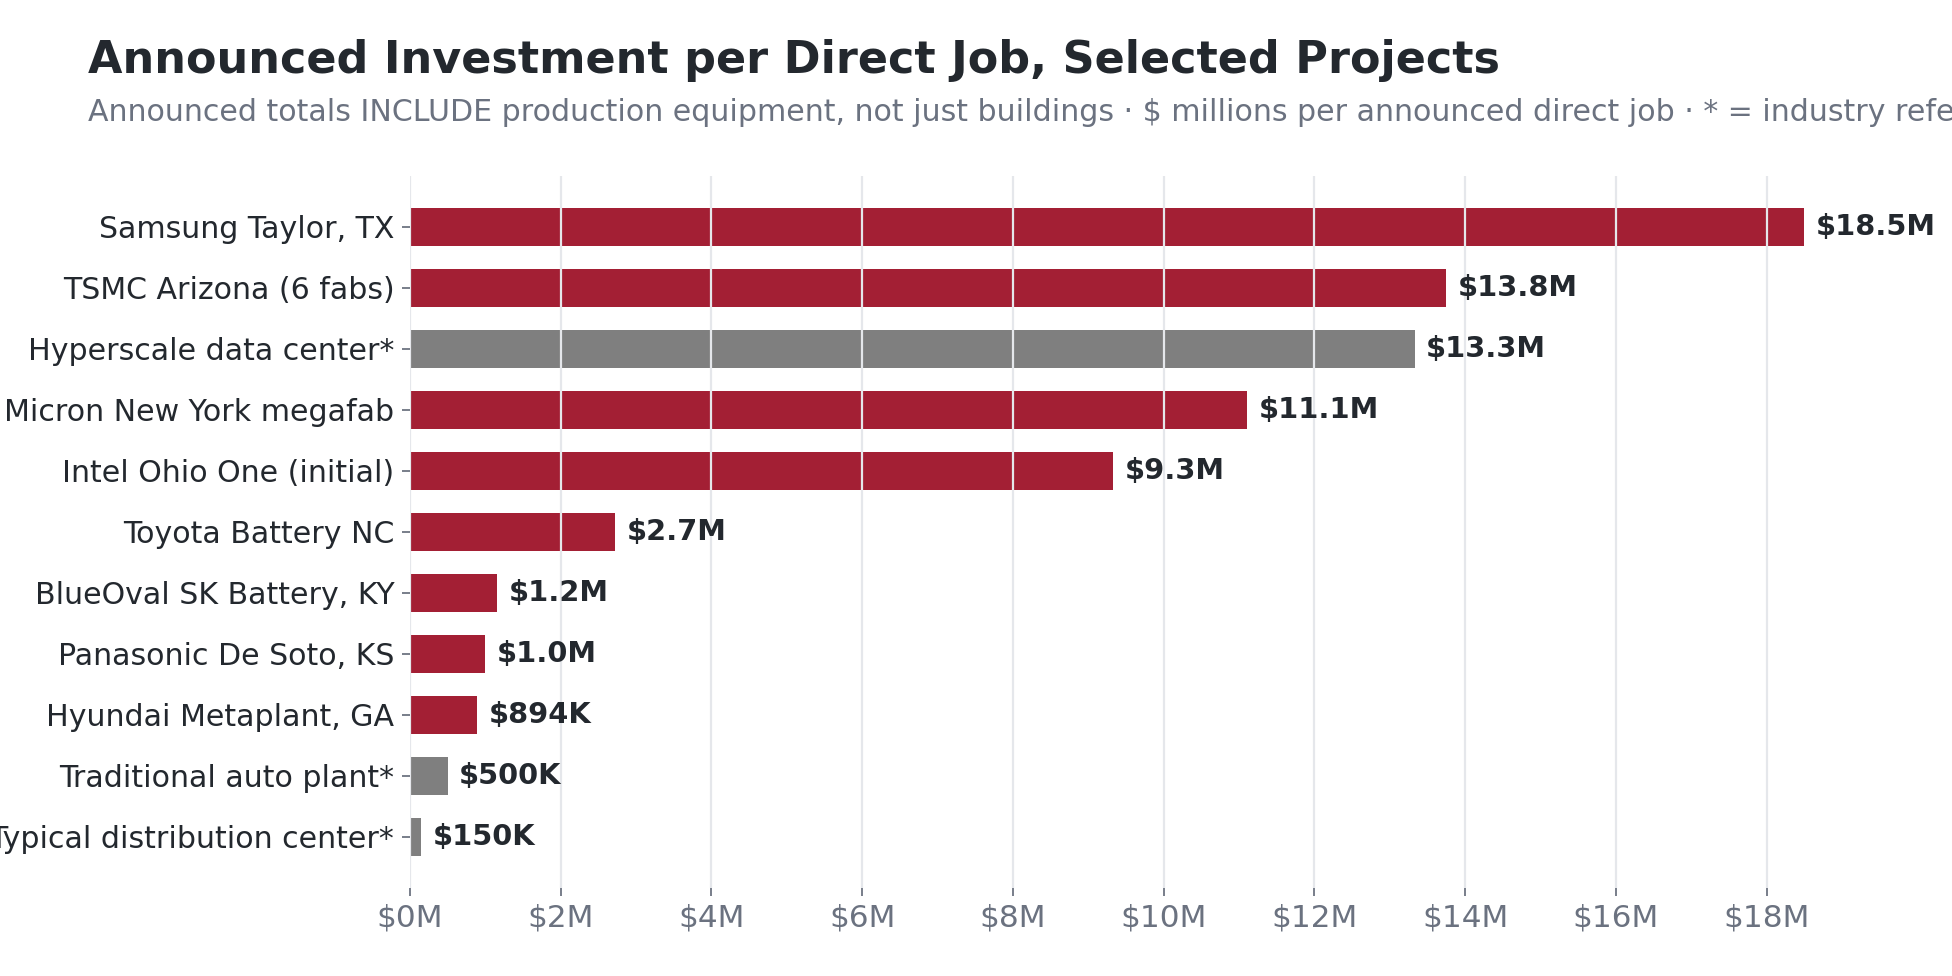
Announced Investment per Direct Job, Selected Projects: company and state announcements; announced totals include production equipment, not just buildings; * = industry reference point, not a specific announcement. Figures pending verification against primary announcements.[6] | Chart: CRE42
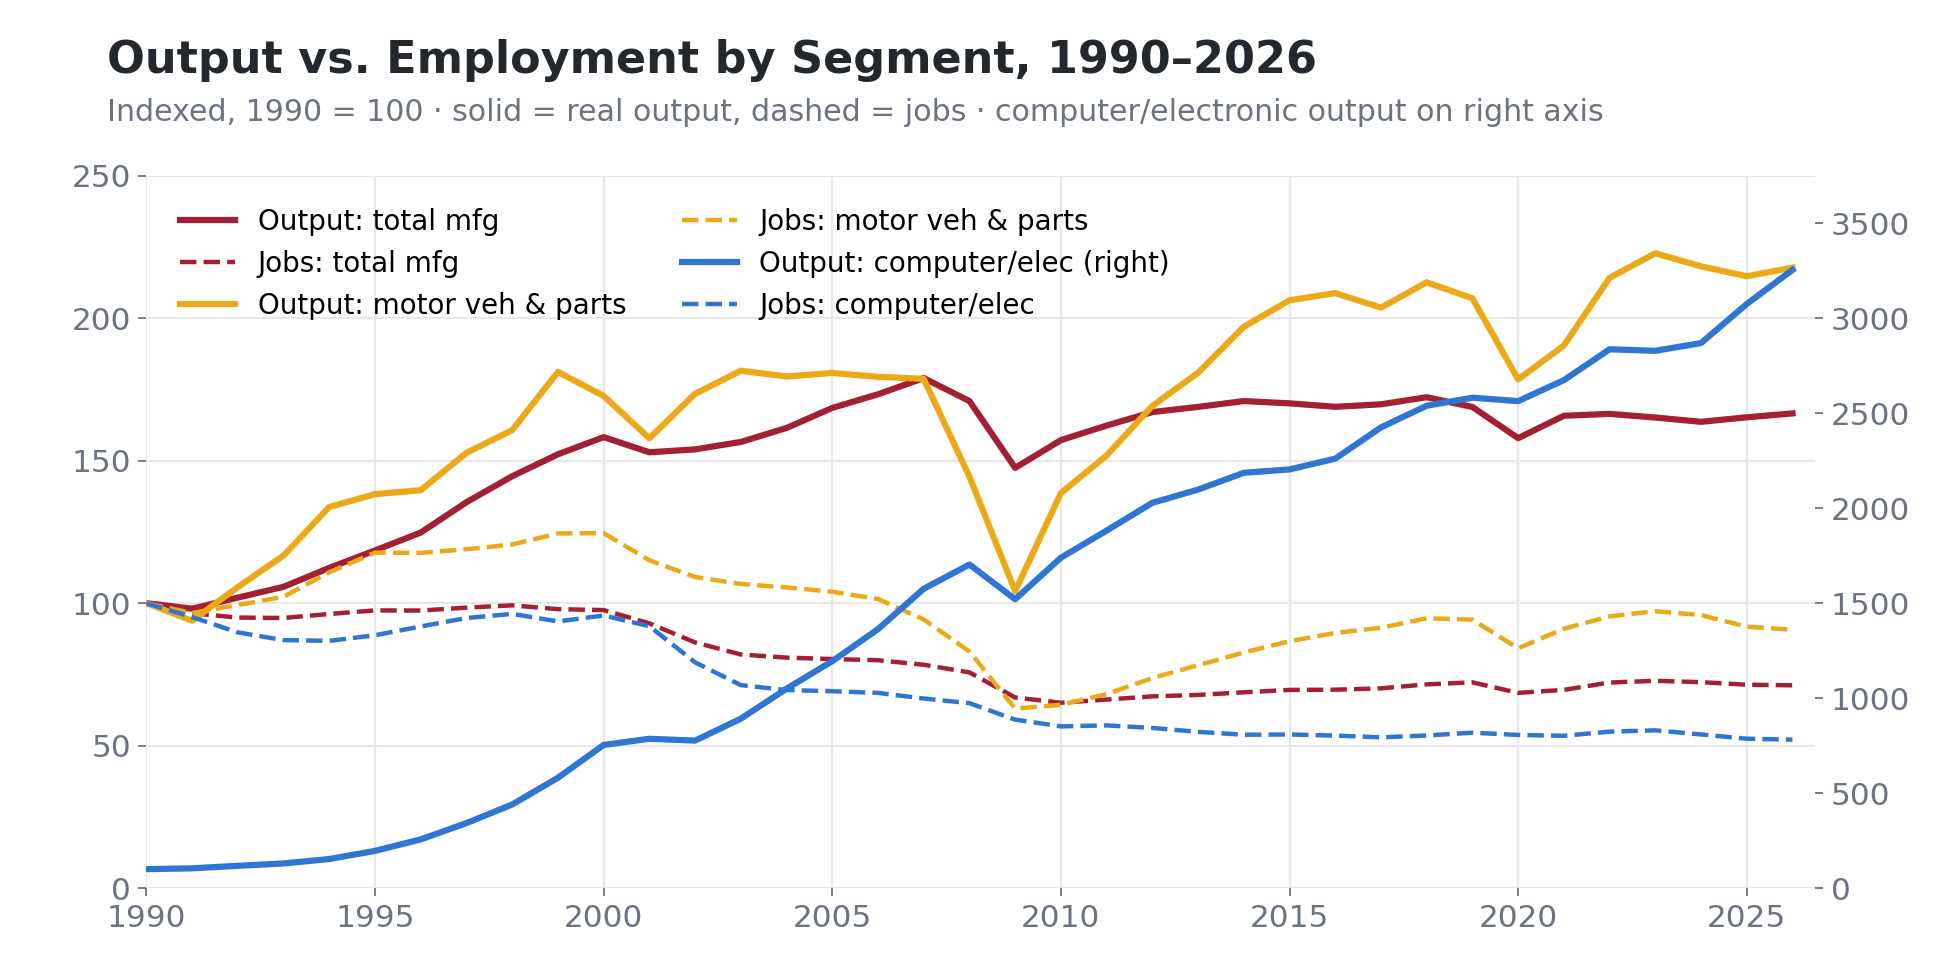
Output vs. Employment by Segment, 1990–2026: indexed, 1990 = 100; solid = real output, dashed = jobs; computer/electronic output on right axis. 2026 = Jan–Jun average.[3][5] | Chart: CRE42
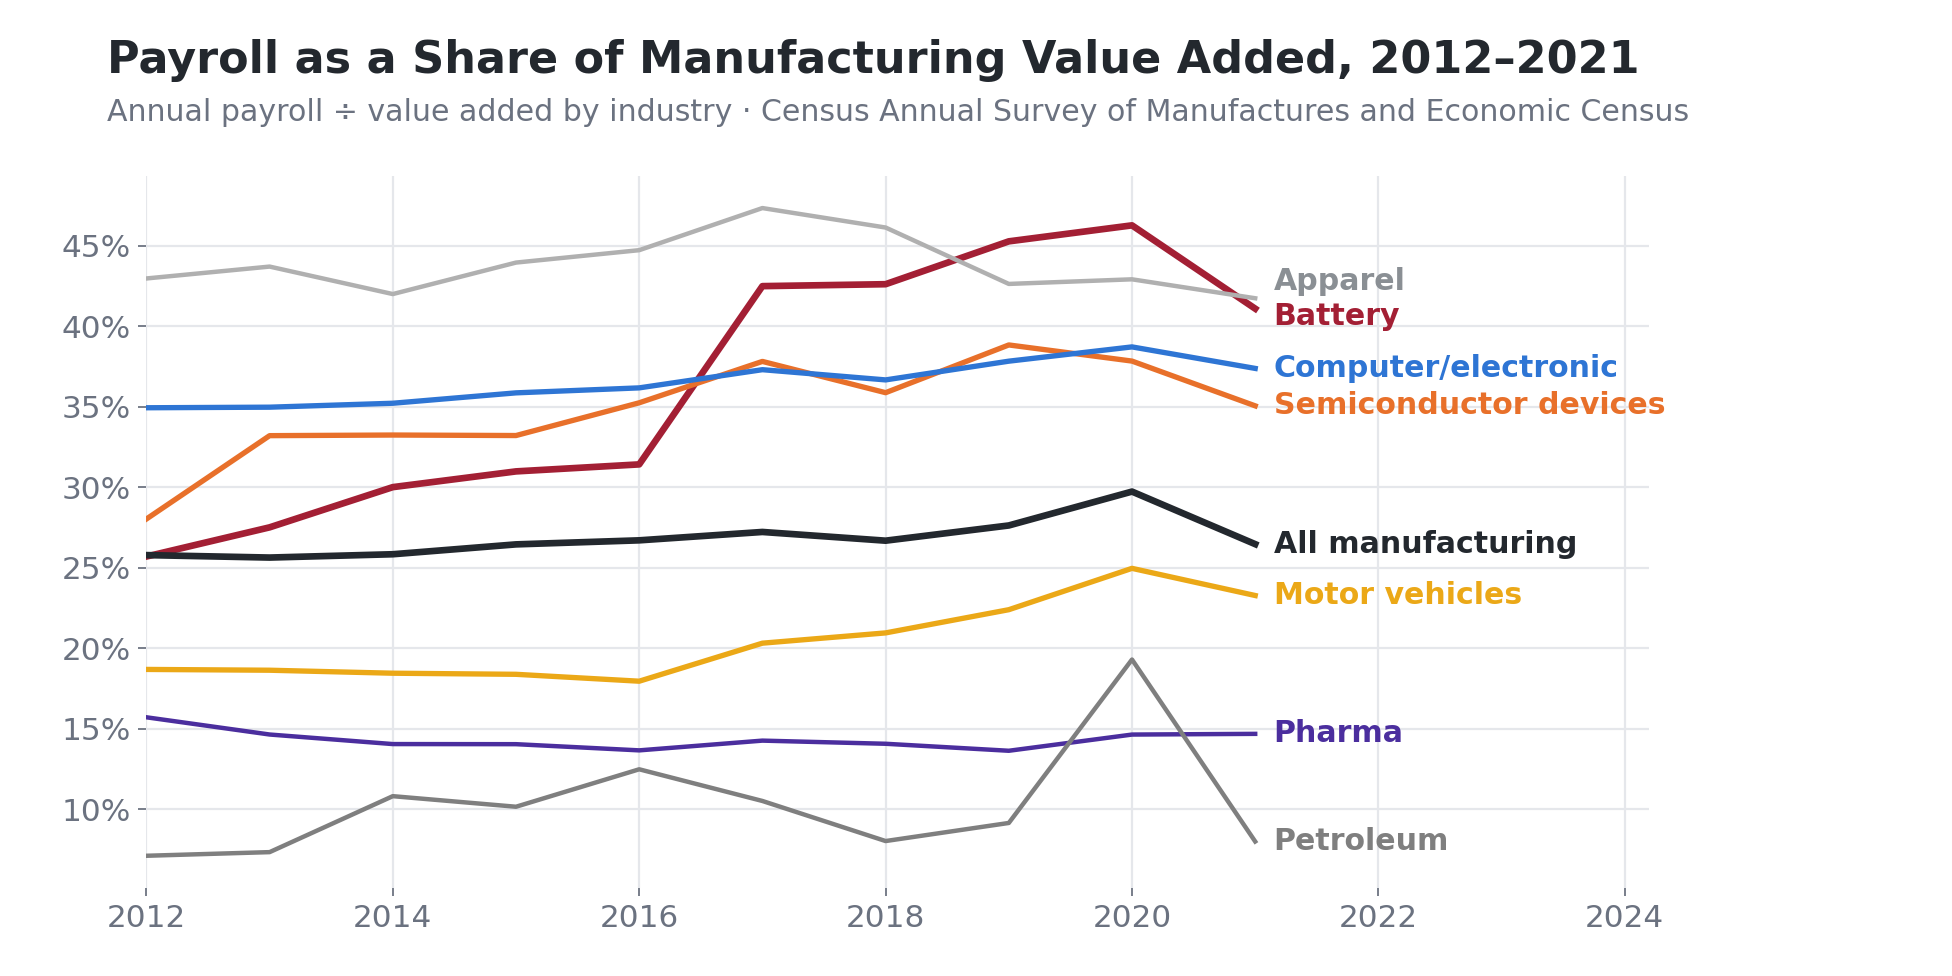
Payroll as a Share of Manufacturing Value Added, 2012–2021: annual payroll ÷ value added. 2012 and 2017 are Economic Census years; 2013–2016 and 2018–2021 are Annual Survey of Manufactures years.[8] | Chart: CRE42
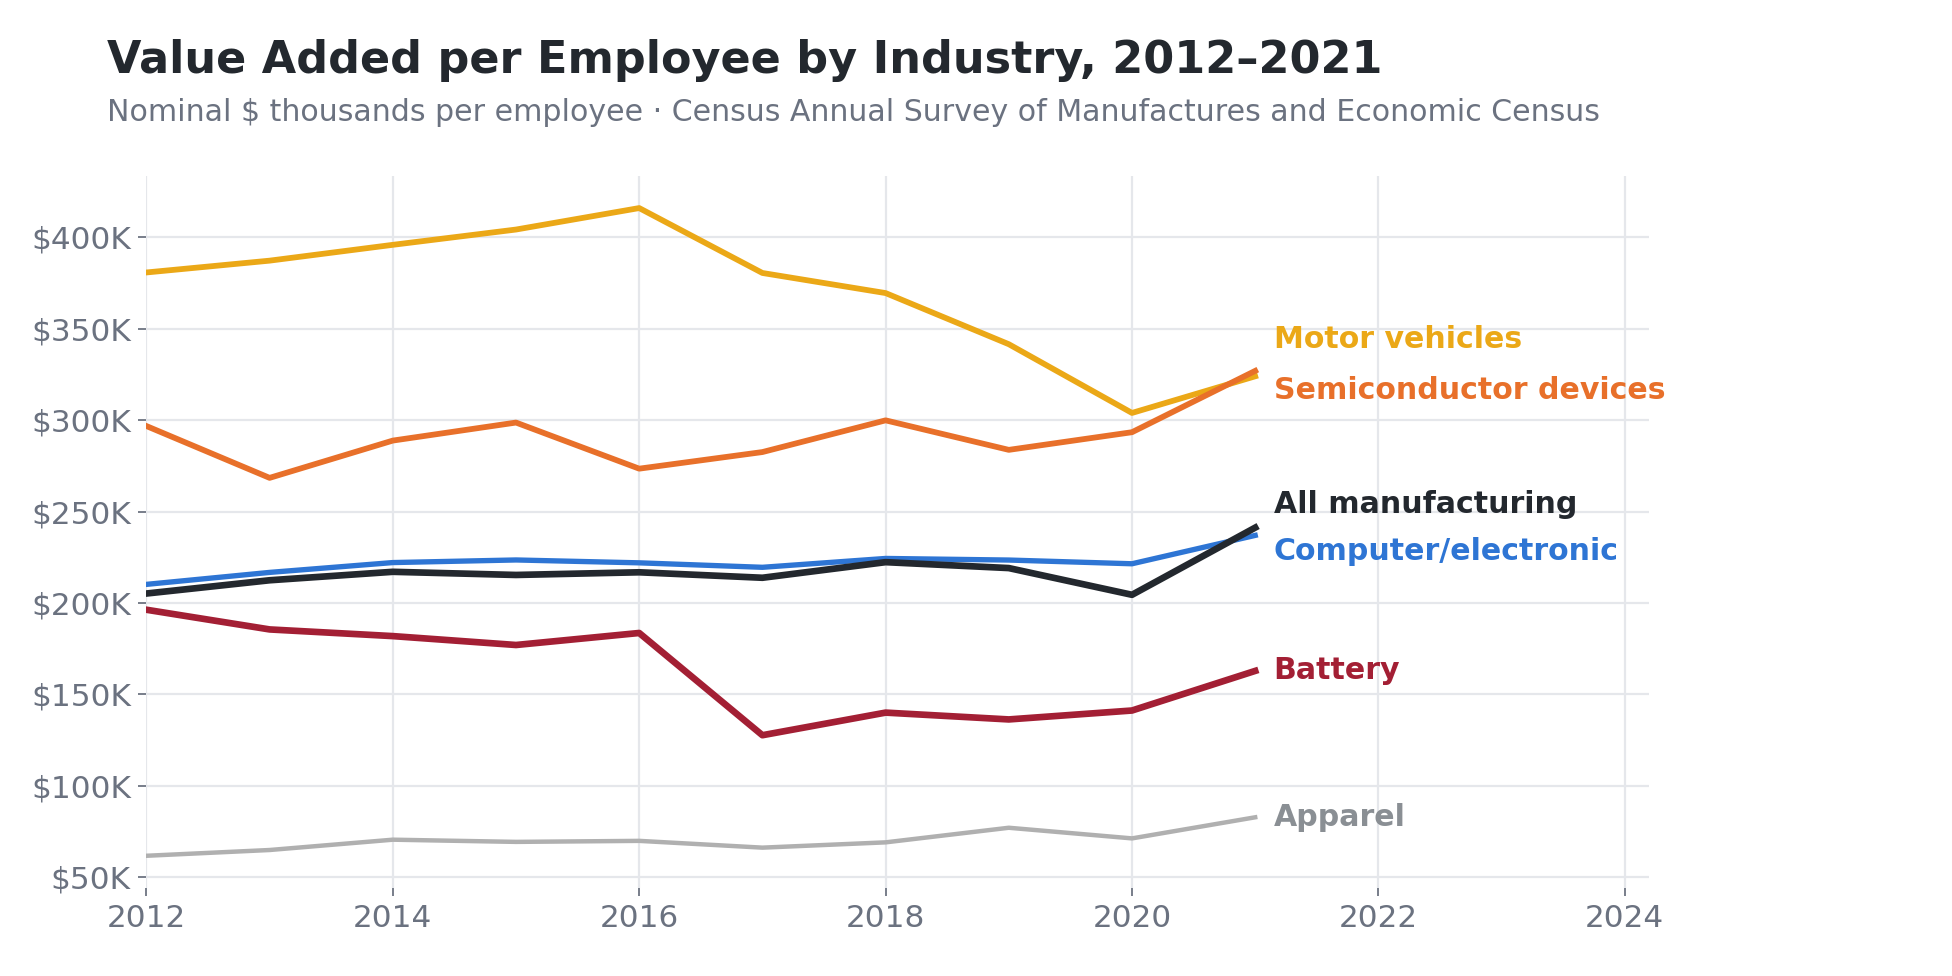
Value Added per Employee by Industry, 2012–2021: nominal $ thousands per employee.[8] | Chart: CRE42
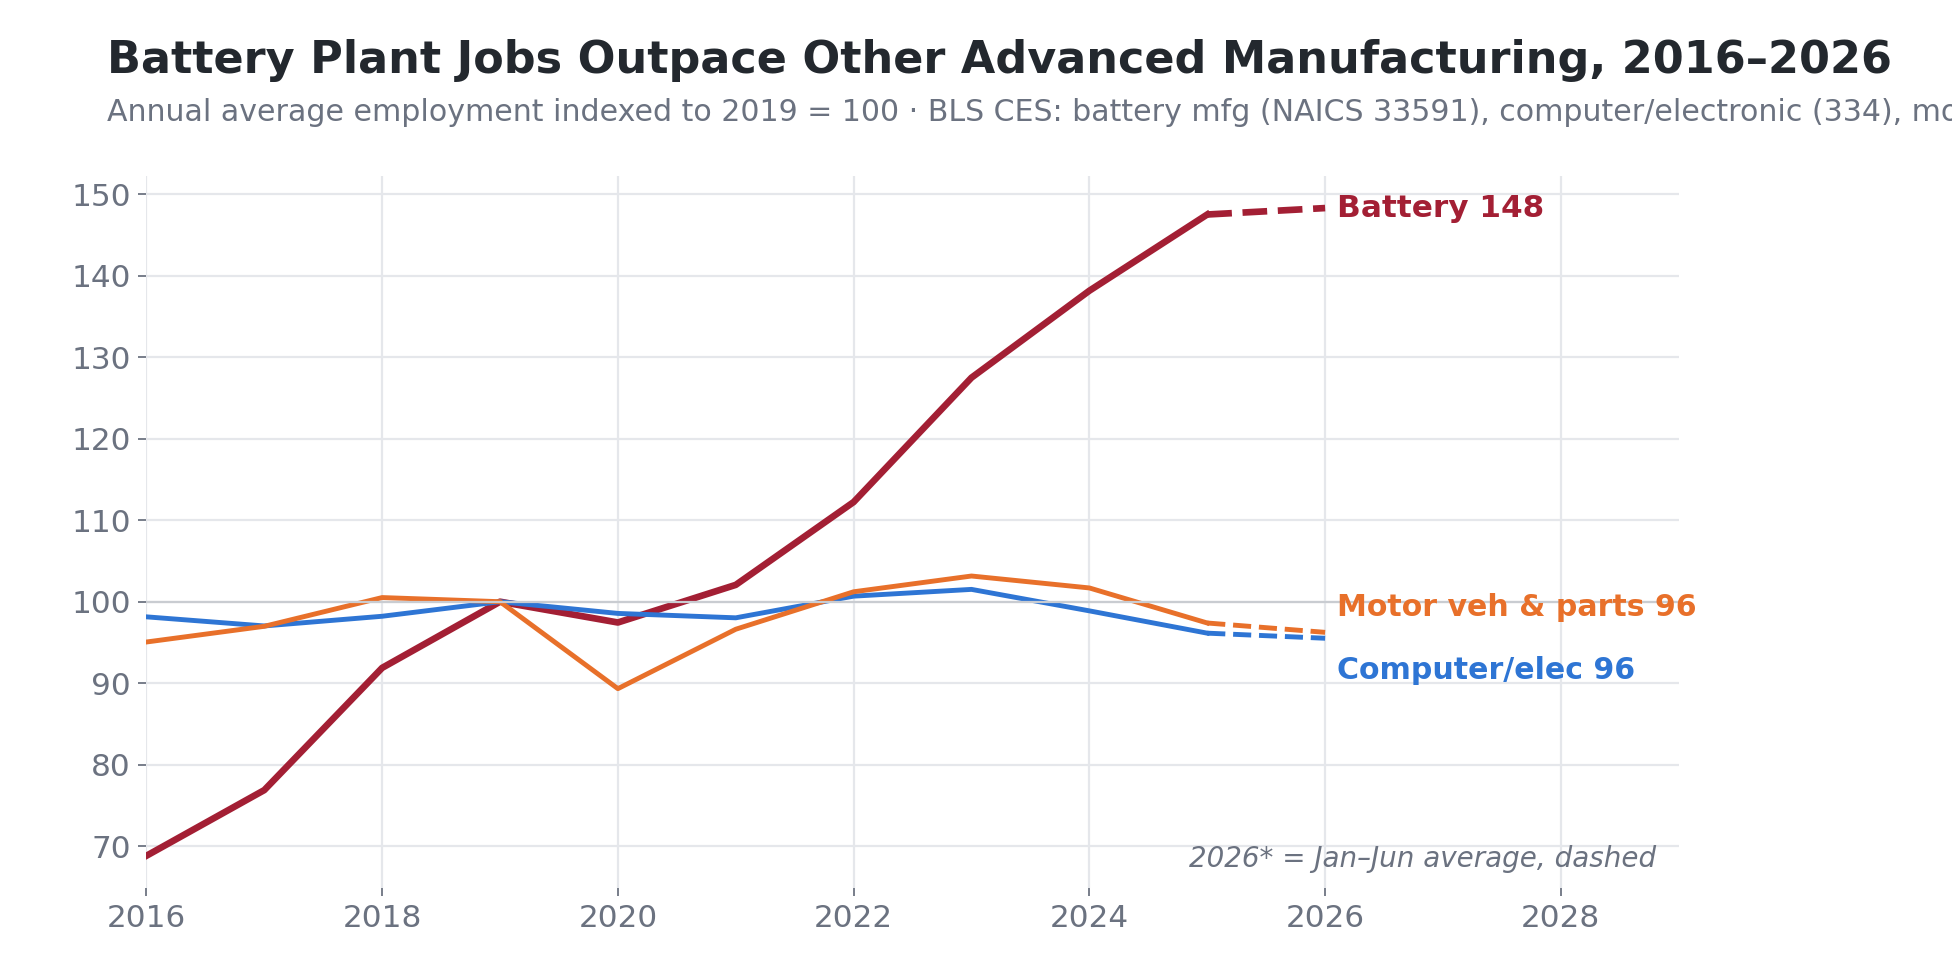
Employment, 2016–2026, annual average indexed to 2019 = 100. 2026* = Jan–Jun average. Battery manufacturing (NAICS 33591), computer/electronic (334), motor vehicles & parts.[10] | Chart: CRE42
Data Centers: Fastest Growing Industrial Sector, NOT Counted as Manufacturing
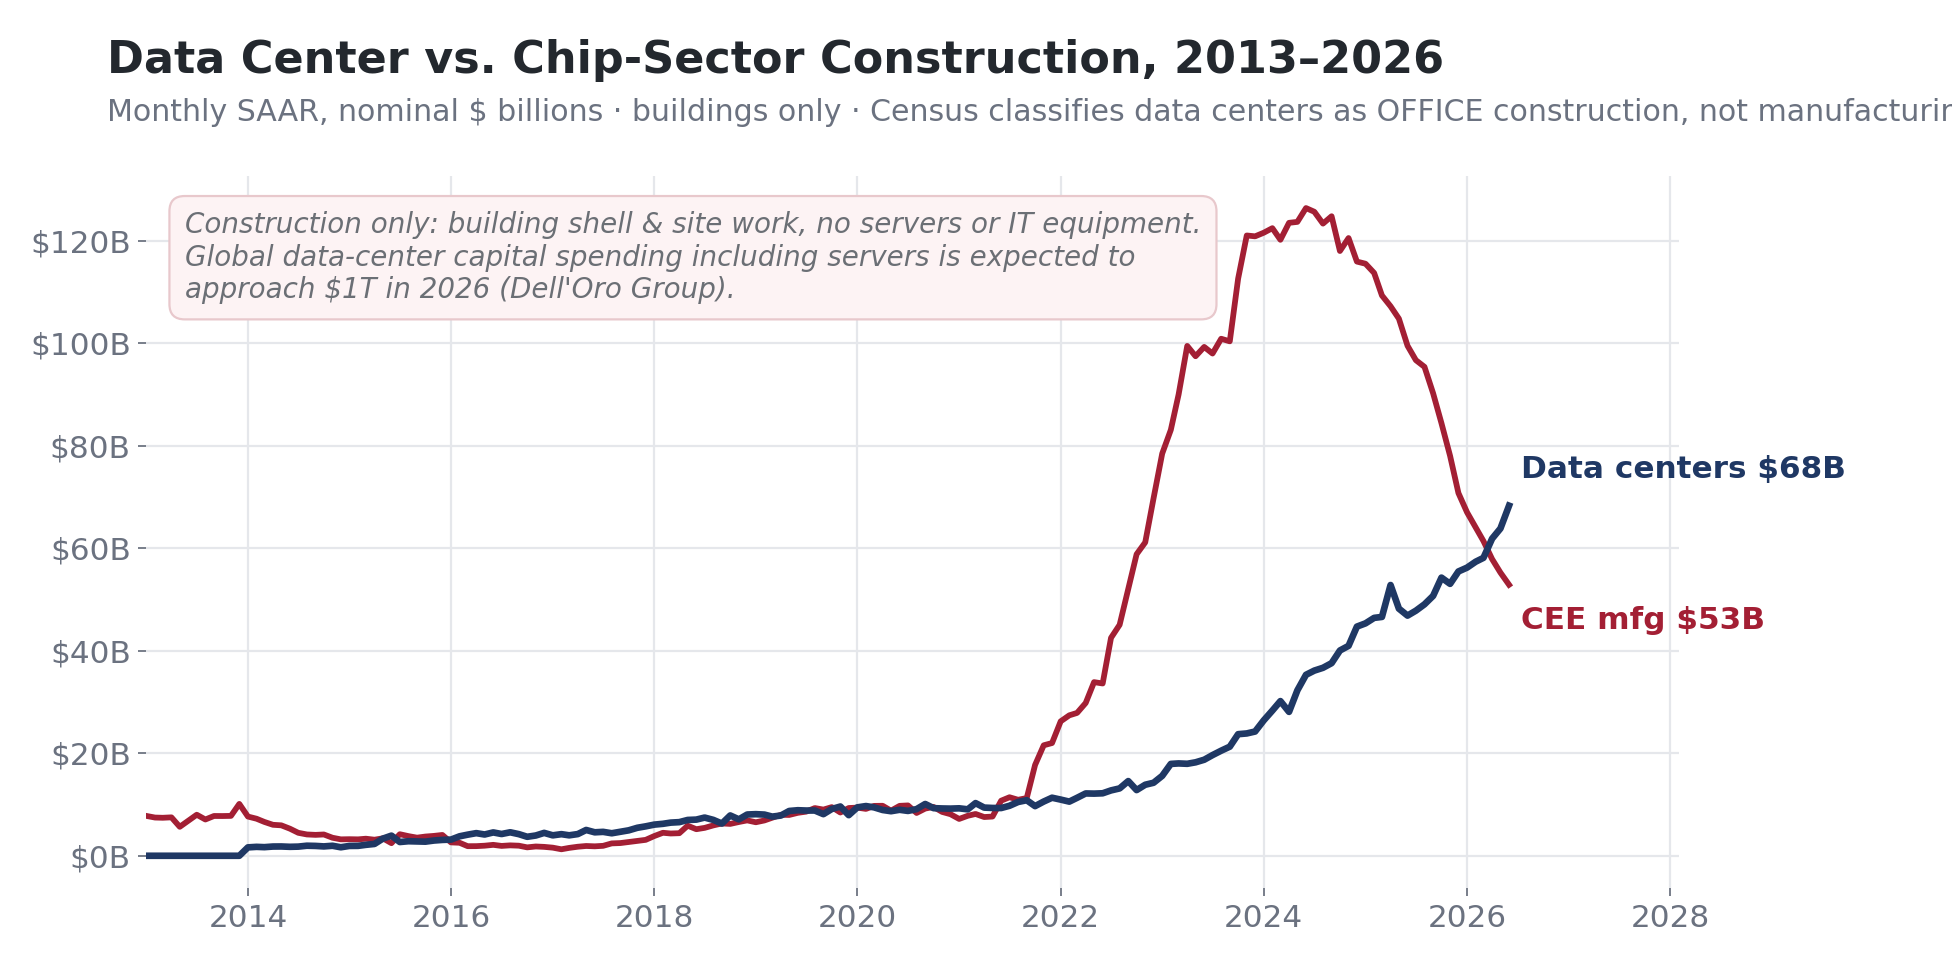
Data Center vs. Chip-Sector Manufacturing Construction, 2013–2026: monthly SAAR, nominal $ billions, buildings only. Data centers are classified by Census as office construction and appear in no manufacturing statistic.[1] | Chart: CRE42
Data Centers
- Global data center capital spending is expected to approach $1T in 2026, on its way to a forecast $1.7T by 2030; the four largest U.S. hyperscalers alone have guided to roughly $700B of 2026 capital spending. Most of that total is servers and IT equipment rather than buildings; the $68B construction line above is the U.S. building shell only (see Methodology).[11]
- Data centers do not require a large permanent employee base: a hyperscale campus generates roughly 75 permanent jobs per $1 billion invested, about the same as a leading-edge fab and one-ninetieth of a distribution center.[6]
- None of it appears in manufacturing statistics: Census classifies data centers under office construction. The capital-over-labor pattern of this page is repeating one category over, at larger scale. See the Data Centers section for capacity, power, and demand detail.
What to Watch For in 2026 and Beyond
Sources to Track the Manufacturing Construction Boom in 2026:
| Source | Report or Series | Frequency | Notes |
|---|---|---|---|
| U.S. Census Bureau | Construction Spending (C30), manufacturing and office/data center lines | Monthly, ~1st business day | The boom's pulse; CEE vs. ex-CEE split and the data-center line |
| Clean Investment Monitor | Quarterly U.S. clean investment update | Quarterly | Battery and clean-tech facility investment, announcements, cancellations |
| Bureau of Labor Statistics | CES employment: NAICS 334 and 33591 | Monthly | Whether fab ramp-ups and battery plants show up as jobs |
| Federal Reserve | G.17 Industrial Production, NAICS 334 and motor vehicles | Monthly | Whether the finished fabs show up as output |
| CHIPS Program Office | Award and milestone announcements | Ongoing | Disbursement pace against announced awards |
| Reshoring Initiative | Reshoring + FDI job announcements | Annual, with quarterly updates | Announced jobs (244K in 2024) vs. realized hiring; 2025 stalled on tariff uncertainty |
Footnotes
- U.S. Census Bureau, Construction Spending (C30), Value of Private Construction Put in Place, seasonally adjusted annual rate; manufacturing total, computer/electronic/electrical, and office/data center lines. August 3, 2026 release, retrieved August 2026. ↩
- U.S. Census Bureau, Construction Spending (C30), manufacturing construction by Census region, annual through 2025. Retrieved August 2026. ↩
- U.S. Bureau of Labor Statistics, Current Employment Statistics, total manufacturing employment (MANEMP via FRED), through June 2026. ↩
- U.S. Bureau of Labor Statistics, Current Employment Statistics, computer & electronic products, NAICS 334 (CES3133400001 via FRED), through June 2026. ↩
- Federal Reserve Board, G.17 Industrial Production: total manufacturing (IPMAN), computer & electronic products (IPG334S), motor vehicles & parts (IPG3361T3S), via FRED, through June 2026. Real (quality-adjusted quantity) indexes. ↩
- Company and state press announcements, 2022–2025 (Samsung/Texas; TSMC March 2025 expansion; Micron New York; Intel Ohio; Toyota North Carolina; Ford/SK BlueOval SK; Panasonic/Kansas; Hyundai/Georgia), plus industry reference points for a traditional auto assembly plant, regional distribution center, and hyperscale data center campus. All figures pending verification against primary announcements before deploy. ↩
- U.S. Census Bureau, Annual Survey of Manufactures, 2021 (ASM Benchmark 2022, table AM2231GS1): payroll, production-worker wages, value added, and employment by NAICS industry. ↩
- U.S. Census Bureau, Annual Survey of Manufactures (2013–2016, 2018–2021) and Economic Census (2012, 2017), payroll and value added by NAICS industry, via Census API. Retrieved August 2026. ↩
- U.S. Bureau of Labor Statistics, Productivity and Costs, manufacturing sector labor share index, 1987–2022 (PRS30006173). ↩
- U.S. Bureau of Labor Statistics, Current Employment Statistics, battery manufacturing, NAICS 33591 (CES3133591001), computer & electronic products (334), and motor vehicles & parts, through June 2026. ↩
- Dell'Oro Group, "AI Boom Drives Data Center Capex to $1.7 Trillion by 2030," press release, 2026: global data center capex "expected to approach $1 trillion in 2026," with accelerated servers approximately two-thirds of total infrastructure spending by 2030. Hyperscaler 2026 guidance: Microsoft, Amazon, Alphabet, and Meta quarterly earnings releases, Q4 2025–Q1 2026 (roughly $700 billion combined). These capex figures are worldwide and include servers and IT equipment; they are not comparable to the Census C30 U.S. construction line. ↩
Sources
- U.S. Census Bureau, Construction Spending (C30), Value of Private Construction Put in Place, seasonally adjusted annual rate, August 3, 2026 release (census.gov/construction/c30): manufacturing total, computer/electronic/electrical, office/data center, and regional detail. Retrieved August 2026.
- U.S. Bureau of Labor Statistics, Current Employment Statistics via FRED: manufacturing total (MANEMP), computer & electronic products (CES3133400001), battery manufacturing (CES3133591001), motor vehicles & parts (CES3133600101), and subsector series. Retrieved August 2026.
- Federal Reserve Board, G.17 Industrial Production via FRED: total manufacturing (IPMAN), computer & electronic products (IPG334S), motor vehicles & parts (IPG3361T3S), and segment series. Real (quality-adjusted quantity) indexes. Retrieved August 2026.
- U.S. Census Bureau, Annual Survey of Manufactures and Economic Census: payroll, production-worker wages, value added, and employment by NAICS industry, 2012–2021 (ASM Benchmark 2022 table AM2231GS1; timeseries/asm/industry and ecnbasic APIs). Retrieved August 2026.
- U.S. Bureau of Labor Statistics, Productivity and Costs: manufacturing sector labor share index, 1987–2022 (PRS30006173). Retrieved August 2026.
- Rhodium Group and MIT CEEPR, Clean Investment Monitor, U.S. Q1 2026 Update.
- Company and state announcements for project investment and job figures: Samsung/State of Texas; TSMC (March 2025 expansion); Micron New York fact sheet; Intel Ohio; Toyota North Carolina; Ford/SK BlueOval SK; Panasonic/State of Kansas; Hyundai/Georgia Department of Economic Development, 2022–2025. Figures pending verification against primary announcements before deploy.
- Reshoring Initiative, 2024 Data Report and 1Q2025 update (reshorenow.org).
- Dell'Oro Group, "AI Boom Drives Data Center Capex to $1.7 Trillion by 2030," press release, 2026 (delloro.com); Microsoft, Amazon, Alphabet, and Meta earnings releases and capital-expenditure guidance, Q4 2025–Q1 2026.