
Data Centers
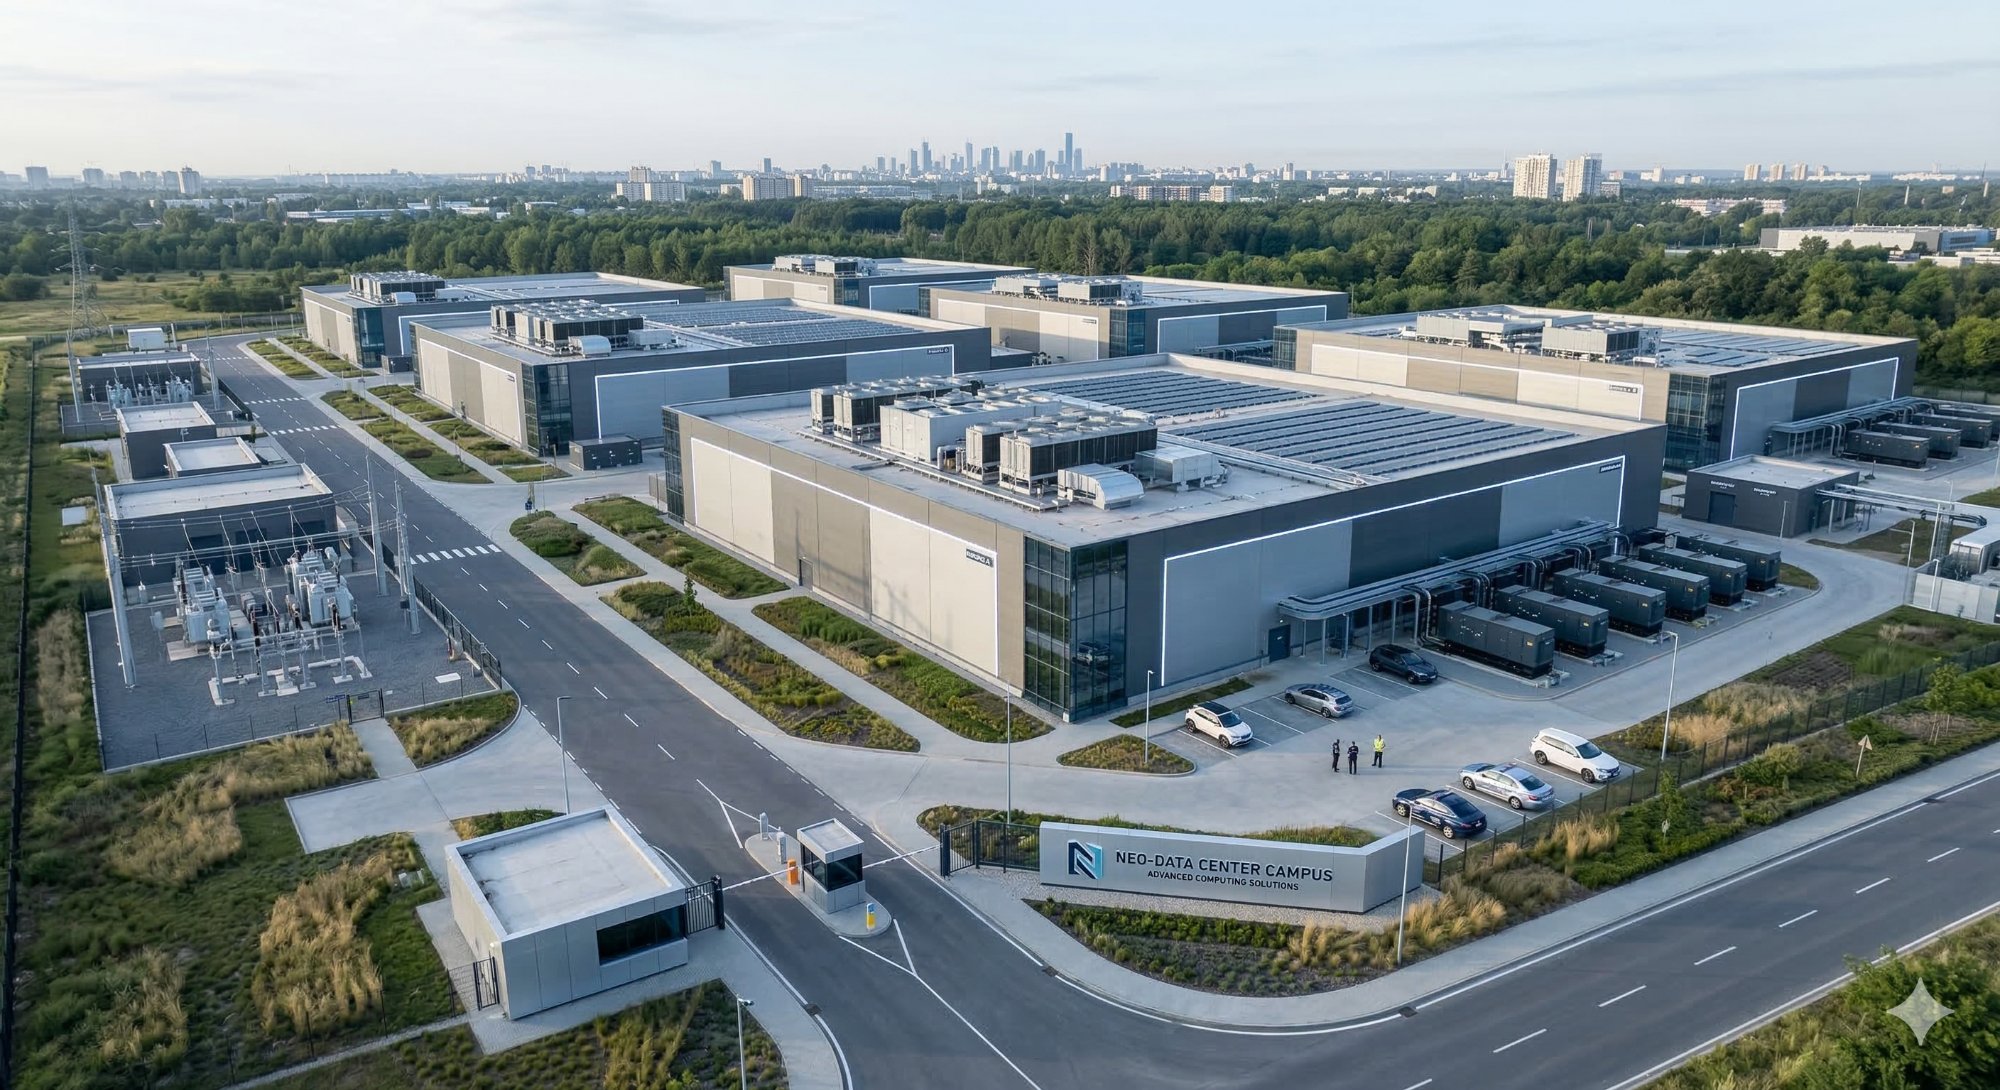
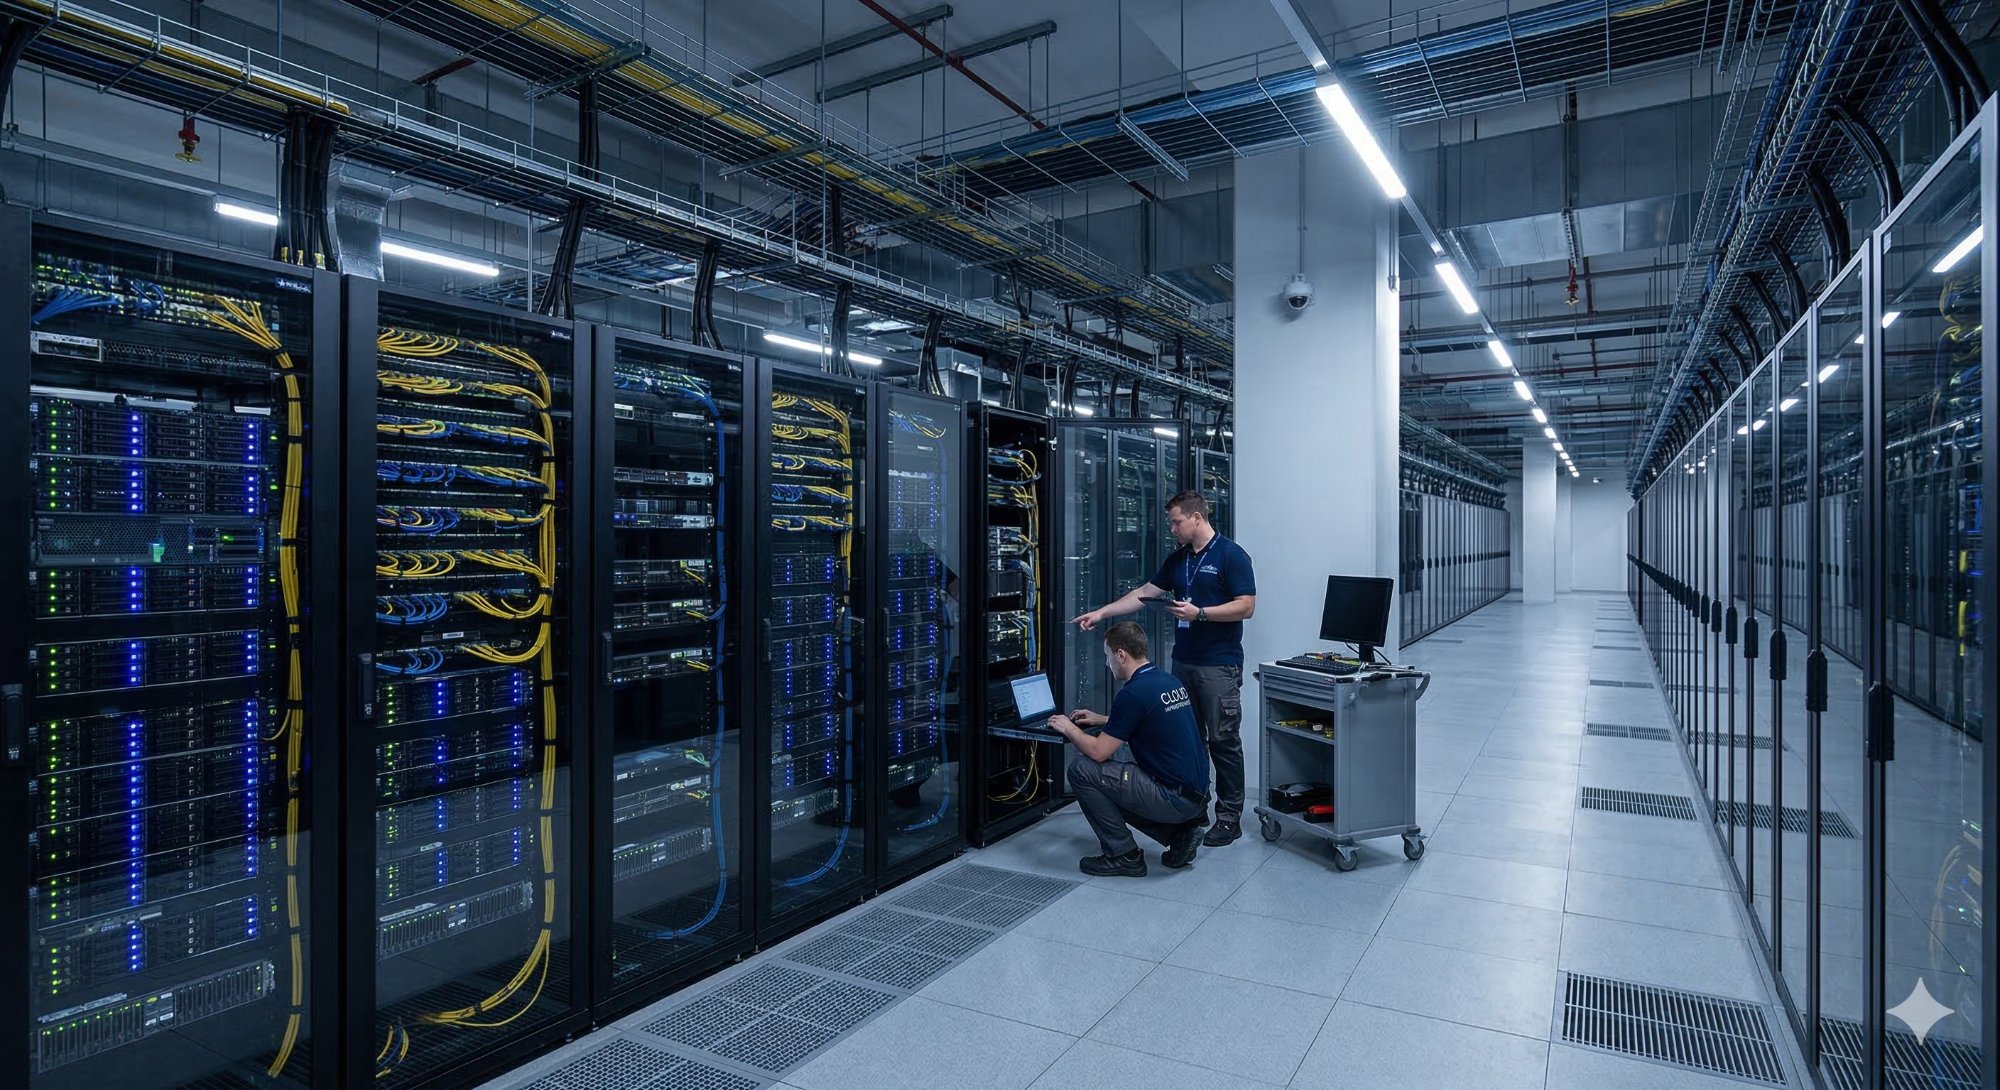
The buildout of AI and cloud data centers is now large enough to show up in the government’s own statistics rather than only in company announcements. Alphabet, Amazon, Meta and Microsoft have guided to roughly $720 to 745 billion of capital spending for 2026, most of it chips and servers; construction put in place on U.S. data center buildings reached a $75 billion annual rate in July 2026, up 57 percent in a year.
The data center construction boom will likely finish as the largest cumulative capex boom in U.S. history, but it is currently facing headwinds. Capacity auctions run by PJM, the largest U.S. grid operator, have come up short of the region’s reliability requirement in three consecutive auctions and cleared at the price cap each time, pointing to higher electricity bills and strain on the grid, and recent polls show the majority of Americans say they would oppose a data center in their own community.
This section will help us understand the wide gap in scale between data center projects that have been announced versus budgeted, started and built; put the spending against the largest capital programs in American history; follow the power demand into the grid; and track the political response.
Key Data Sources & Research
www.census.gov - Construction Spending (value put in place, data center category); international trade data by harmonized code
eta.lbl.gov - United States Data Center Energy Usage Report, 2025 Update
www.eia.gov - Short-Term Energy Outlook; Electric Power Monthly
www.pjm.com - Base Residual Auction results
www.iea.org - Electricity Mid-Year Update 2026
Alphabet, Amazon, Meta and Microsoft 10-K filings and quarterly earnings materials (capital expenditure, guidance, assets by geography)
www.cushmanwakefield.com - Data Center Development Cost Guide 2026
www.annenbergpublicpolicycenter.org - Survey of opposition to local data centers, June to July 2026