After two decades of essentially flat U.S. electricity demand (approximately 0.1% annual growth from 2005 to 2020), total demand is now accelerating at roughly 2% annually. While 2% growth may not sound like a lot in the context of economic growth numbers, planning and building electrical generation capacity requires extensive time and capital, and it is possible that the U.S. has lost its ability to scale up quickly after so many years of minimal growth. The primary power demand drivers include data center expansion, manufacturing reshoring, and broader electrification. The implications of the currently evolving power demand boom extend beyond the energy sector: rising electricity costs affect operating expenses across all commercial real estate property types, and power availability has become the primary constraint on data center site selection and development timelines.
U.S. Electricity Demand vs. Generation Capacity, 2005–2030
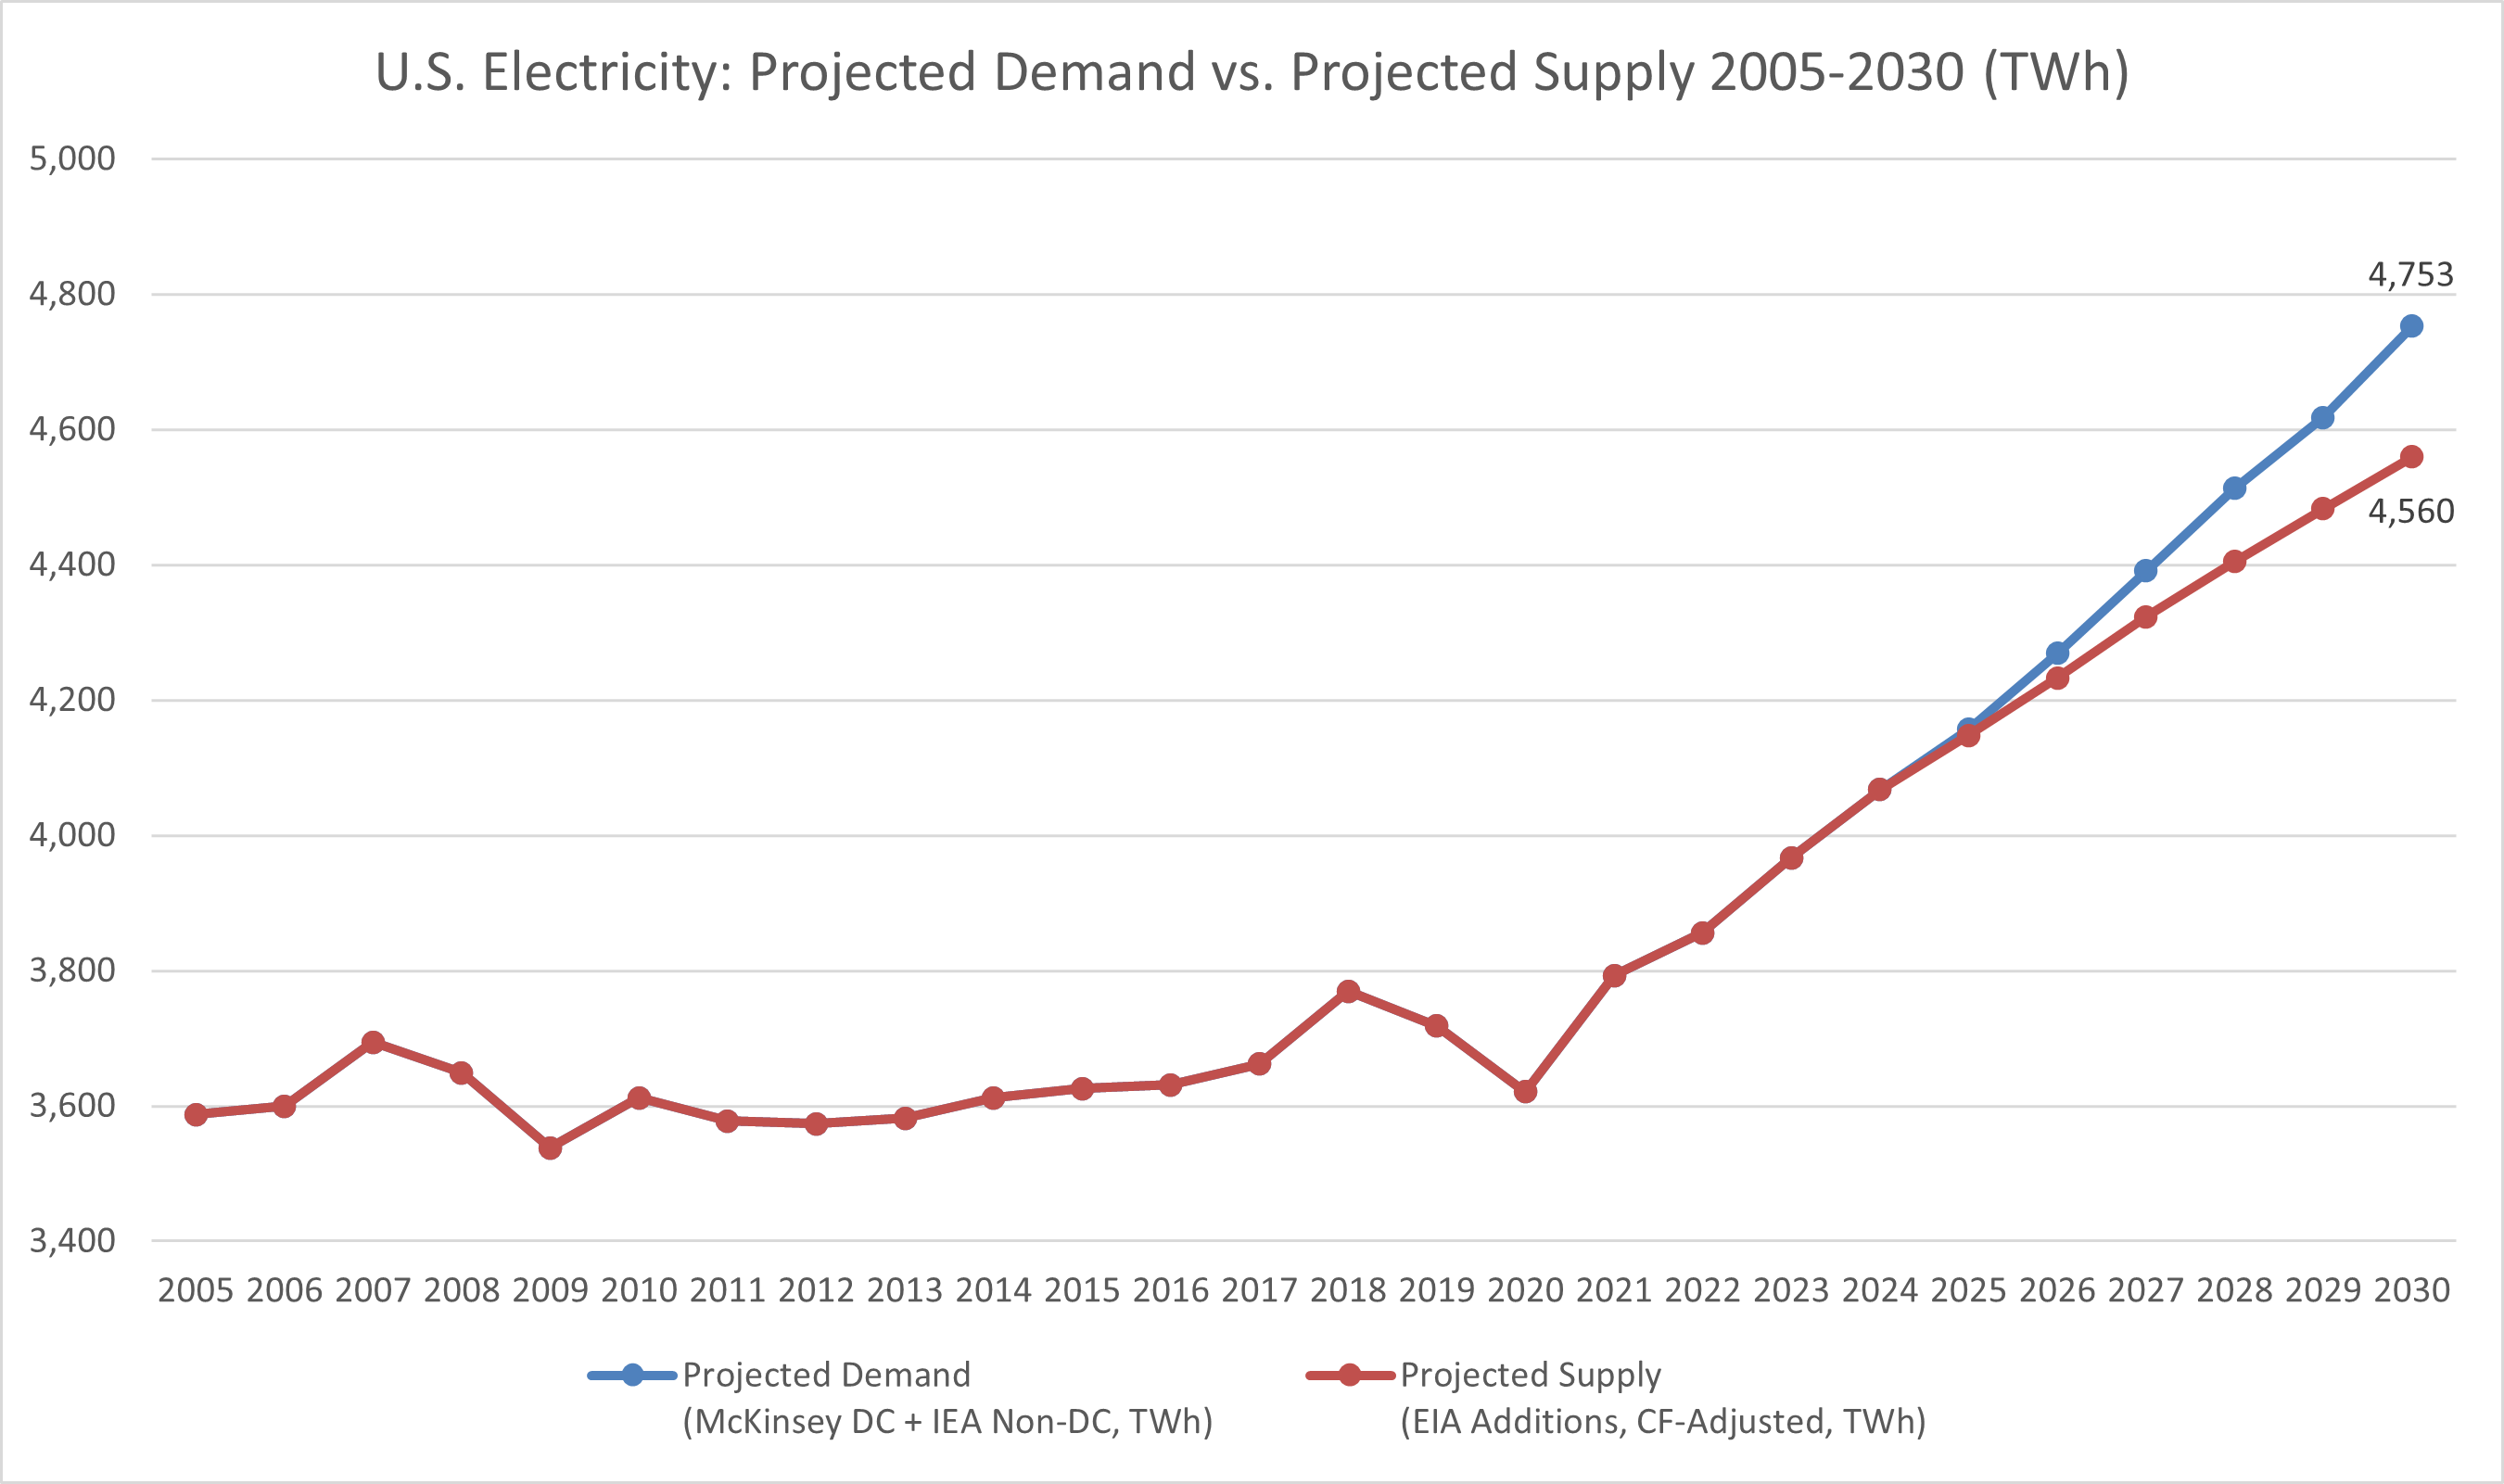
U.S. electricity demand vs. supply capacity (TWh). Demand line combines IEA non-data-center forecast with McKinsey data center projections. Supply line converts EIA planned capacity additions to deliverable TWh at fuel-specific capacity factors. Chart data: CRE42 Data Center Spreadsheet, “Supply vs Demand” tab. Analysis: CRE42.com
Document Links
data-centers-demand-vs-supply.xlsx — Chart data (Supply vs Demand tab), U.S. DC demand forecasts by source, capacity factor reference, GW-to-TWh conversion methodology, source documentation
Key Observations
Context & Discussion
The Range of Estimates
Forecasts for U.S. data center electricity consumption by 2030 vary widely, ranging from approximately 212 TWh (EPRI low case) to 606 TWh (McKinsey). The IEA projects roughly 423 TWh; LBNL/DOE estimates 325–580 TWh by 2028; Goldman Sachs implies approximately 368 TWh; and BCG’s moderate scenario yields about 390 TWh. This dispersion reflects genuine uncertainty about AI adoption rates, hardware efficiency gains, and whether announced hyperscaler spending commitments will be fully executed. The chart above uses McKinsey’s projection as the demand case because it provides the most complete analytical framework for cross-validation.
Current Power Capacity Shortfall
The most concrete evidence of near-term supply stress comes from PJM Interconnection, the largest U.S. grid operator, which manages the power grid for 67 million customers across 13 states from Virginia to Illinois. Every few years, PJM holds a capacity auction in which power plant owners bid to guarantee they will have enough electricity available to meet future demand. The price that clears in this auction is a direct signal of how tight the supply-demand balance is expected to be.
In December 2025, PJM’s capacity auction price surged from approximately $29/MW-day (for the 2024/25 delivery year) to $333/MW-day (for 2027/28)—an increase of more than 10× in three auction cycles. The auction also produced a 6,623 MW reliability shortfall, the first time PJM’s entire region fell below its reliability target. Data center load accounted for roughly 40% of auction costs (Monitoring Analytics). PJM projects 32 GW of peak demand growth by 2030, with nearly all of it attributable to data centers.
The price signal from PJM is significant for two reasons. First, capacity auction prices flow directly into electricity bills for residential and commercial customers across the region. Second, PJM is a leading indicator for other grid operators: if the largest, most liquid U.S. power market is hitting price caps and falling short of reliability targets, similar dynamics are likely to emerge in regions with comparable data center concentration, including ERCOT (Texas) and the Southeast. Goldman Sachs estimates approximately 82 GW of new capacity is needed nationally to meet data center demand, with roughly 60% requiring new-build generation. Lead times for new gas-fired plants run 3–7 years; nuclear is 7–10+ years.
Potential Overbuilding Response
Not all analysts agree the shortage will persist at current projections. Utilities and power analyst Andy DeVries (Co-Head U.S. Investment Grade Credit at CreditSights) argues that utilities may be overestimating data center power demand and building more capacity than will ultimately be needed, with ratepayers potentially absorbing the cost of underutilized infrastructure. His analysis focuses on the gap between announced data center plans and actual power contracts, suggesting that current utility planning may prove sufficient to meet realized demand.
EIA data shows substantial capacity additions underway. Solar dominates near-term grid-connected additions, with roughly 37 GW of utility-scale solar expected online in 2026 alone. However, a significant wave of natural gas generation is also being built, much of it behind the meter (on-site at data centers, bypassing the grid). According to Global Energy Monitor, U.S. gas-fired capacity in development nearly tripled in 2025 to approximately 252 GW, with over one-third slated to power data centers directly. Most of these gas plants have 3–7 year lead times and will come online in the late 2020s and early 2030s. AI efficiency gains—model distillation, more efficient chips, inference optimization—could also reduce per-query power consumption, potentially slowing demand growth below current projections. Some coal plant retirements have already been delayed in response to tighter markets: 3.6 GW of planned 2025 retirements were postponed.
Note: Solar and wind additions must be evaluated on a capacity-factor-adjusted basis. At typical capacity factors (solar ~25%, wind ~35%), 37 GW of new solar nameplate capacity translates to approximately 9–10 GW of firm-equivalent generation—compared with 85–93% capacity factors for gas and nuclear plants. See Methodology for conversion details.
Supply vs. Demand: Regional Variation and Time Horizon
Both the shortage and overbuilding arguments contain valid elements, and may prove correct simultaneously—in different regions and over different time periods. The near-term crunch in constrained markets is documented by actual auction prices and utility filings, not projections. Georgia Power reported that data centers will account for 83% of new large-customer electricity demand through 2037. In Texas, CenterPoint Energy reported a 700% increase in large-load interconnection requests between late 2023 and late 2024. PJM’s December 2025 auction fell 6,623 MW short of its reliability target.
Nationally, however, the longer-term outcome depends on genuinely uncertain variables: the pace of AI adoption, efficiency gains in AI hardware and models, permitting reform timelines, political decisions about generation mix (gas vs. renewables vs. nuclear), and whether hyperscalers follow through on announced capital expenditure plans. The four major hyperscalers are projected to spend approximately $700 billion on AI build-outs in 2026—but that figure represents guidance, not committed contracts.
For CRE investors, the practical consequence is already visible: power availability has replaced land availability as the primary site selection variable for data center development. Rising electricity costs are flowing into operating expenses across all property types, from data centers to hospitals to grocery stores. Whether the supply-demand gap widens or narrows, the period of adjustment will be measured in years, not quarters.
📈 Goldman Sachs: Electricity Prices & Consumer Impact (February 2026)
U.S. electricity prices rose 6.9% in 2025, more than double the 2.9% headline inflation rate. Utilities requested a record $31 billion in rate increases in 2025—more than twice the $14 billion requested in 2024. Goldman Sachs estimates that electricity price inflation will add approximately +0.1 percentage points to core inflation in both 2026 and 2027, and create a roughly 0.2% drag on consumer spending as households absorb higher utility bills.
Data centers now account for an estimated 40% of incremental U.S. electricity demand growth, though they represent a much smaller share of total consumption (~5%). Approximately 72% of U.S. data centers are concentrated in counties representing just 1% of U.S. land area, intensifying regional price pressure. The four major hyperscalers are projected to spend approximately $700 billion on AI infrastructure in 2026.
Source: Goldman Sachs Research. “Higher Electricity Prices and the Consumer Impact.” February 12, 2026.
What to Watch in 2026
Sources
1. Goldman Sachs Research. “Higher Electricity Prices and the Consumer Impact.” February 12, 2026. Electricity prices +6.9% in 2025; $31B rate increase requests; +0.1% core inflation impact; DC = 40% of demand growth; $700B hyperscaler capex projected for 2026.
2. IEA. Electricity Mid-Year Update 2025. July 2025. U.S. demand: ~2.3% annual growth; DC consumption: 180 TWh (2024), +240 TWh by 2030.
3. IEA. Electricity 2025. February 2025. U.S. demand revised upward ~100 TWh vs. prior forecast.
4. McKinsey & Company. “AI’s Power Binge.” November 2024. U.S. DC demand: 147 TWh (2023) to 606 TWh (2030).
5. PJM Interconnection. 2027/2028 Base Residual Auction Results. December 17, 2025. Cleared at $333.44/MW-day cap; 6,623 MW reliability shortfall.
6. Monitoring Analytics. PJM State of the Market Report. November 2025. Data centers = 40% of capacity auction costs.
7. U.S. Energy Information Administration (EIA). Short-Term Energy Outlook. January 2026. ~64 GW planned capacity additions (2025); solar leading.
8. U.S. Energy Information Administration (EIA). Electric Power Monthly, Tables 6.07A and 6.07B. Capacity factors by fuel type and technology. eia.gov/electricity/monthly
9. EPRI. “Powering Intelligence.” May 2024. U.S. DC demand: 4.6–9.1% of generation by 2030 (~212–419 TWh).
10. Lawrence Berkeley National Laboratory / DOE. “U.S. Data Center Energy Usage Report.” December 2024. 325–580 TWh by 2028; 50% fleet utilization standard.
11. American Action Forum. “Emergency Energy Auction to Prevent Data Center-Driven Rate Increases.” January 2026. Trump administration / 13-governor PJM agreement.
12. Andy DeVries / Bloomberg Odd Lots. “The Utilities Analyst Who Says the Data Center Demand Story Doesn’t Add Up.” February 2026.
13. Global Energy Monitor. Global Oil and Gas Plant Tracker. January 2026. U.S. gas-fired capacity in development nearly tripled in 2025 to ~252 GW; >1/3 linked to data centers.
14. Grid Strategies. National Load Growth Reports. Utility demand forecast revisions and transmission needs.
15. CBRE, JLL, Cushman & Wakefield. Data Center Outlook Reports (semi-annual). Market-level vacancy, pricing, and construction pipeline data.
Methodology
Demand Projection
Total U.S. electricity demand is constructed by combining IEA non-data-center demand forecasts (which include residential, commercial, and industrial load growth from EVs, manufacturing, population, etc.) with data center demand projections. McKinsey’s 606 TWh by 2030 estimate is used as the primary demand case; IEA’s ~423 TWh (183 TWh 2024 baseline + ~240 TWh incremental) represents a lower scenario. Historical data (2005–2024) uses EIA actual generation figures.
Supply Projection
Total U.S. generation capacity is converted from nameplate GW to deliverable TWh using fuel-specific capacity factors: solar (~25%), wind (~35%), natural gas combined cycle (~57%), natural gas peaker (~12%), nuclear (~93%), hydroelectric (~40%), coal (~40%). These are rounded approximations of the annual average capacity factors published by the U.S. Energy Information Administration in Tables 6.07A and 6.07B of the Electric Power Monthly. EIA’s 2024 published actuals include 23% for solar, 34% for wind, and approximately 57% for natural gas combined cycle. Net additions (new capacity minus retirements) are based on EIA data for planned additions and scheduled retirements through 2030. This approach accounts for the significant difference between nameplate capacity and actual electricity delivered. The supply projection is a CRE42 construction—not sourced from a single authority—and is clearly labeled as such.
Nameplate vs. Firm-Equivalent Capacity
“Nameplate capacity” is the maximum output a generator can produce under ideal conditions. Actual output depends on fuel availability, weather (for renewables), maintenance schedules, and dispatch economics. The ratio of actual output to theoretical maximum is the “capacity factor.” When evaluating whether new supply can meet new demand, using nameplate GW overstates the contribution of intermittent sources (solar, wind) and understates the contribution of dispatchable sources (gas, nuclear). This page converts all supply figures to TWh at source-specific capacity factors for comparability.
Data Center GW-to-TWh Conversion
Uses LBNL’s 50% fleet-wide utilization standard (1 GW = 4.38 TWh/year). See the “GW to TWh Conversion” tab in the project spreadsheet for full sourcing and sensitivity analysis. As the data center fleet shifts toward AI-heavy workloads with higher utilization (60–70%+), the blended rate may drift upward—meaning GW-based estimates would convert to higher TWh than the 50% standard implies.