Overview
Three interconnected demographic trends are reshaping U.S. housing demand:
- Declining fertility: The U.S. total fertility rate fell to 1.60 births per woman in 2024, well below the 2.1 “replacement rate”
- Older first-time mothers: The mean age of first-time mothers continues to rise — 27.5 years in 2023, up from 24.2 in 1990
- Older first-time homebuyers: The median age of first-time homebuyers has increased from 28 to 40 since 1990, per NAR survey data*
* Government mortgage data (NY Fed, FHFA) shows median first-time buyer age of 32–33, essentially flat since 2016. The difference reflects survey methodology and the growing share of cash purchases invisible to mortgage data. See chart note and Methodology section below.
Delayed Family Formation Trends (1990–2025)
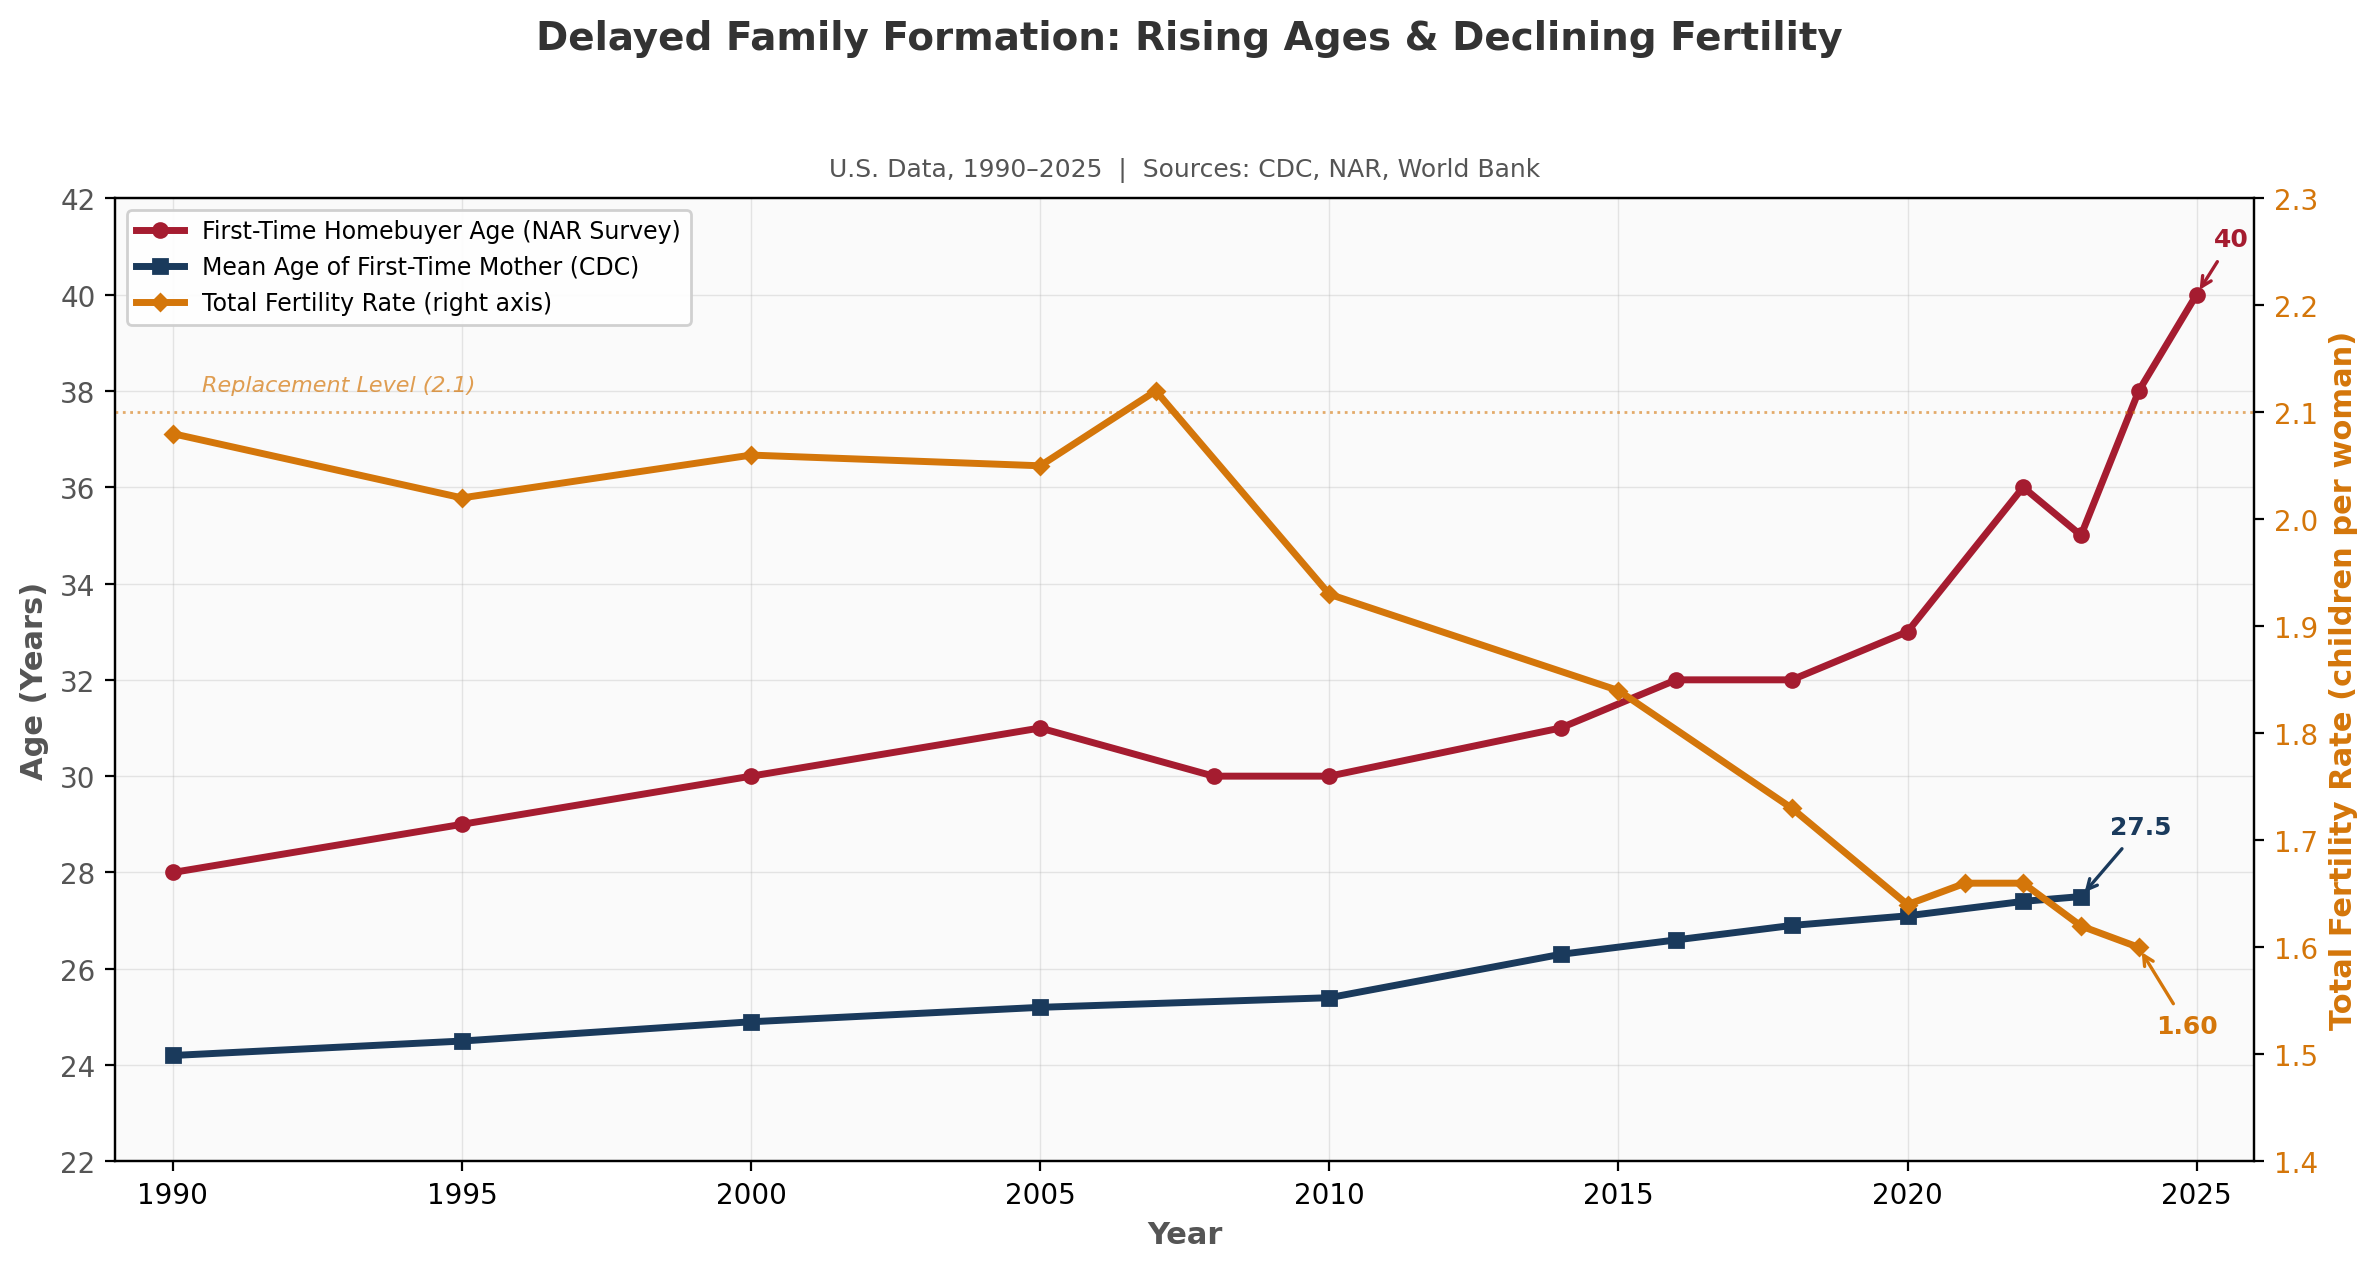
Delayed Family Formation: Rising Ages & Declining Fertility (1990–2025)
Note: NAR first-time homebuyer age data reflects survey methodology with a documented response bias toward older buyers. Government mortgage data (NY Fed, FHFA) shows median first-time buyer age of 32–33, essentially flat since 2016. The 7-year gap between NAR (40) and government (33) data in 2025 reflects fundamental measurement differences — government data tracks mortgage originations only, while NAR surveys capture a broader universe including cash buyers and inheritance recipients. See Methodology section for detailed analysis.
Key Observations
Document Links
demographics-delayed-family-formation.xlsx — Source data, rental-age population projections (zero-immigration scenario), key statistics, and methodology notes
Context & Discussion
Wealth transfers and the bifurcating housing market
An estimated $84–105 trillion in wealth will transfer from the Baby Boomer and Silent generations to their heirs over the coming decades, according to Cerulli Associates and Federal Reserve Survey of Consumer Finances data. Of this total, approximately $17–19 trillion is held in home equity — derived from Federal Reserve Financial Accounts data on homeownership rates and median home equity by age cohort.
This transfer is already reshaping the first-time buyer landscape. The 9% of first-time buyers who pay cash (per NAR’s 2025 survey) represent a population that is largely invisible to government mortgage tracking but fully visible to NAR — and their presence in the NAR sample pulls the reported median age upward. As the Boomer generation ages and mortality rates increase, the pace of wealth transfer will accelerate, and the share of home purchases funded by inheritance or family gifts will likely grow.
The result is a housing market that is bifurcating along wealth lines. On one track, mortgage-dependent first-time buyers — still the majority — face the affordability constraints documented in CRE42’s Home Affordability Crisis analysis: median home prices up 95% from 2011 to 2022, mortgage rates that doubled from 2021 to 2023, and student debt burdens averaging $37,000 per borrower. On the other track, a growing minority of equity-rich buyers can bypass the mortgage system entirely, paying cash and compressing time-to-close in ways that further disadvantage financed buyers in competitive markets. This wealth-driven bifurcation is likely to intensify as the volume of Boomer estate settlements grows over the next decade.
Multifamily demand: extended rental periods
The combined effect of delayed family formation, rising homebuyer ages, and declining fertility creates sustained structural demand for multifamily rental housing. The multifamily demand window has widened at both ends: younger adults are entering rental housing later (as student debt and credential inflation extend education timelines) and exiting later (as homeownership becomes less accessible in their late 20s and early 30s). For the mortgage-dependent majority, government data suggests rental demand remains structurally supported through age 32–33 — essentially unchanged from the prior decade. For the growing cohort priced out of ownership or choosing to delay, rental demand extends well into the mid-to-late 30s. And for individuals in high-cost metros where median home prices far exceed national figures, rental tenures extending into the 40s are increasingly common. The U.S. Demographics page documents how the 72-million-strong Millennial generation, with approximately 46 million currently in the 30–39 age range, creates an estimated 19 million units of additional rental demand beyond what would have existed if homebuying patterns had remained at 2008 levels.[3]
Potential for multifamily demand softening in the 2030s
The structural tailwind supporting multifamily demand is not permanent. The U.S. population aged 20–39 — the prime rental cohort — peaks at approximately 92.8 million around 2028 and then begins declining as the large Millennial birth cohorts (born 1986–1996) age out of this bracket and are replaced by smaller Gen Z and Gen Alpha cohorts born during the post-2010 fertility decline. Under a zero-net-immigration scenario, the 20–39 population declines by approximately 2.4 million from its peak to 2035, with the pace of decline accelerating thereafter as cohorts born at a TFR of 1.6 or below become the primary entrants.[4]
Simultaneously, Boomer mortality will begin releasing single-family housing inventory back into the market. As Boomers move to senior living facilities or pass away, the homes they occupied — many in established suburban neighborhoods with the school access and space that families prioritize — will become available to Millennials who have been renting through their 30s. This combination of freed inventory and easing price pressure could accelerate the transition from rental to ownership, pulling demand forward from the multifamily sector. Gen Z, at approximately 69 million (roughly 4% smaller than the Millennial generation), represents a smaller replacement cohort entering the rental pipeline behind the Millennials. The net effect for multifamily investors: a period of structural demand support through the early 2030s, followed by potential vacancy pressure as the rental-age population contracts and the ownership path becomes more accessible through inherited and freed housing stock. The pace and magnitude of this transition will depend heavily on immigration levels — a variable explored in the U.S. Demographics and Global Demographics tiles.
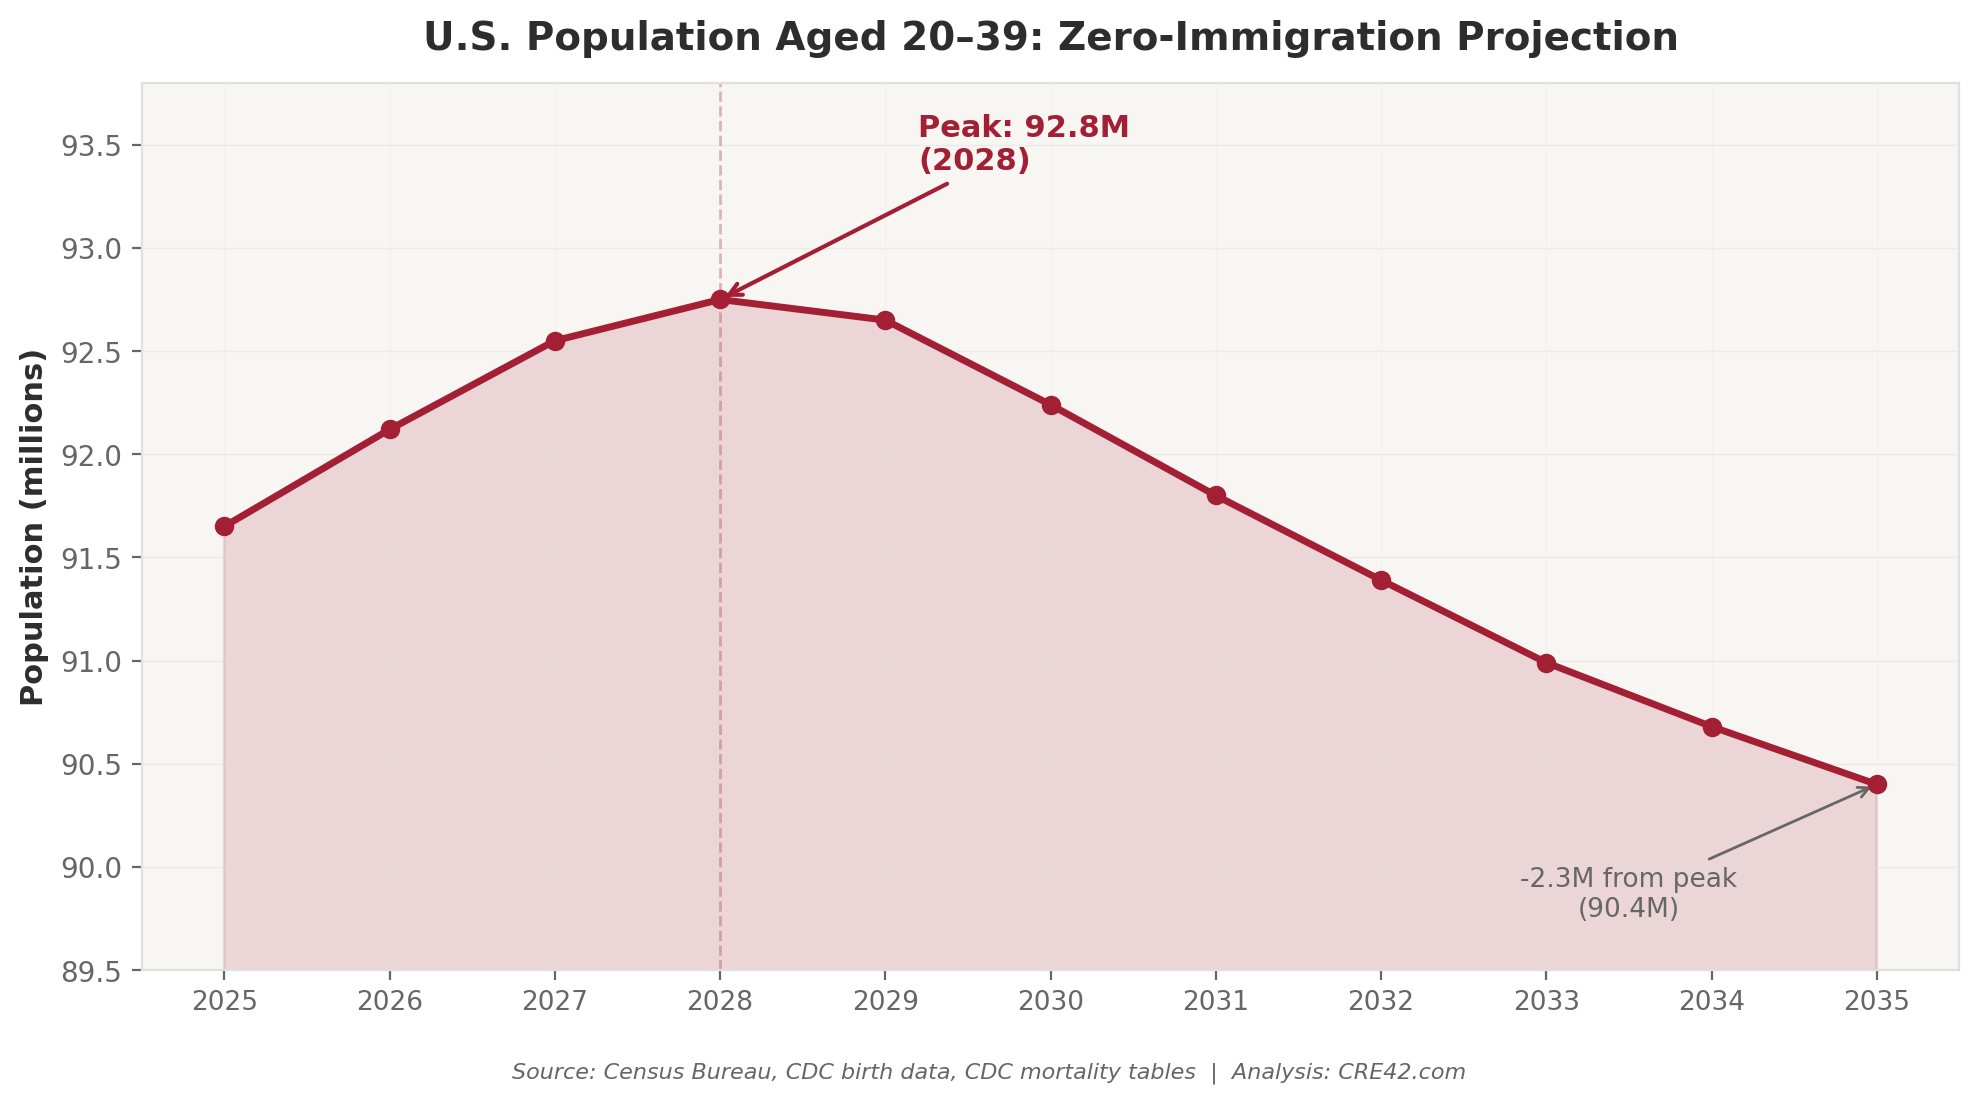
Prime age renter population peaks in 2028* and falls consistently thereafter due to increasingly smaller age cohorts following the Millennial generation
*Assumes zero net immigration and zero deaths
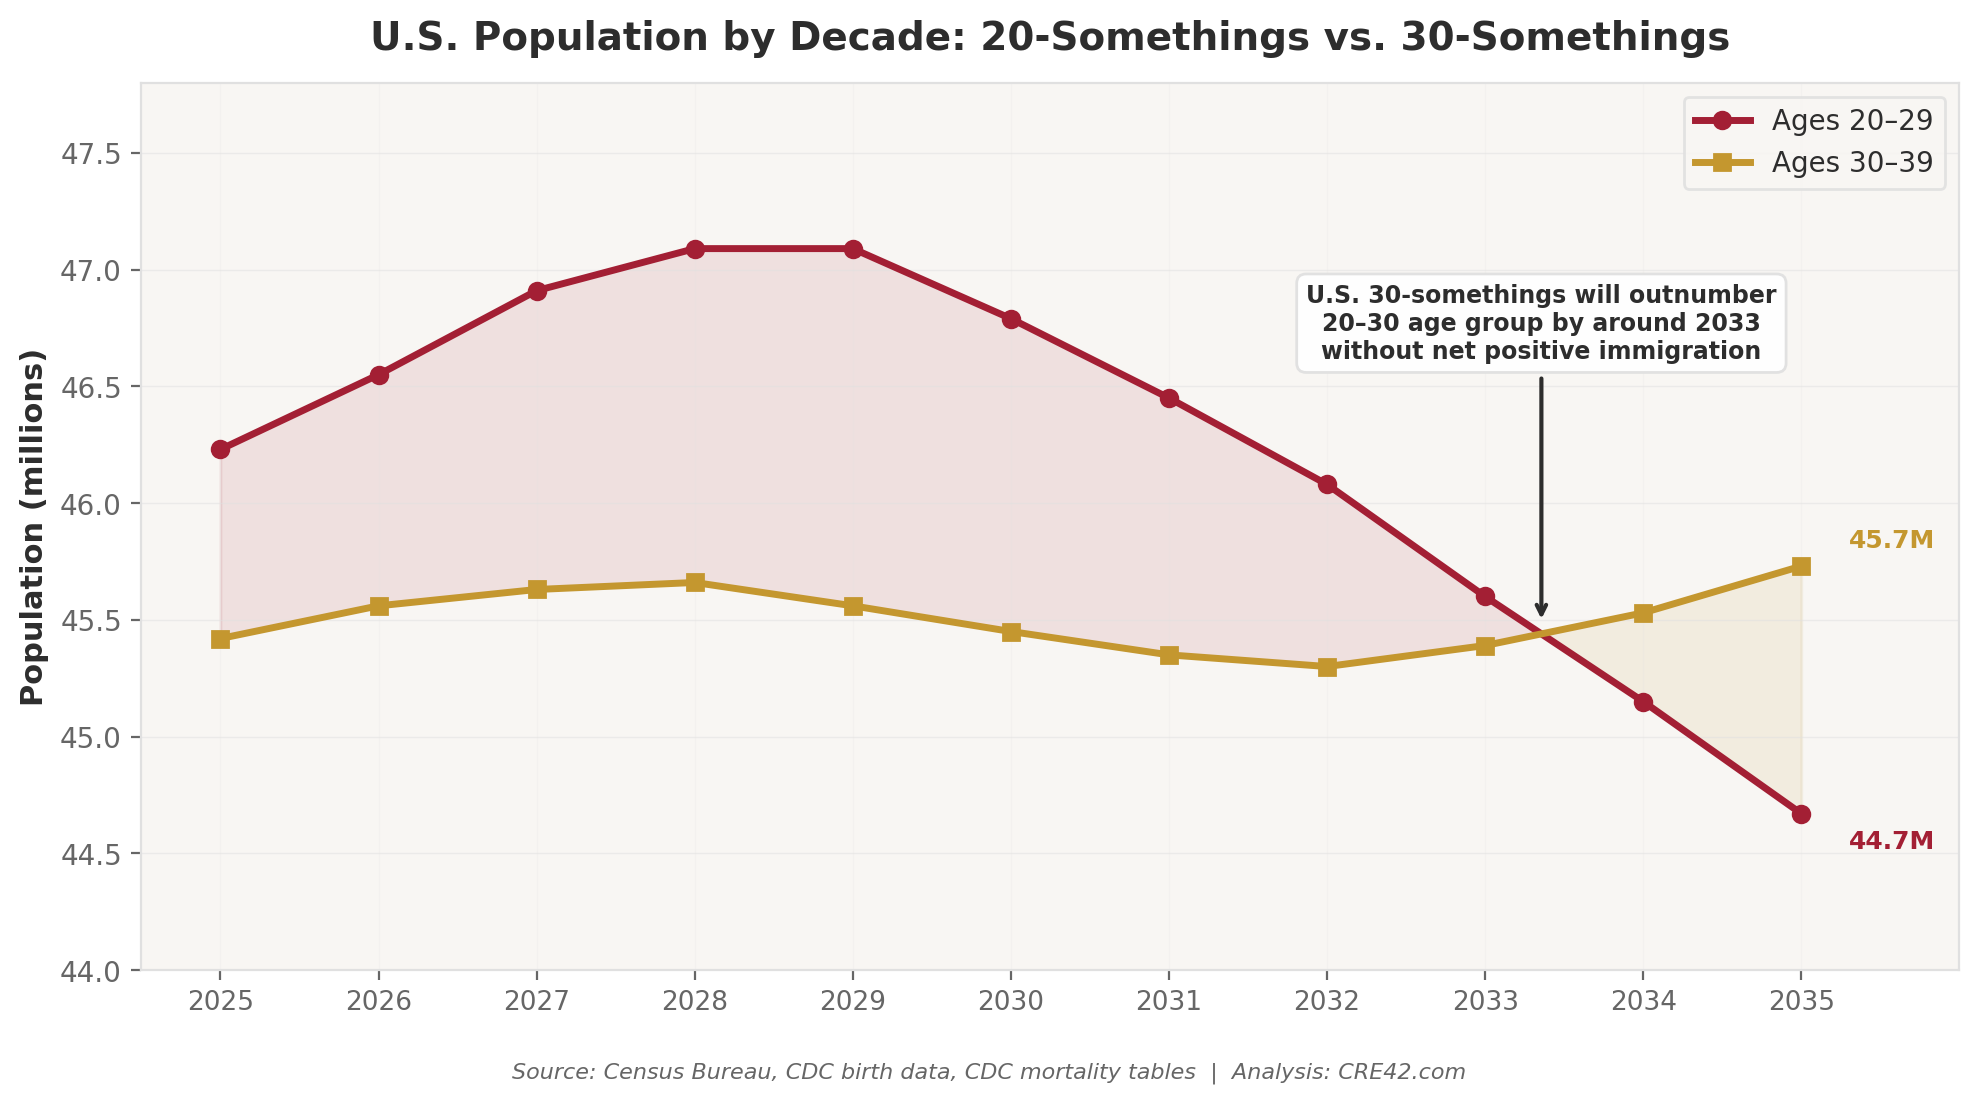
Number of U.S. residents in their 30’s surpasses number of 20-somethings in 2033*
*Assumes zero net immigration and zero deaths
Projections used for charts above assume zero net immigration after 2025 and zero deaths of existing residents as a baseline. In practice, the U.S. has averaged roughly 1 million net immigrants per year over the past decade, though this figure has varied widely — from pandemic-era lows near 250,000 (2021) to a CBO-estimated 3.3 million in 2023. U.S. immigrants during this time period had a median age of 28, adding to the prime renter-age population. While net immigration has slowed sharply since mid-2025 due to policy changes, future levels remain uncertain and could meaningfully offset or delay the demographic declines shown above.
Notes
[1] National Association of Realtors, Profile of Home Buyers and Sellers (2025 edition). Mail survey, ~6,100 respondents. Response rate: 3.5% (6,103 of 173,250 mailed). AEI Housing Center analysis found under-35 buyers underrepresented by 17 percentage points. CRE42 reports both NAR and government figures; see Methodology section for detailed reconciliation. ↩
[2] Wealth transfer estimates: $84–105 trillion total (Cerulli Associates, 2022; Federal Reserve Survey of Consumer Finances). Home equity component: $17–19 trillion (derived from Fed Financial Accounts Z.1 release, Census homeownership rates by age, SCF median home equity by age). Range reflects 20–30 year projection horizon differences. ↩
[3] Rental demand estimate: U.S. population aged 30–39 (~46M) × 0.80 (excluding non-rental arrangements) ÷ 1.9 occupants per unit (NMHC, 2021) ≈ 19.4 million units. See U.S. Demographics page for full methodology. ↩
[4] Zero-immigration rental cohort projection: 2025 baseline derived from CDC birth data + cumulative net immigration through 2025 – mortality. Forward projection ages existing population with CDC age-specific mortality rates. See spreadsheet “Rental Age Projection” tab for full data and methodology. ↩
Methodology & Data Notes
Fertility Rate Data
Total fertility rate (TFR) from CDC National Center for Health Statistics and World Bank. TFR represents the average number of children a woman would have over her lifetime if current age-specific fertility rates remained constant. Replacement level: 2.1 for developed countries. Data available through 2024.
Mean Age of First-Time Mother
CDC NCHS, National Vital Statistics System. Report: Trends in Mean Age of Mothers in the United States, 2016 to 2023 (June 2025). Historical data reconstructed from NCHS reports for 1970–2015 period. Data available through 2023.
NAR vs. Government Homebuyer Age Data: Detailed Reconciliation
The 7-year gap between NAR’s median first-time homebuyer age (40 in 2025) and government mortgage data (32–33) reflects fundamental measurement differences, not statistical noise.
NAR methodology: Annual Profile of Home Buyers and Sellers. Mail-based survey sent to recent purchasers identified through real estate agent transaction records. Approximately 6,100 respondents (2025 edition); response rate 3.5% (6,103 of 173,250 mailed). Self-reported data. AEI Housing Center analysis documents significant age-related response bias: under-35 groups underrepresented by 17 percentage points relative to their share of actual purchase mortgages, while 45–74 groups are overrepresented by 18 points. These biases almost certainly inflate the reported median age. NAR captures a broader universe including cash buyers, inheritance recipients, and those who delayed homeownership to middle age.
Government methodology: NY Fed Consumer Credit Panel (Equifax credit data) and FHFA National Mortgage Database track actual mortgage originations and identify first-time buyers by the absence of prior mortgage history. Median first-time buyer age: 32–33, essentially flat since 2016. Key limitation: captures only mortgage-financed purchases. Cash purchases are invisible, and all-cash purchases have risen from under 10% of transactions (2003–2010) to 26% in 2024. Nine percent of first-time buyers pay cash per NAR.
Reconciliation: Both sources measure real phenomena. Government data better represents the typical mortgage-financed first-time buyer. NAR data captures the full market including the growing wealth-transfer and cash-purchase segment. The gap widened significantly after 2020 as rising mortgage rates and accelerating wealth transfers increased the share of non-mortgage purchases. For CRE multifamily demand analysis, the government figure (32–33) is the more relevant benchmark for projecting when the modal renter transitions to ownership. The NAR figure captures a real but distinct phenomenon — the expanding population of older, wealthier first-time buyers entering through non-traditional pathways.
Wealth Transfer Estimates
Total intergenerational transfer: $84–105 trillion (Cerulli Associates; Federal Reserve Survey of Consumer Finances). Home equity component: $17–19 trillion, derived from Federal Reserve Financial Accounts (Z.1 release), Census Bureau homeownership rates by age cohort, and Survey of Consumer Finances median home equity by age (2022 wave). Range reflects projection time horizon (20–30 years) and home price appreciation assumptions.
Rental Age Population Projection
2025 baseline estimated from CDC birth data by year (1980–2015) plus cumulative net immigration through 2025 minus cumulative mortality (CDC life tables by age). Forward projection ages existing population with CDC age-specific annual mortality rates. Zero net immigration assumed after 2025 baseline. Future domestic births are irrelevant to the 2025–2035 window because no one born after 2015 reaches age 20 before 2035. Absolute population figures are estimates subject to ±2–3% uncertainty; the trend direction and magnitude are the analytically relevant outputs.
Chart Construction
Dual-axis chart. Left axis: ages (years) for NAR homebuyer age and CDC mother age. Right axis: total fertility rate. Data plotted at available data points, not interpolated. Government data not shown on chart to reduce visual complexity; presented in chart note and this Methodology section.
Sources
1. CDC National Center for Health Statistics. Births: Final Data for 2023; Trends in Mean Age of Mothers in the United States, 2016 to 2023 (June 2025). cdc.gov/nchs
2. National Association of Realtors. Profile of Home Buyers and Sellers (2025 edition, released November 2025). nar.realtor
3. Federal Reserve Bank of New York. Consumer Credit Panel / Equifax Data. newyorkfed.org
4. Federal Housing Finance Agency (FHFA). National Mortgage Database. fhfa.gov
5. American Enterprise Institute (AEI). Housing Center Research — analysis of NAR survey response bias. aei.org/housing
6. World Bank. Total Fertility Rate data. data.worldbank.org
7. Cerulli Associates. U.S. High-Net-Worth and Ultra-High-Net-Worth Markets (2022). Wealth transfer projections.
8. Federal Reserve Board. Survey of Consumer Finances (2022 wave). federalreserve.gov/scf
9. Federal Reserve Board. Financial Accounts of the United States (Z.1 release). federalreserve.gov/releases/z1
10. U.S. Census Bureau. Homeownership rates by age; population estimates. census.gov
11. National Multifamily Housing Council. Research Notes Newsletter (September 2021). Average occupants per rental unit: 1.9.
12. Federal Reserve Bank of St. Louis (FRED). Mortgage rates, median home prices. fred.stlouisfed.org