
U.S. Domestic Migration: Metro & City Population Growth

This page ranks the 35 U.S. metros above 2 million residents, then follows the growth inside them down to the 1,959 incorporated places of 20,000 or more, where the country’s fastest growth is now occurring at the suburban edge.

Explore US metros and cities below, ranked by size, and one-to-five year population growth rates. Metro areas include suburban population areas, whereas cities include only areas defined as incorporated in that city.
Metro Explorer: All U.S. Metros, 2000–2025

The charts below show ten metros at a time; this table covers the 341 MSAs with complete 2020–2025 data. Search, filter by size, and click column headers to sort. Metros with 2000-era boundary changes are noted in Methodology.

Metro 2025 Population Net 2024–25 % 2024–25 5yr CAGR % 2000–25
City Explorer: All 1,959 Incorporated Places 20,000+

Search any city, filter by state or minimum size, and sort. Five-year figures measure from the April 1, 2020 base. Source: U.S. Census Bureau, Vintage 2025 Subcounty Estimates (May 2026).

City State 2025 Population Net 2024–25 % 2024–25 Net 2020–25 % 2020–25

Top & Bottom 10 Metros by Population Growth (2M+ MSAs)
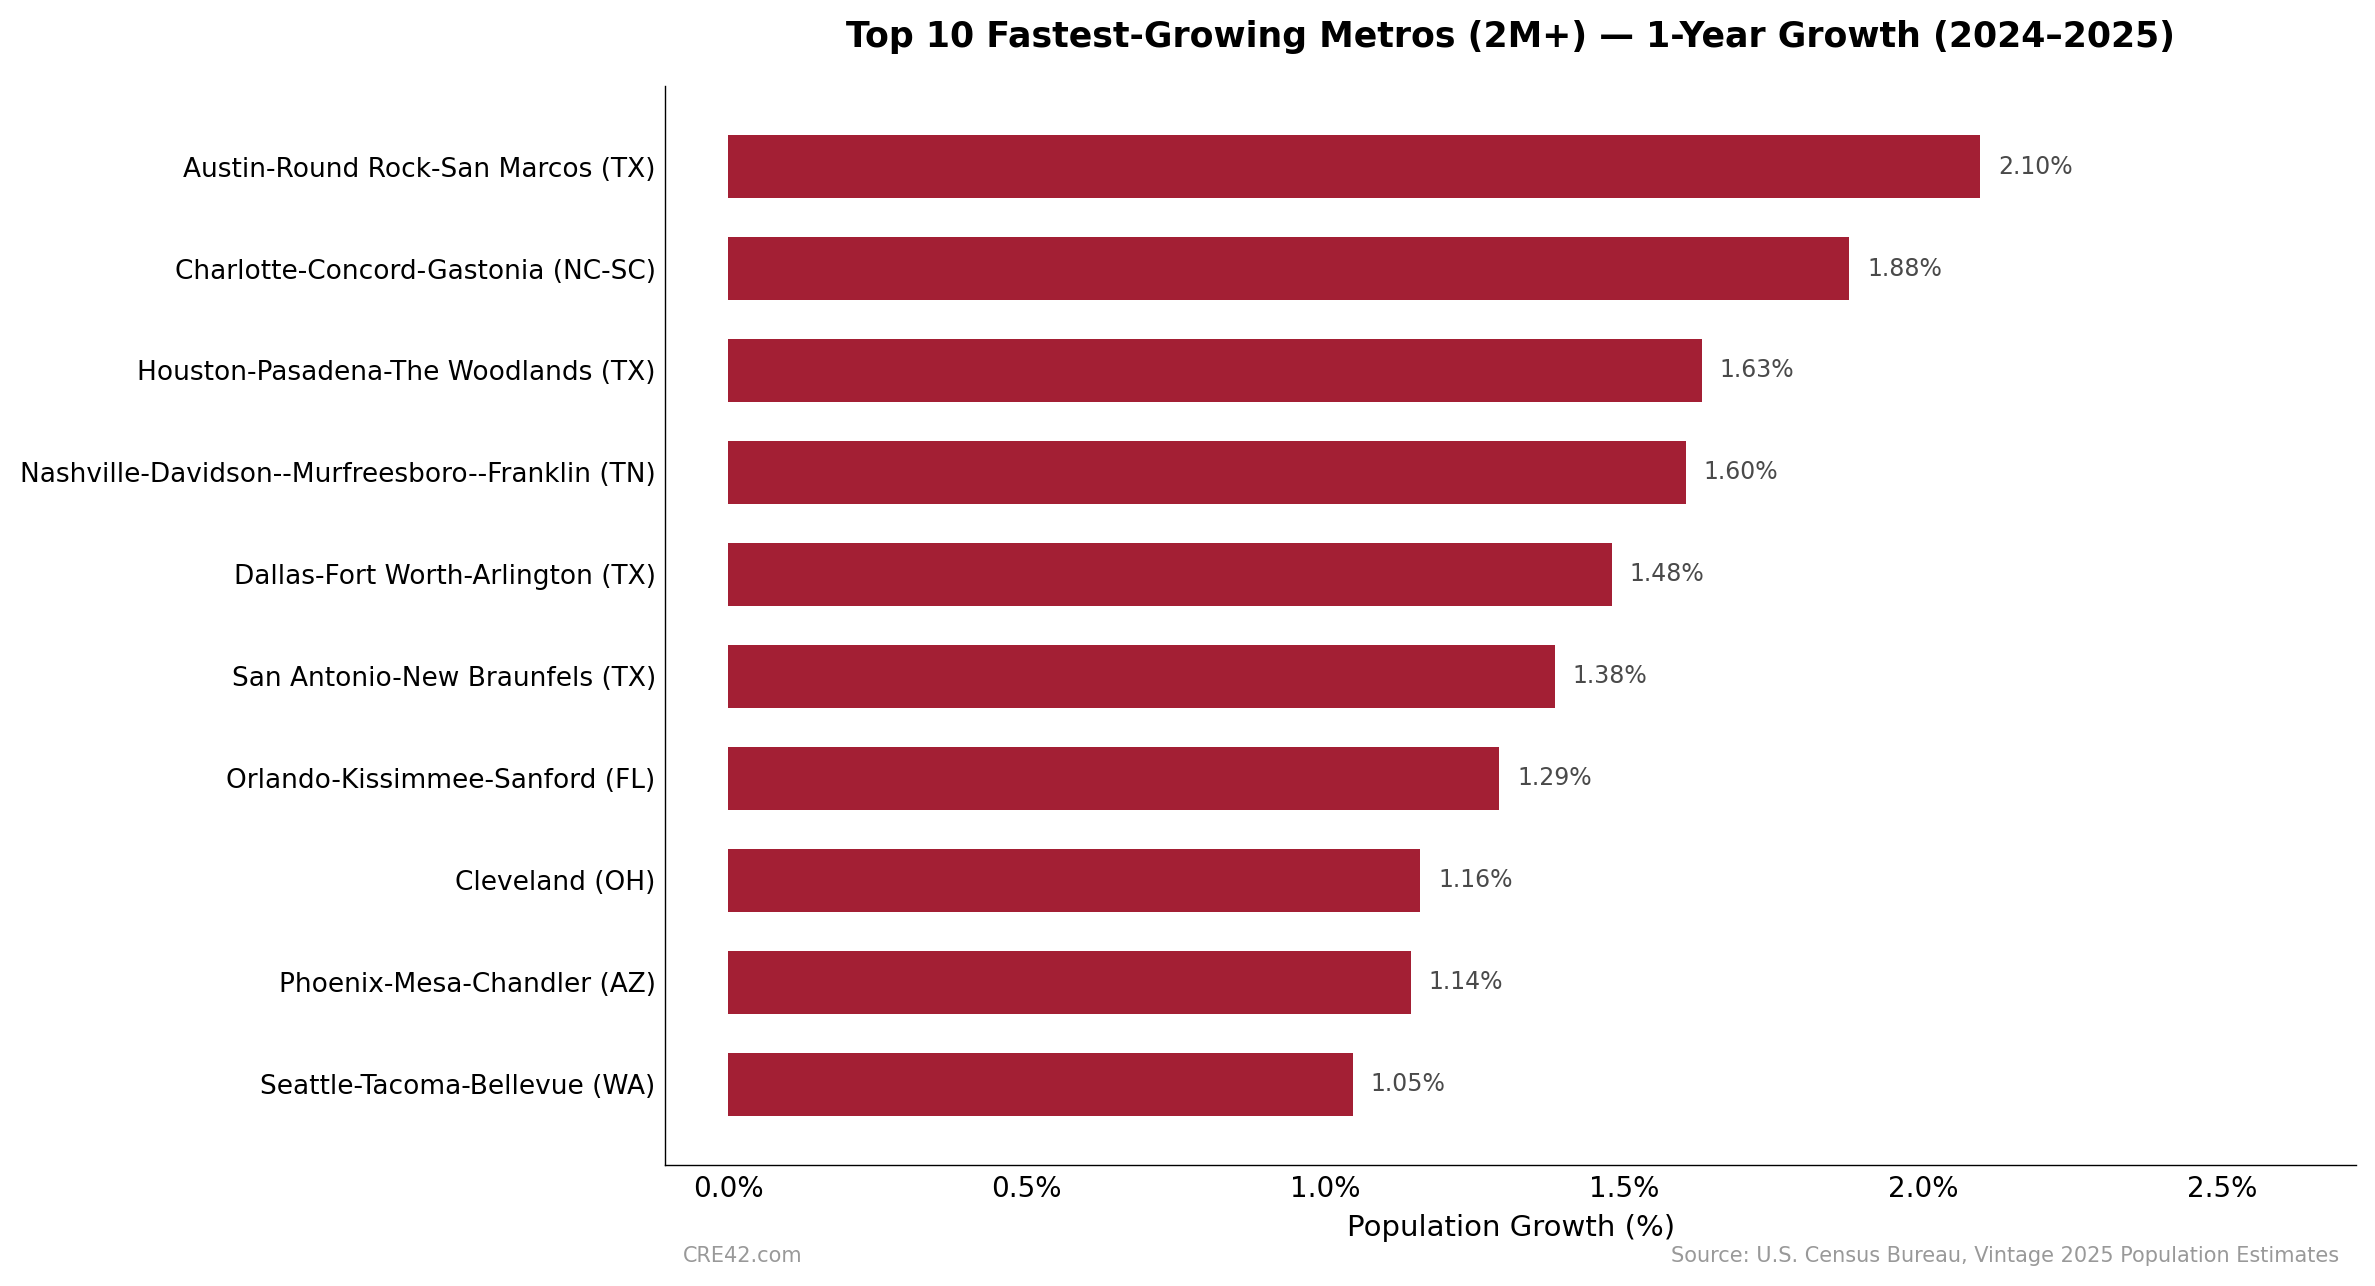
Bar chart showing the top 10 fastest-growing U.S. metros with 2 million plus population by 1-year growth 2024 to 2025. Austin leads at 2.10 percent.

Top 10 Fastest-Growing Metros (2M+) — 1-Year Growth (2024–2025) | Source: U.S. Census Bureau, Vintage 2025 MSA Estimates (March 2026) | Chart: CRE42
Austin leads at +2.10% (2024–2025), followed by Charlotte (+1.88%) and Houston (+1.63%); all four Texas 2M+ metros rank in the top six. Austin city itself grew just +0.40%; see MSA vs. City below.
Seattle (+1.05%) and Indianapolis (+1.02%) entered the top ten in the latest year; Las Vegas (+0.90%) and Denver (+0.36%) dropped out and now rank 13th and 22nd of the 35 large metros.
Orlando (+1.29%) is the only Florida metro remaining in the 1-year top ten; its net domestic migration turned negative in 2025.
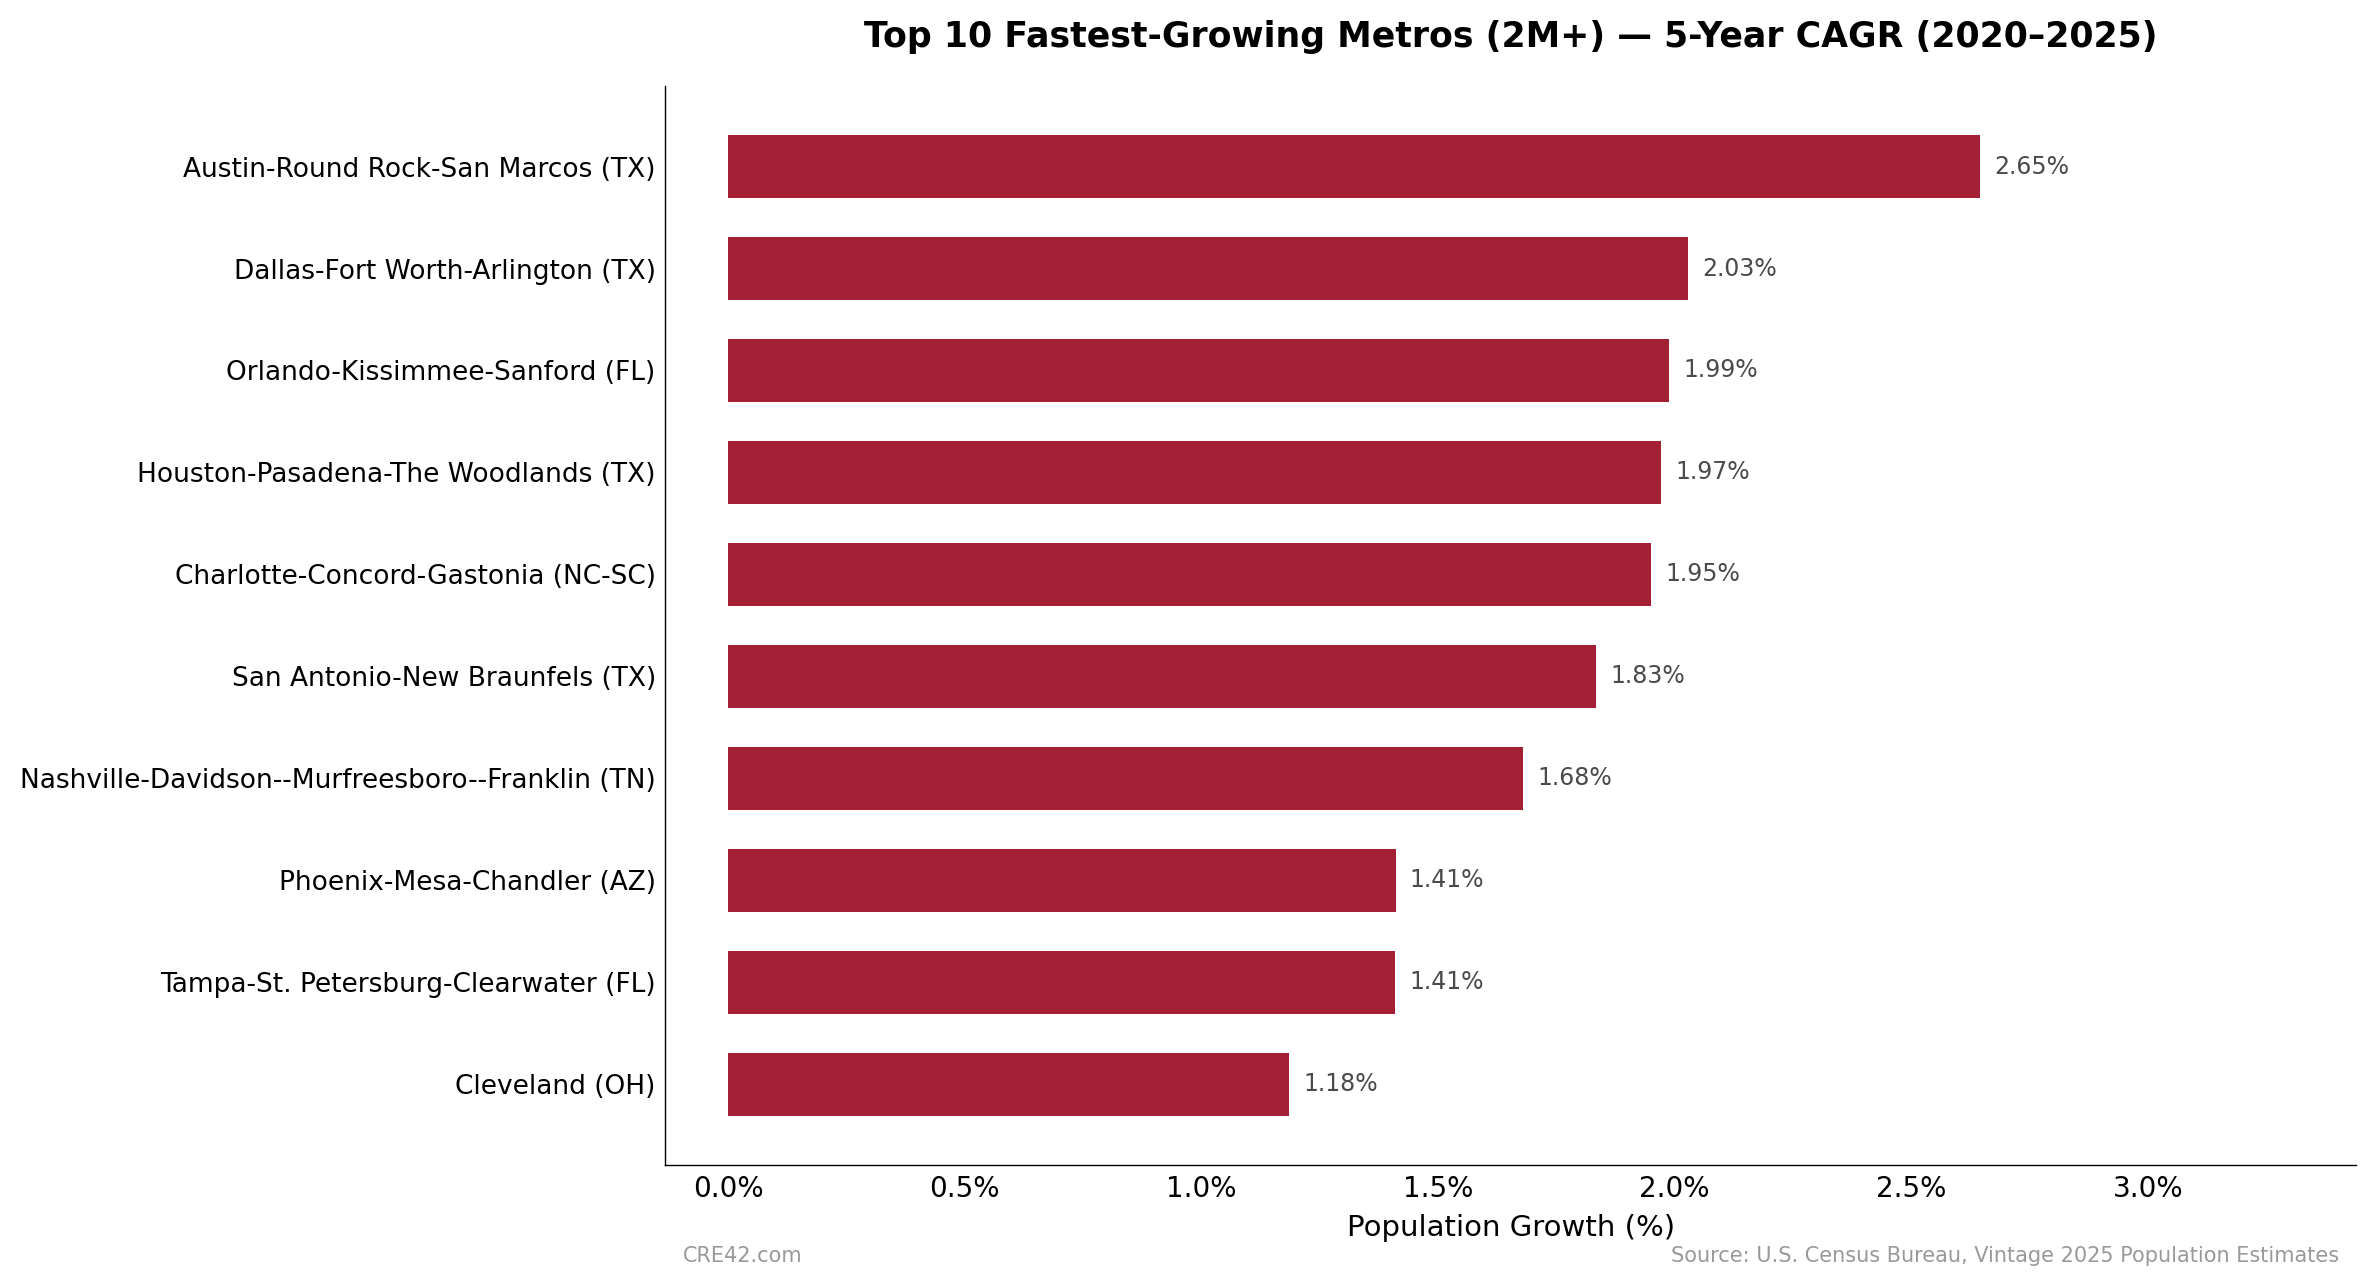
Bar chart showing the top 10 fastest-growing U.S. metros with 2 million plus population by 5-year CAGR 2020 to 2025. Austin leads at 2.65 percent.

Top 10 Fastest-Growing Metros (2M+) — 5-Year CAGR (2020–2025) | Source: U.S. Census Bureau, Vintage 2025 MSA Estimates (March 2026) | Chart: CRE42
Austin leads at 2.65% annually (2020–2025); Dallas–Fort Worth (2.03%), Houston (1.97%), and San Antonio (1.83%) give Texas four of the top ten.
Orlando (1.99%) and Tampa (1.41%) keep Florida in the five-year top ten even though both saw domestic migration turn negative by 2025.
The slowest of the ten, Atlanta, still compounded at 1.15% annually over the five years.
Seattle and Indianapolis, ninth and tenth on the 1-year list, do not make the 5-year top ten: Indianapolis ranks 12th of the 35 at +1.06% annually and Seattle 18th at +0.66%.
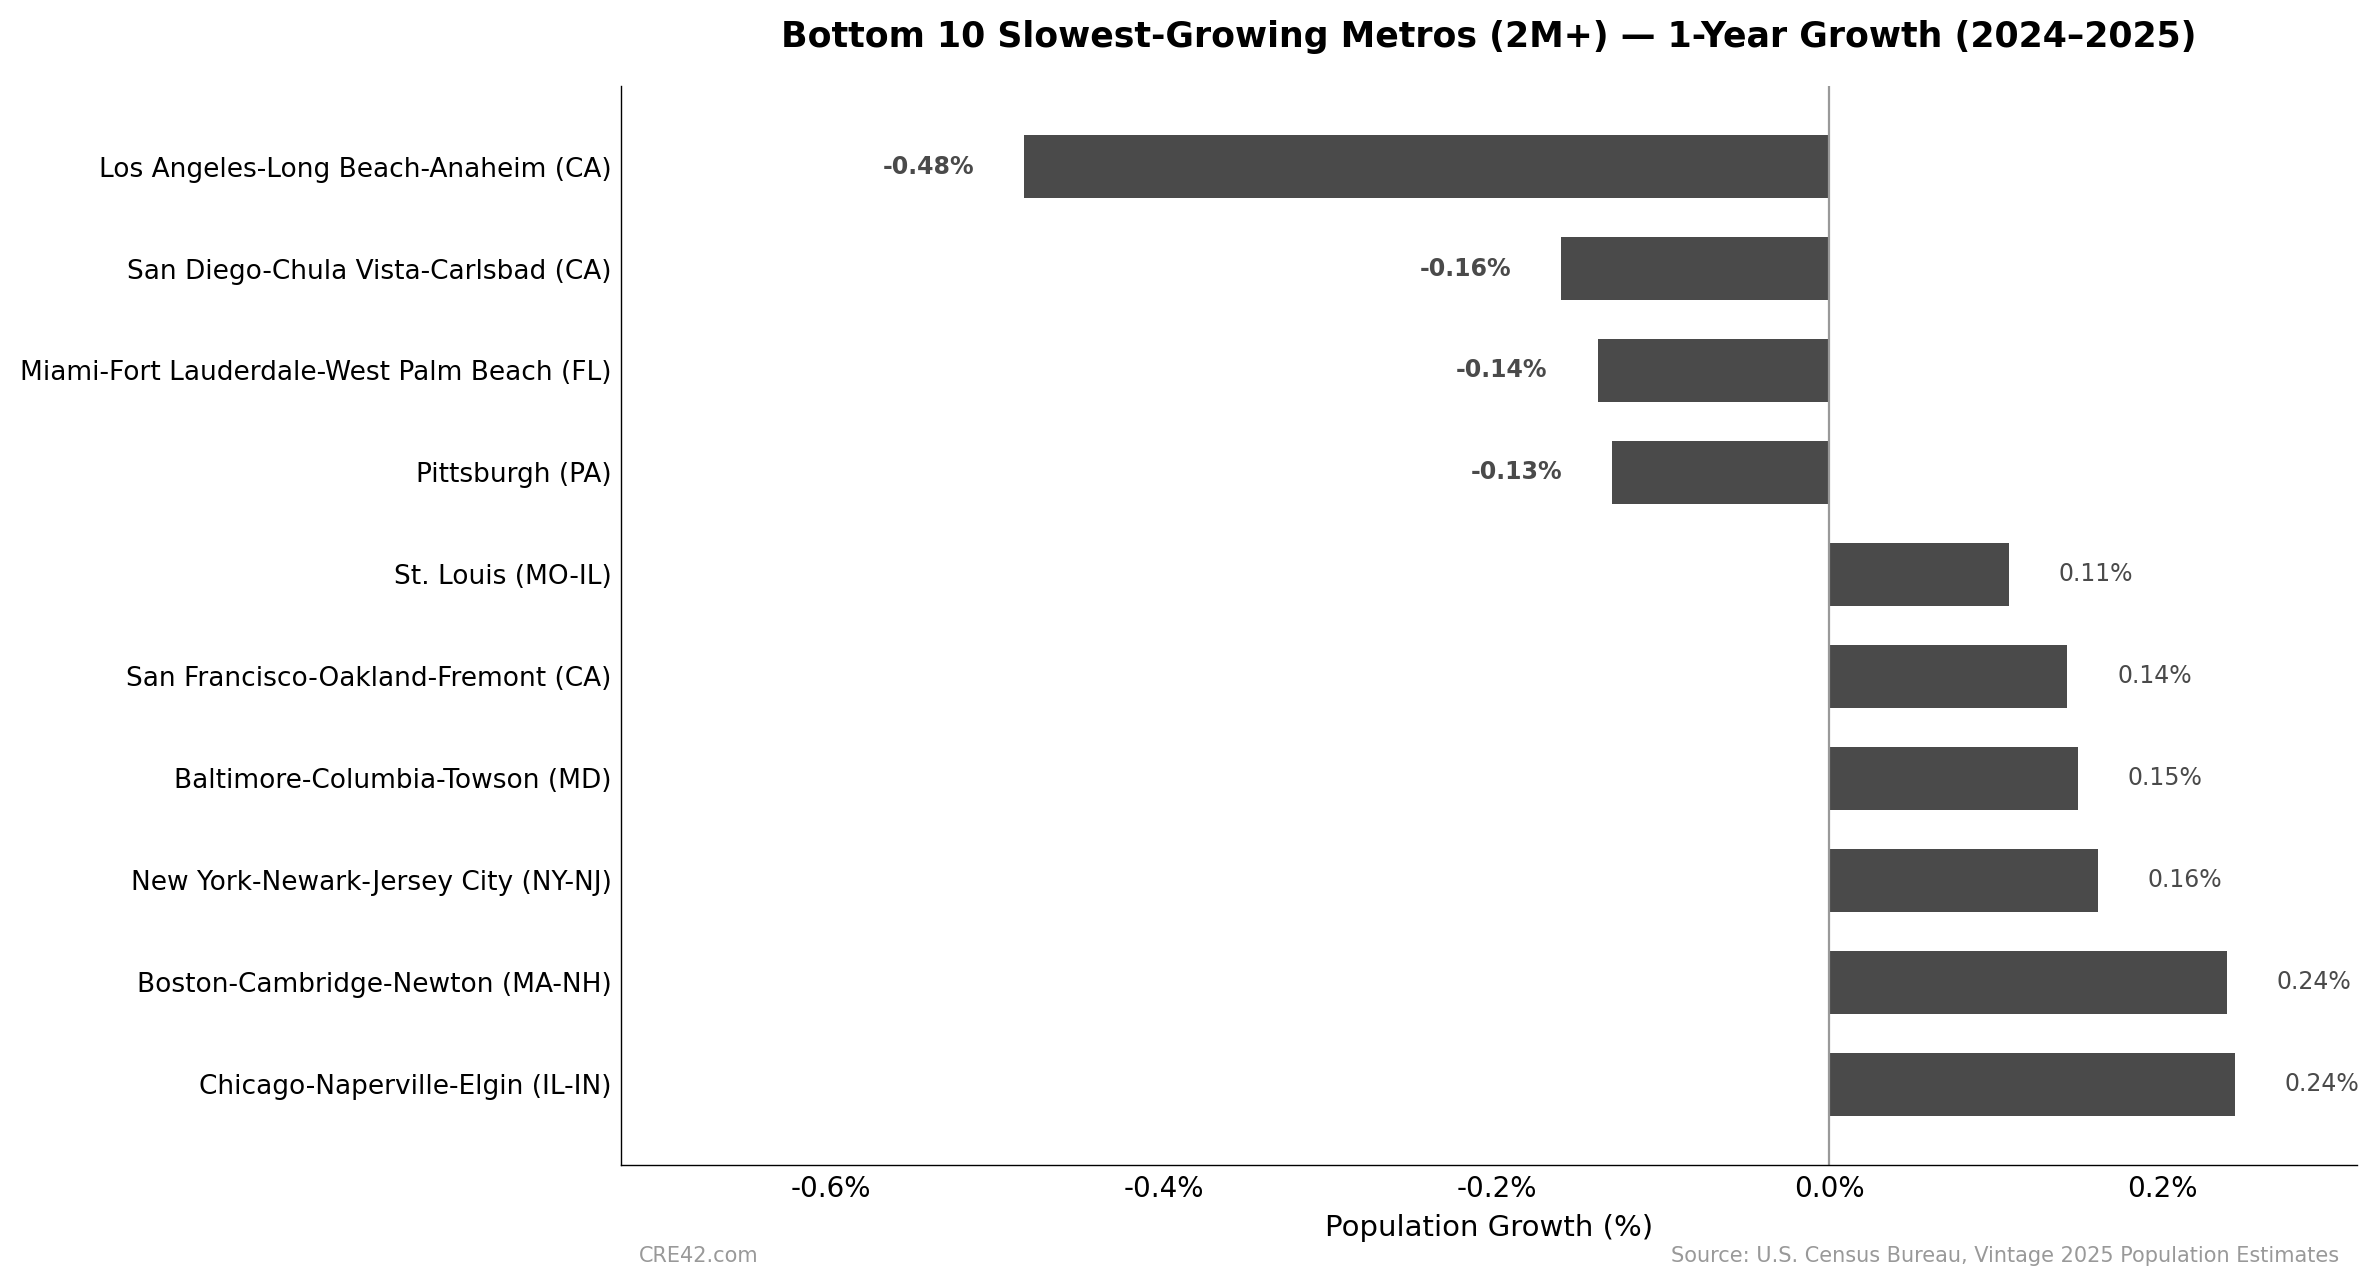
Bar chart showing the bottom 10 slowest-growing U.S. metros with 2 million plus population by 1-year growth 2024 to 2025. Los Angeles declined 0.48 percent.

Bottom 10 Slowest-Growing Metros (2M+) — 1-Year Growth (2024–2025) | Source: U.S. Census Bureau, Vintage 2025 MSA Estimates (March 2026) | Chart: CRE42
Four 2M+ metros lost population in 2024–2025: Los Angeles (–0.48%), San Diego (–0.16%), Miami (–0.14%), and Pittsburgh (–0.13%).
Miami, New York, and Boston entered the bottom ten in the latest year; Portland, Detroit, and Philadelphia exited and now rank 20th (+0.44%), 23rd (+0.32%), and 24th (+0.25%) of the 35.
Miami’s decline is its first in this dataset: net domestic out-migration reached 114,000 in 2025 while international arrivals fell from 137,000 to 93,000.
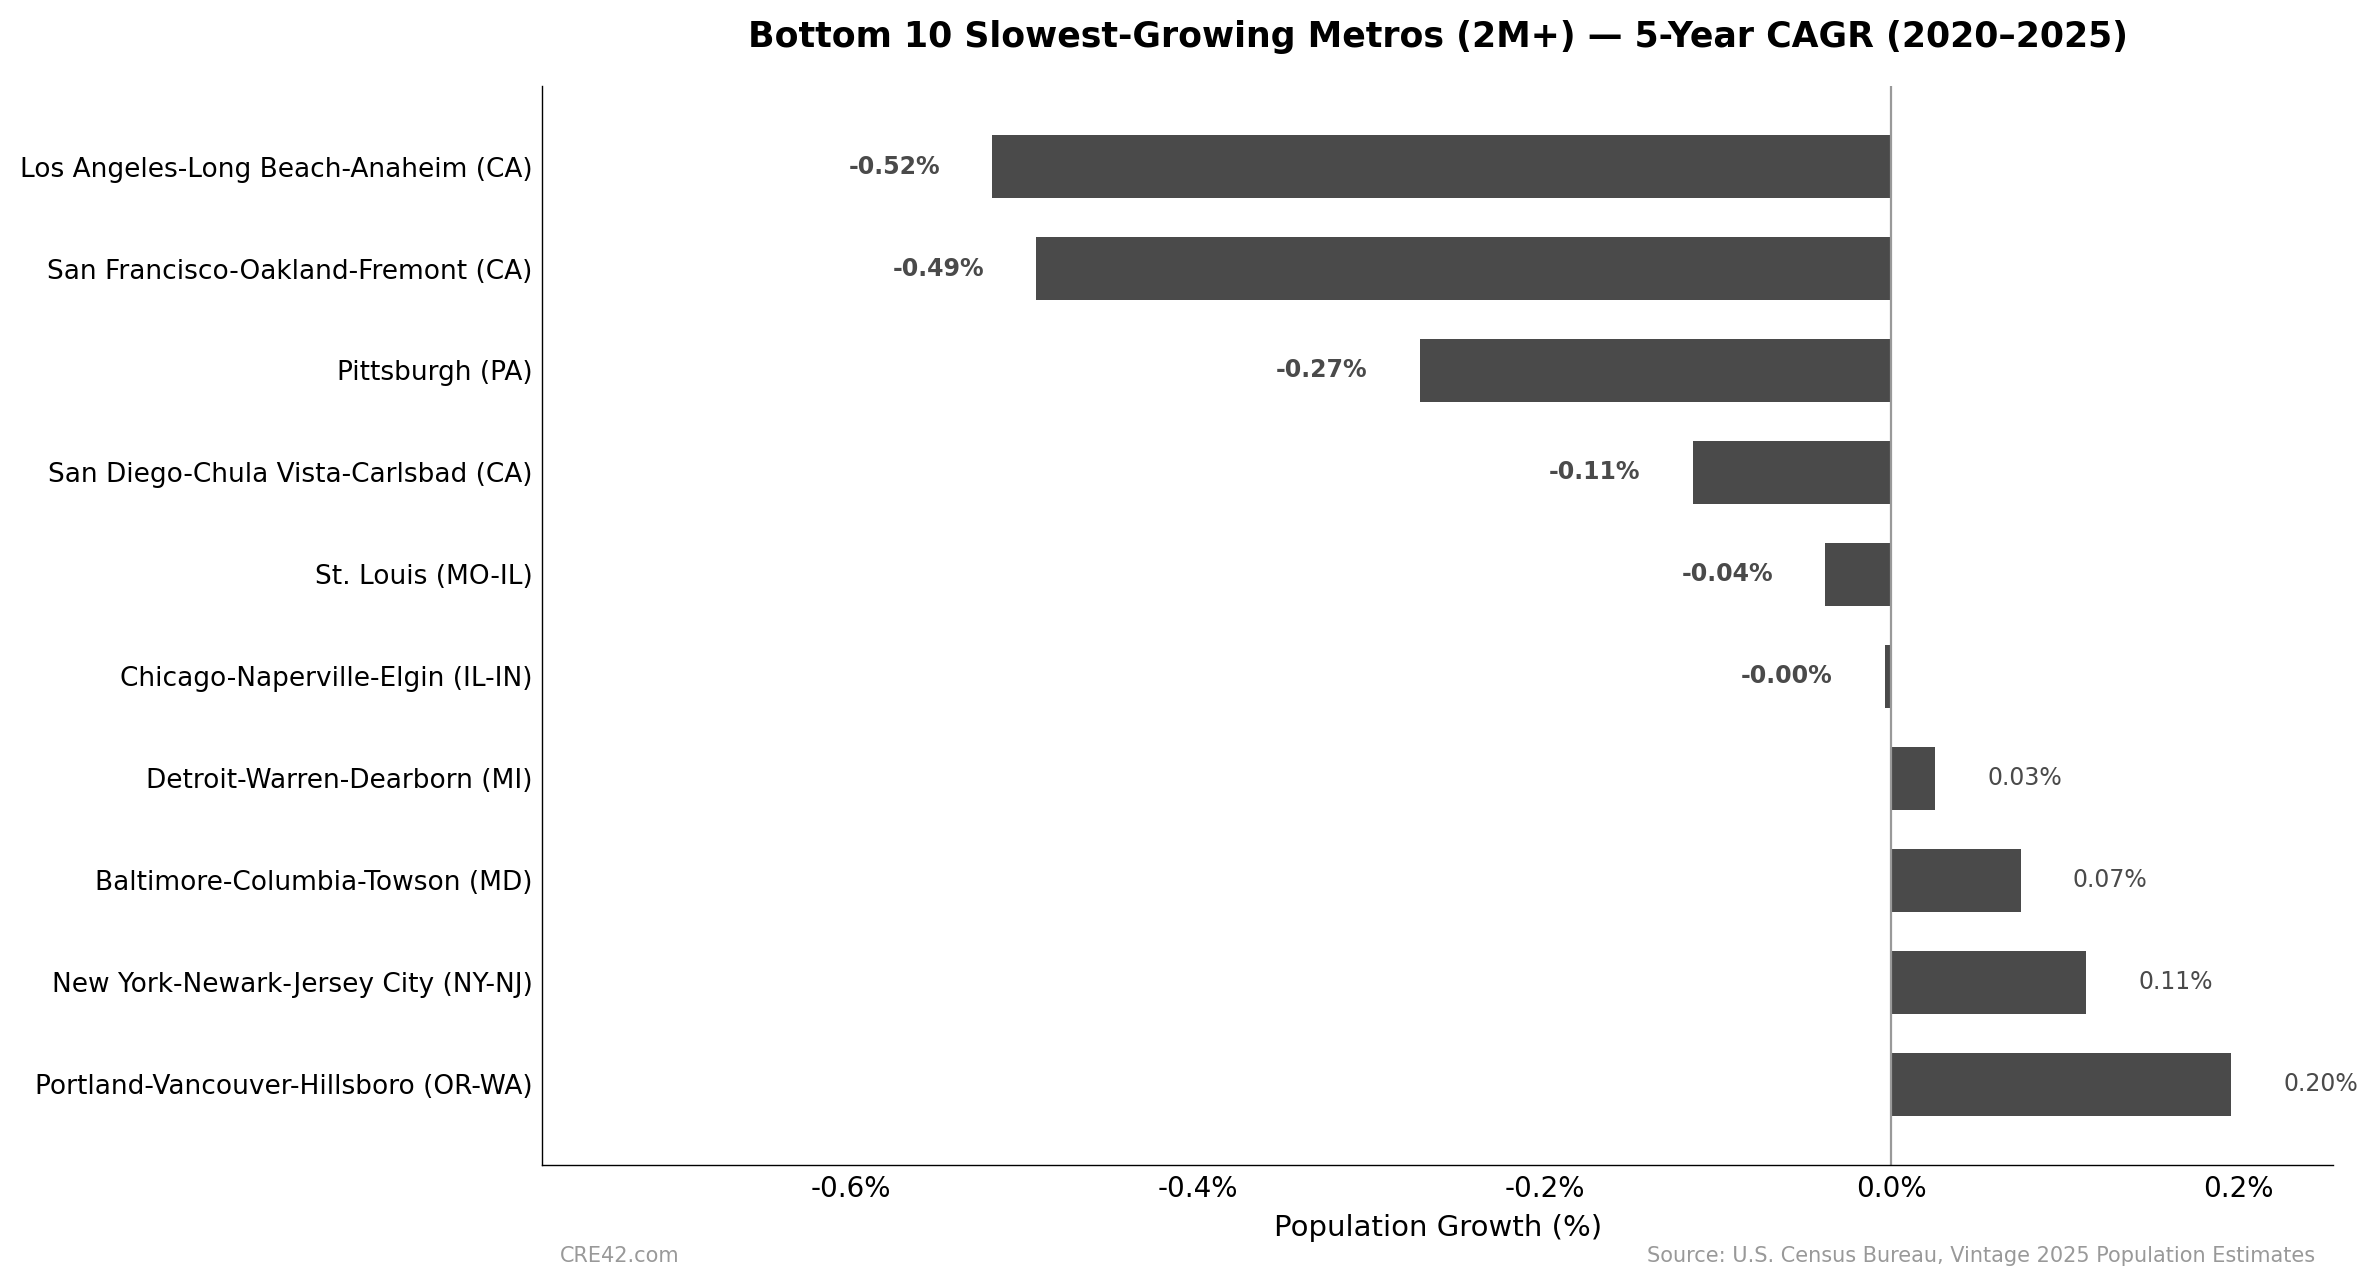
Bar chart showing the bottom 10 slowest-growing U.S. metros with 2 million plus population by 5-year CAGR 2020 to 2025. Los Angeles and San Francisco declined approximately 0.5 percent annually.

Bottom 10 Slowest-Growing Metros (2M+) — 5-Year CAGR (2020–2025) | Source: U.S. Census Bureau, Vintage 2025 MSA Estimates (March 2026) | Chart: CRE42

Los Angeles (–0.52% annually) and San Francisco (–0.49%) shrank fastest among large metros over 2020–2025.
Seven of the bottom ten posted negative or flat five-year CAGRs; New York, the best of the group, compounded at just 0.11%.
Three California metros appear in the bottom ten; Detroit (+0.03%) and Baltimore (+0.07%) round out the group.
Miami and Boston, in the latest year's bottom ten, are not in the 5-year bottom ten: Miami ranks 14th of the 35 at +0.83% annually and Boston 23rd at +0.45%; both entered the bottom ten only in the latest year.

MSA Growth Quotient — 2M+ MSAs by State
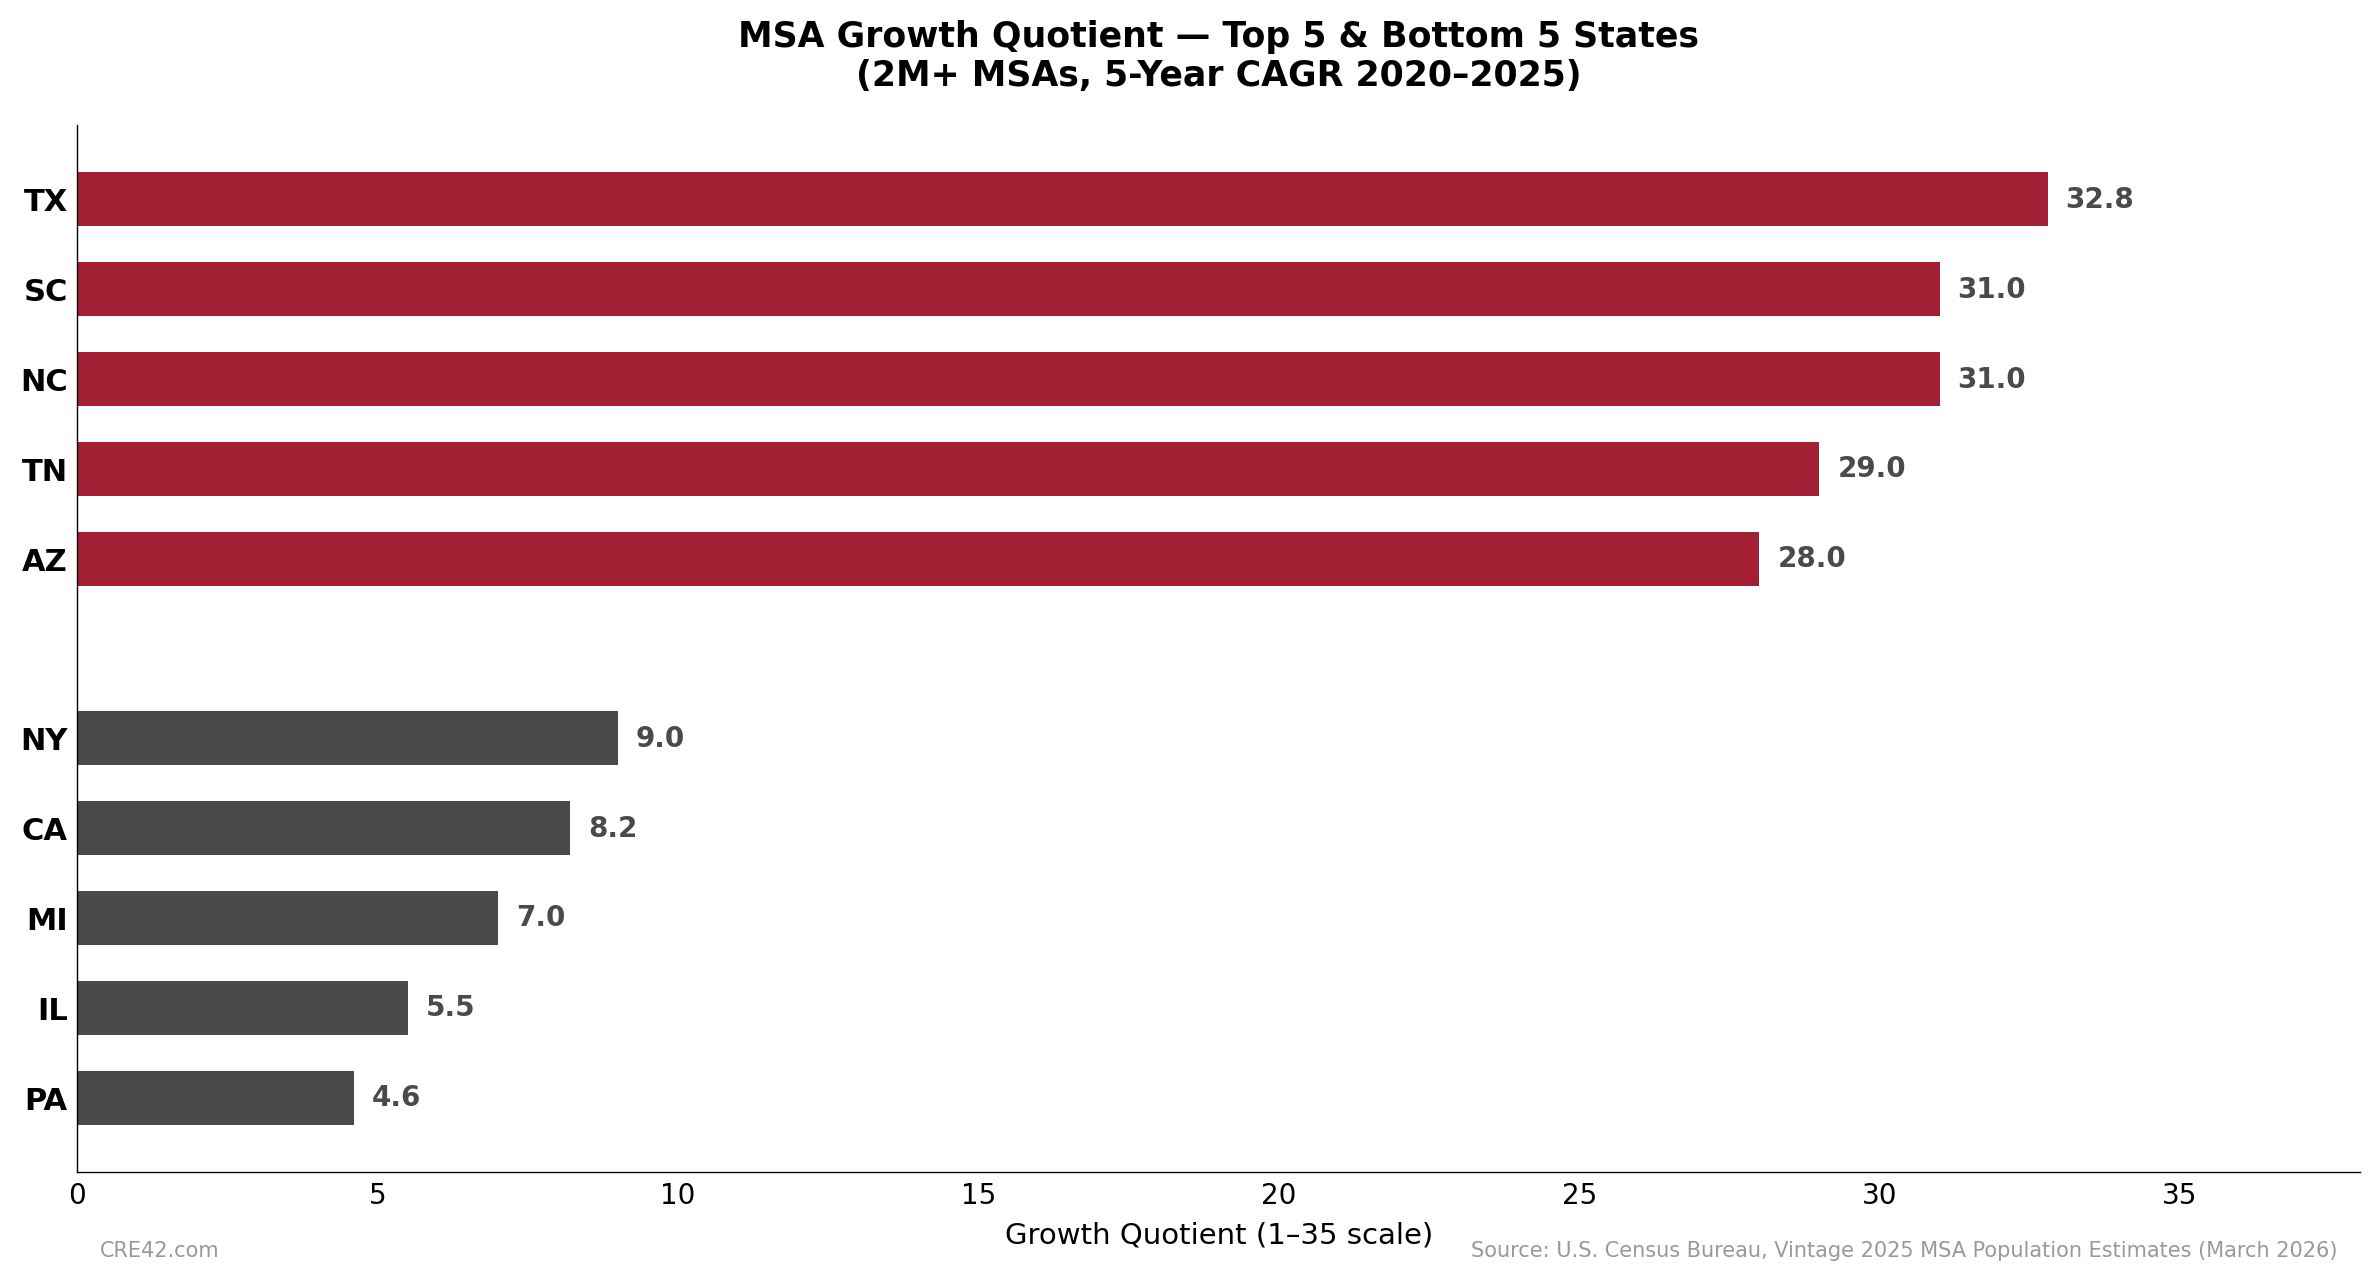
Bar chart showing the MSA Growth Quotient for the top 5 and bottom 5 states with 2 million plus population metros. Texas scores 32.8, Pennsylvania scores 4.8 on a 1 to 35 scale.

MSA Growth Quotient: Top 5 & Bottom 5 States (2M+ MSAs, 5yr CAGR 2020–2025) | Source: U.S. Census Bureau, Vintage 2025 MSA Estimates (March 2026) | Analysis: CRE42

The Growth Quotient measures the average growth rank of a state’s 2M+ metros on a 1–35 scale (1 = slowest growing, 35 = fastest). Multi-state MSAs are split proportionally among constituent states (excluding D.C.). See Methodology section for calculation details.

Texas’s four 2M+ metros average a 32.8 growth rank on the 1–35 scale; North Carolina and South Carolina follow at 31.0 through Charlotte.
Florida’s three 2M+ metros average 27.3, sixth among states, despite Miami ranking in the bottom ten for 1-year growth.
Pennsylvania (4.8), Illinois (6.5), and Michigan (8.0) hold the lowest quotients; California’s five metros average 8.8.
Growth Quotient State Maps: 2M+ Metros by State

Choose one of the ten states from the chart above. Bubble area is proportional to 2025 MSA population; shading is the metro’s 5-year growth rank (1 = slowest, 35 = fastest), the input to the state’s Growth Quotient. Multi-state MSAs count fractionally toward each state’s quotient; see Methodology.

Growth Cities: Where Metro Growth Is Landing

The Census Bureau’s Vintage 2025 subcounty estimates (released May 2026) extend the state and metro series above to the 1,959 incorporated places with populations of 20,000 or more. The pattern inside metros mirrors the pattern across them: average 2024–2025 growth in cities of 250,000 or more fell from 0.9% to 0.3%, while the fastest growth in the country occurred in metro-edge cities. Austin passed 1 million residents during the year, the 12th U.S. city to do so, and Raleigh crossed 500,000. The South accounted for 10 of the 15 fastest-growing places and 11 of the 12 largest numeric gains.[1]
MSA vs. City: Why Austin Tops One List and Misses the Other
The metro rankings above count MSAs: whole labor-market regions spanning multiple counties. The city rankings below count incorporated places: municipal boundaries only. The gap between the two measures is the suburbs. Austin is the clearest case. The Austin MSA grew +2.10% in 2024–2025, first among large metros, yet Austin city grew just +0.40% (+4,025) and does not appear in the top 15 cities. The city is largely built out within its limits, so nearly all metro growth lands in the suburban ring: Hutto (+7.88%), Kyle (+6.06%), Georgetown (+5.38%), Round Rock (+4.17%), and Leander (+3.94%) in the latest year; over five years Hutto grew 66.9%, Georgetown 58.5%, Leander 53.8%, and Kyle 53.0%. The ring itself moves outward: the inner suburbs that led the 2010s, Pflugerville (+1.53% in 2024–2025, +4.8% since 2020) and Cedar Park (+0.54%), have matured, and growth has jumped past them. The city explorer at the top of the page traces the same pattern in any metro.
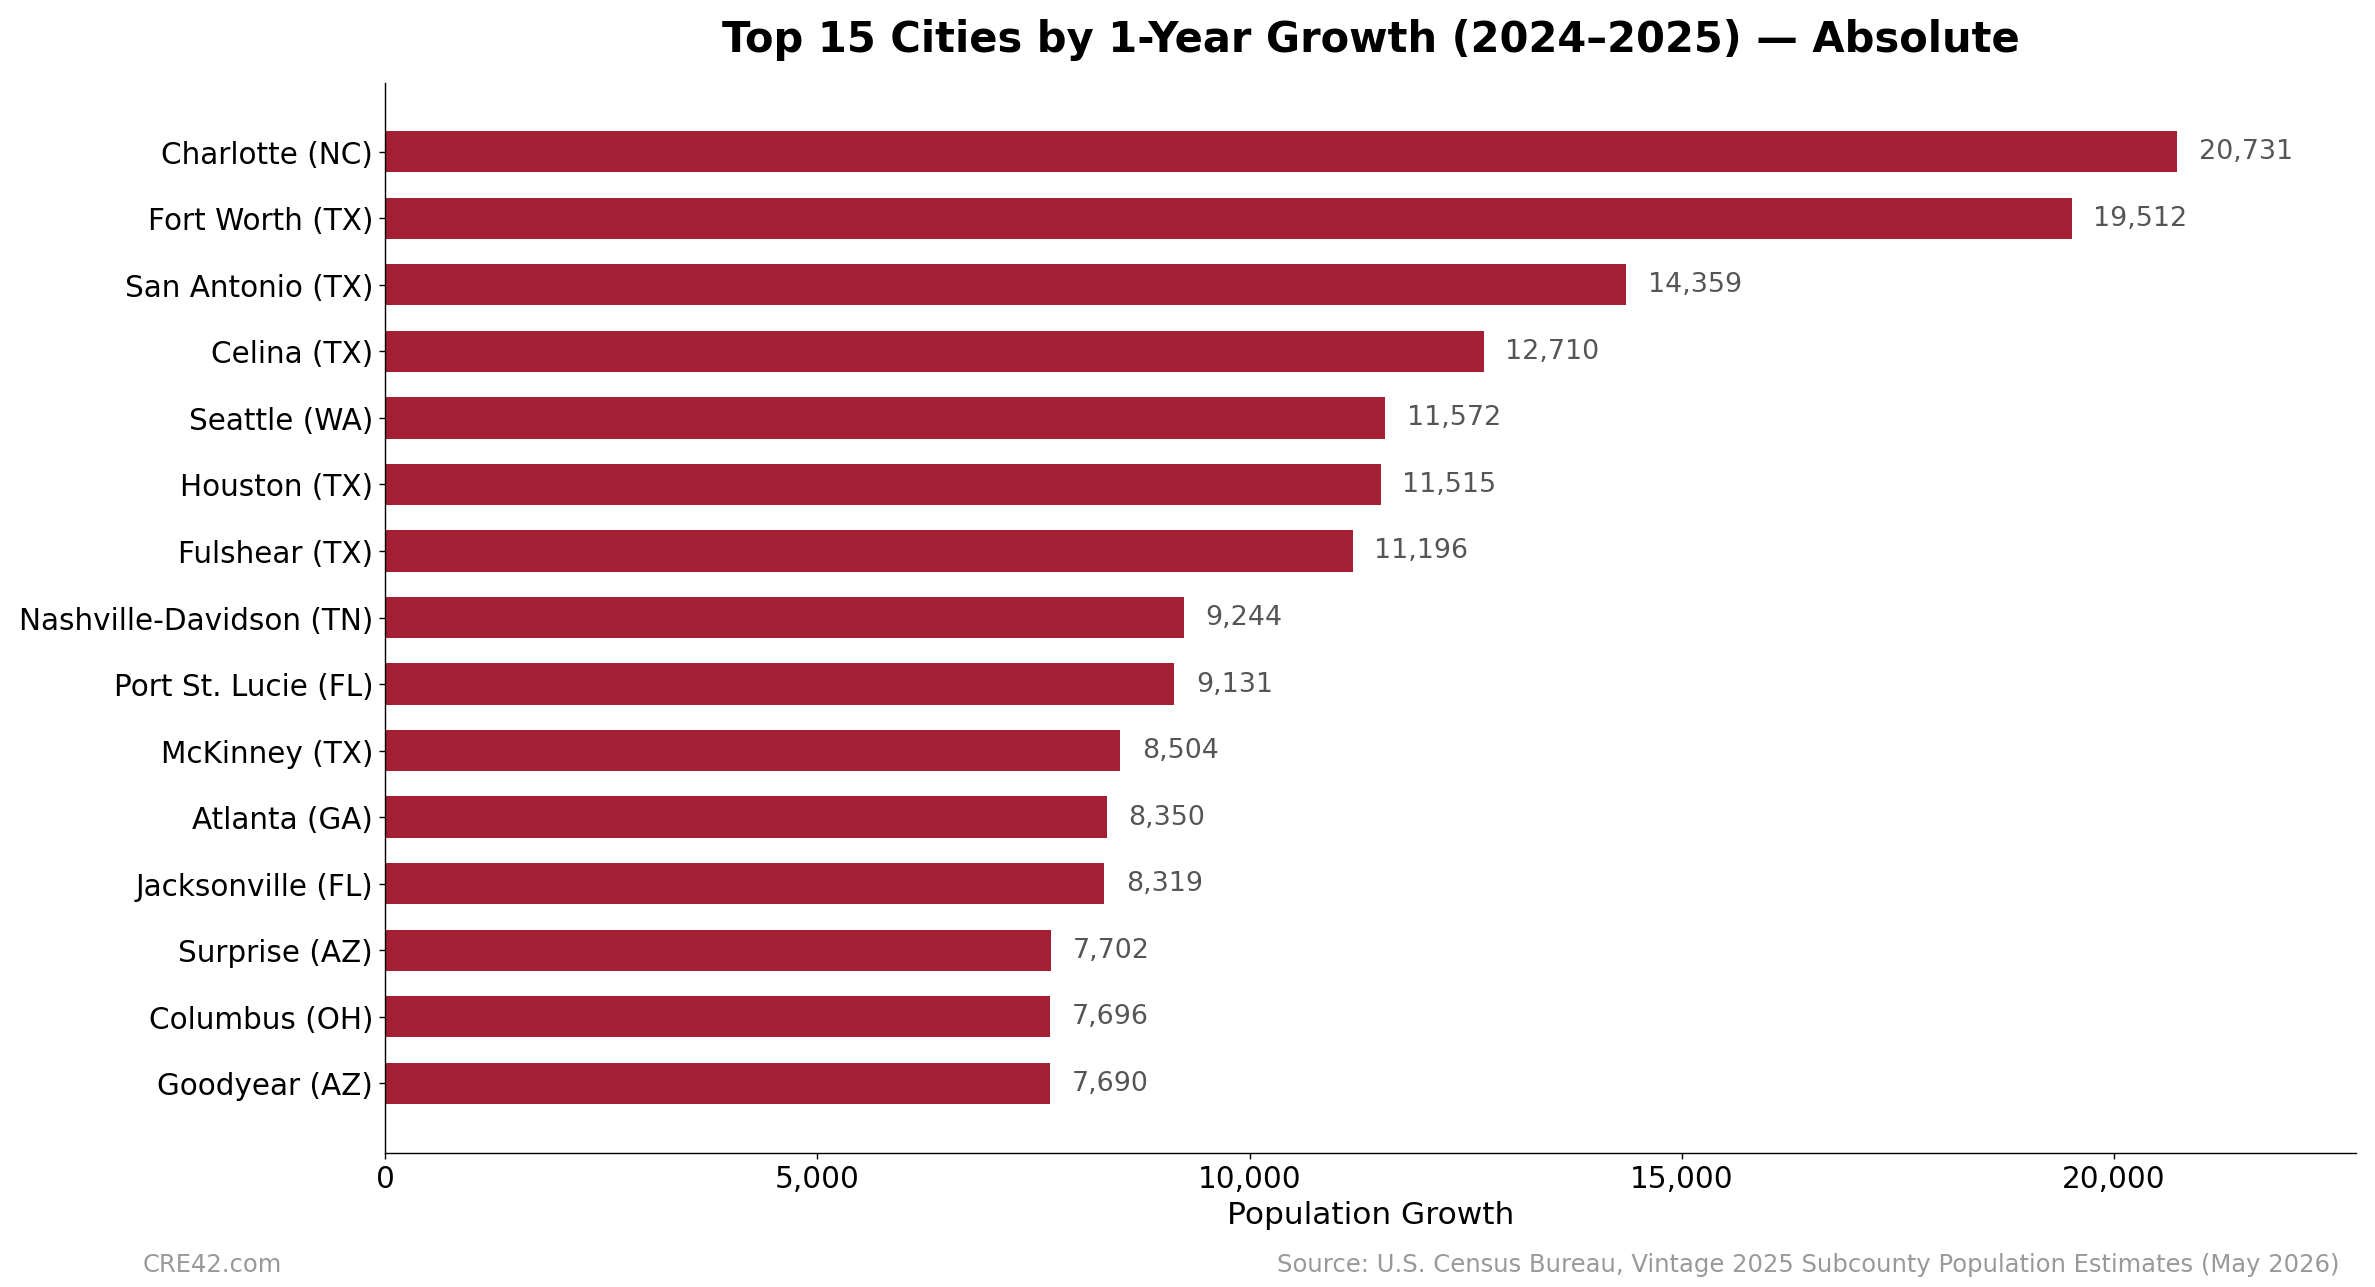
Bar chart showing the top 15 U.S. cities by absolute population growth from 2024 to 2025. Charlotte leads with 20,731, followed by Fort Worth at 19,512 and San Antonio at 14,359.

Top 15 Cities by 1-Year Growth (2024–2025), Absolute | Source: U.S. Census Bureau, Vintage 2025 Subcounty Population Estimates (May 2026) | Chart: CRE42
Charlotte added 20,731 residents in 2024–2025, the largest gain of any U.S. city, ahead of Fort Worth (+19,512) and San Antonio (+14,359).
Celina (+12,710) and Fulshear (+11,196), exurbs of Dallas and Houston, posted top-seven absolute gains from bases near 53,000 residents.
Eleven of the fifteen largest gains are in the South; Seattle, Columbus, Surprise, and Goodyear are the exceptions.
MSA vs. City Boundaries Example Map: Boston
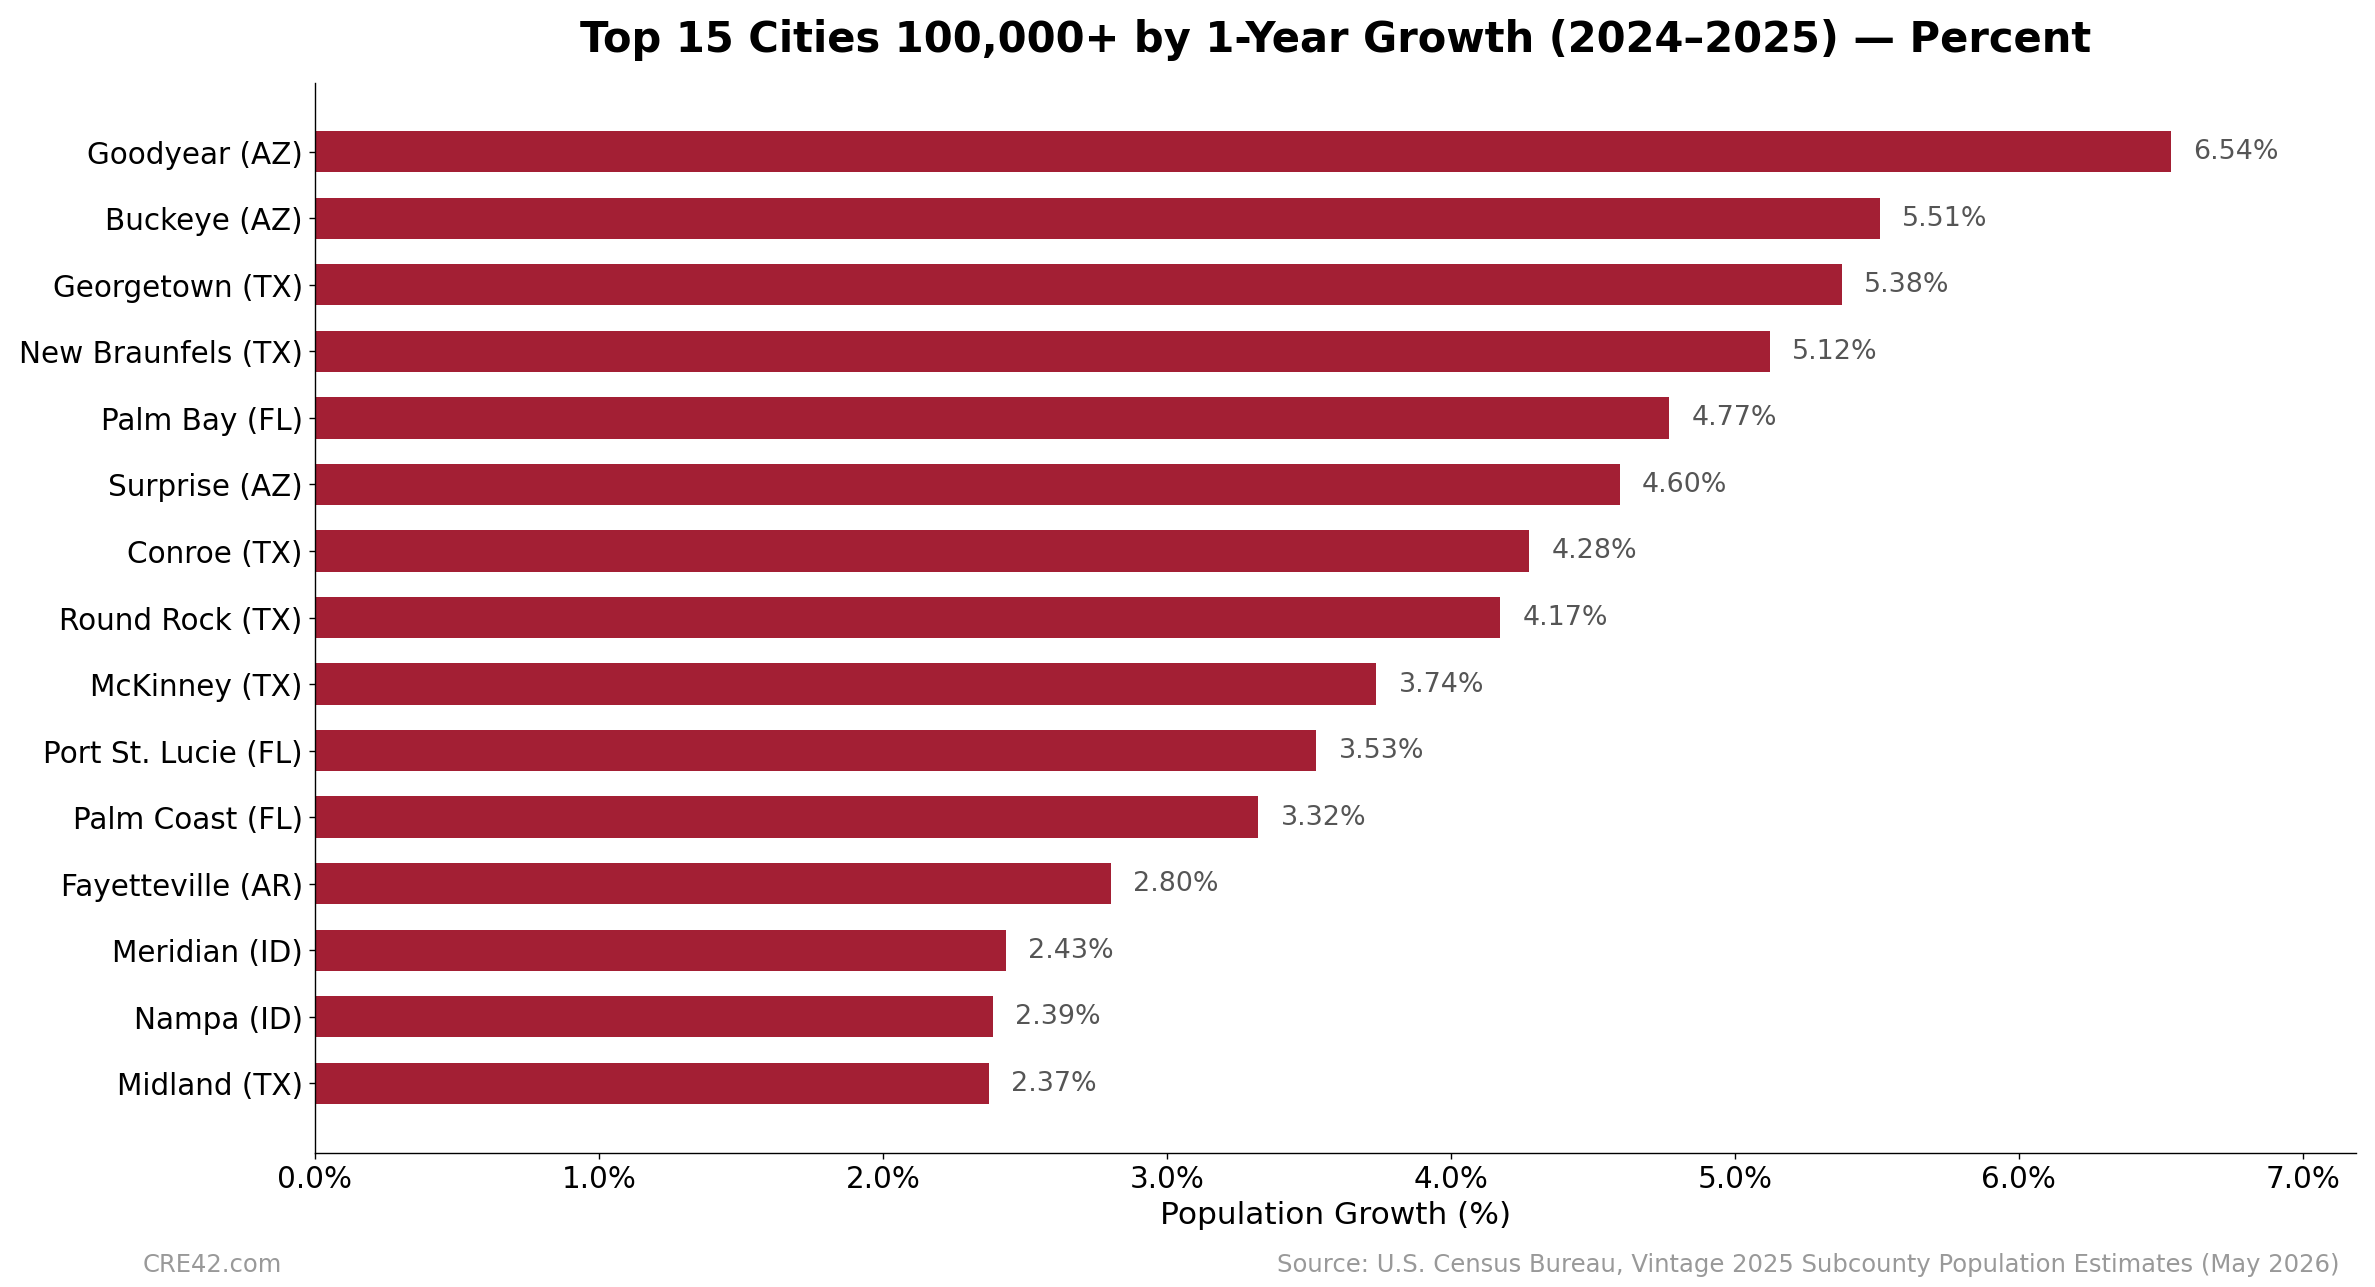
Bar chart showing the top 15 U.S. cities of 100,000 or more by percent population growth from 2024 to 2025. Goodyear, Arizona leads at 6.54 percent.

Top 15 Cities 100,000+ by 1-Year Growth (2024–2025), Percent | Source: U.S. Census Bureau, Vintage 2025 Subcounty Population Estimates (May 2026) | Chart: CRE42
Map: Top 15 Cities 100,000+ by 1-Year Growth
Goodyear (+6.54%), Buckeye (+5.51%), and Surprise (+4.60%), all in metro Phoenix, lead cities of 100,000 or more.
Texas holds six of the fifteen (Georgetown, New Braunfels, Conroe, Round Rock, McKinney, Midland); Florida holds three (Palm Bay, Port St. Lucie, Palm Coast).
The largest city on the list, Port St. Lucie, counts 268,062 residents; none of the nation’s 25 largest cities appears.
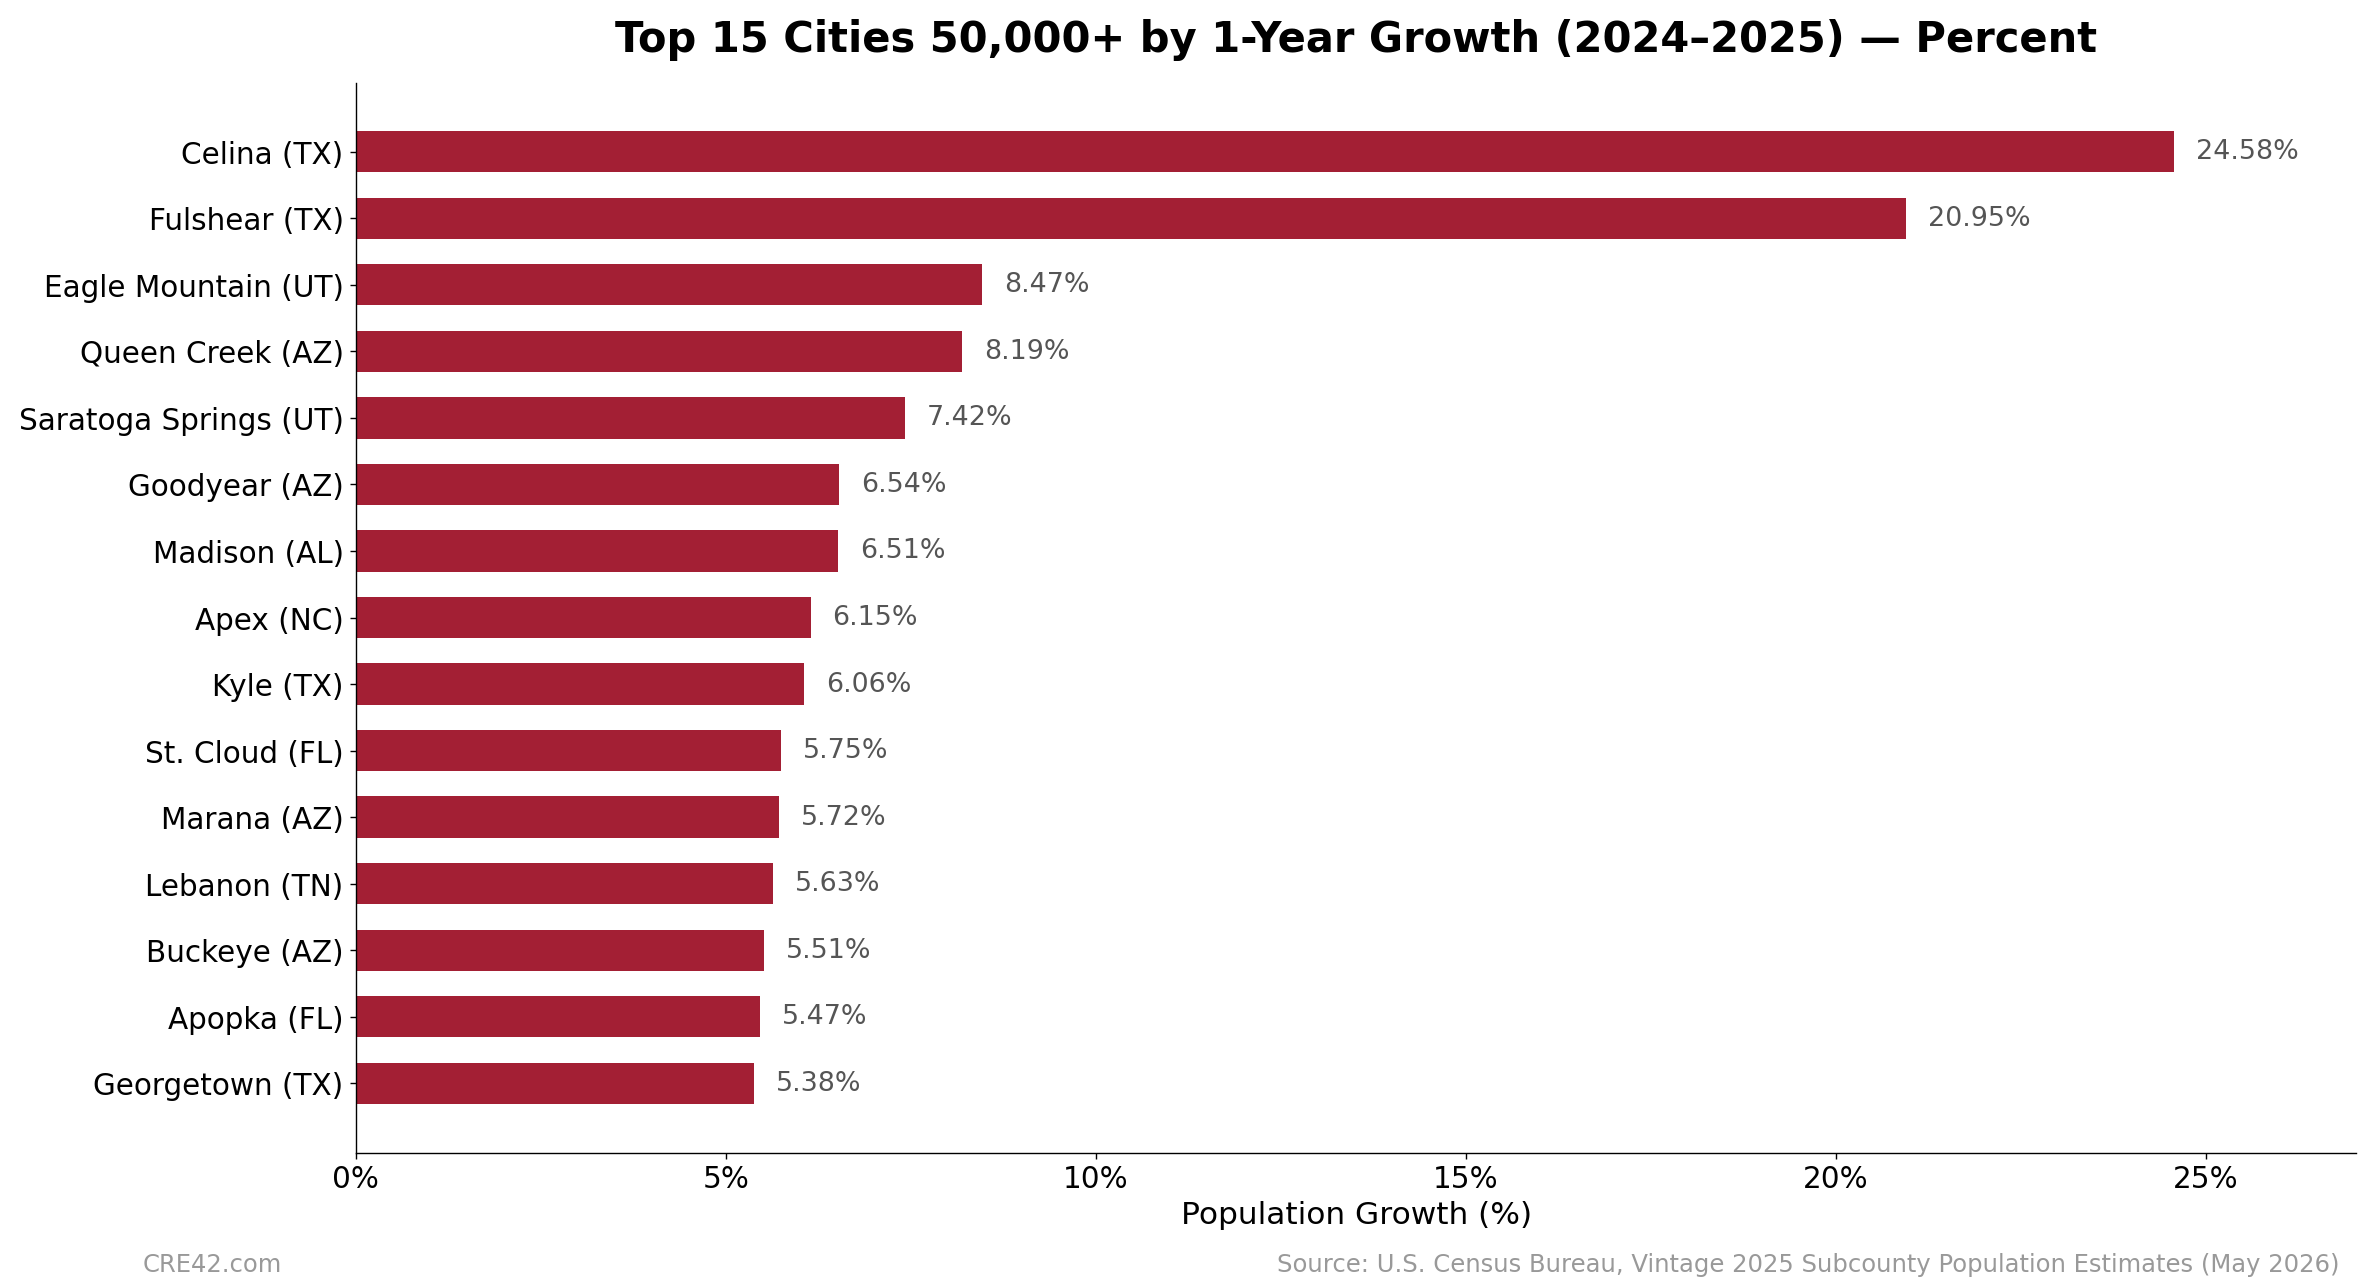
Bar chart showing the top 15 U.S. cities of 50,000 or more by percent population growth from 2024 to 2025. Celina, Texas leads at 24.58 percent, followed by Fulshear, Texas at 20.95 percent.

Top 15 Cities 50,000+ by 1-Year Growth (2024–2025), Percent | Source: U.S. Census Bureau, Vintage 2025 Subcounty Population Estimates (May 2026) | Chart: CRE42
Map: Top 15 Cities 50,000+ by 1-Year Growth
Celina (+24.58%) and Fulshear (+20.95%), exurbs of Dallas and Houston, grow at roughly triple the rate of any other 50,000+ city.
Texas and Arizona each place four of the fifteen; Utah’s two Wasatch Front exurbs, Eagle Mountain (+8.47%) and Saratoga Springs (+7.42%), rank third and fifth.
Kyle (+6.06%) is the only Austin-ring city above the 50,000 floor to rank; Hutto (46,048 residents, +7.88%) sits just below it. The city explorer at the top of the page covers every size.
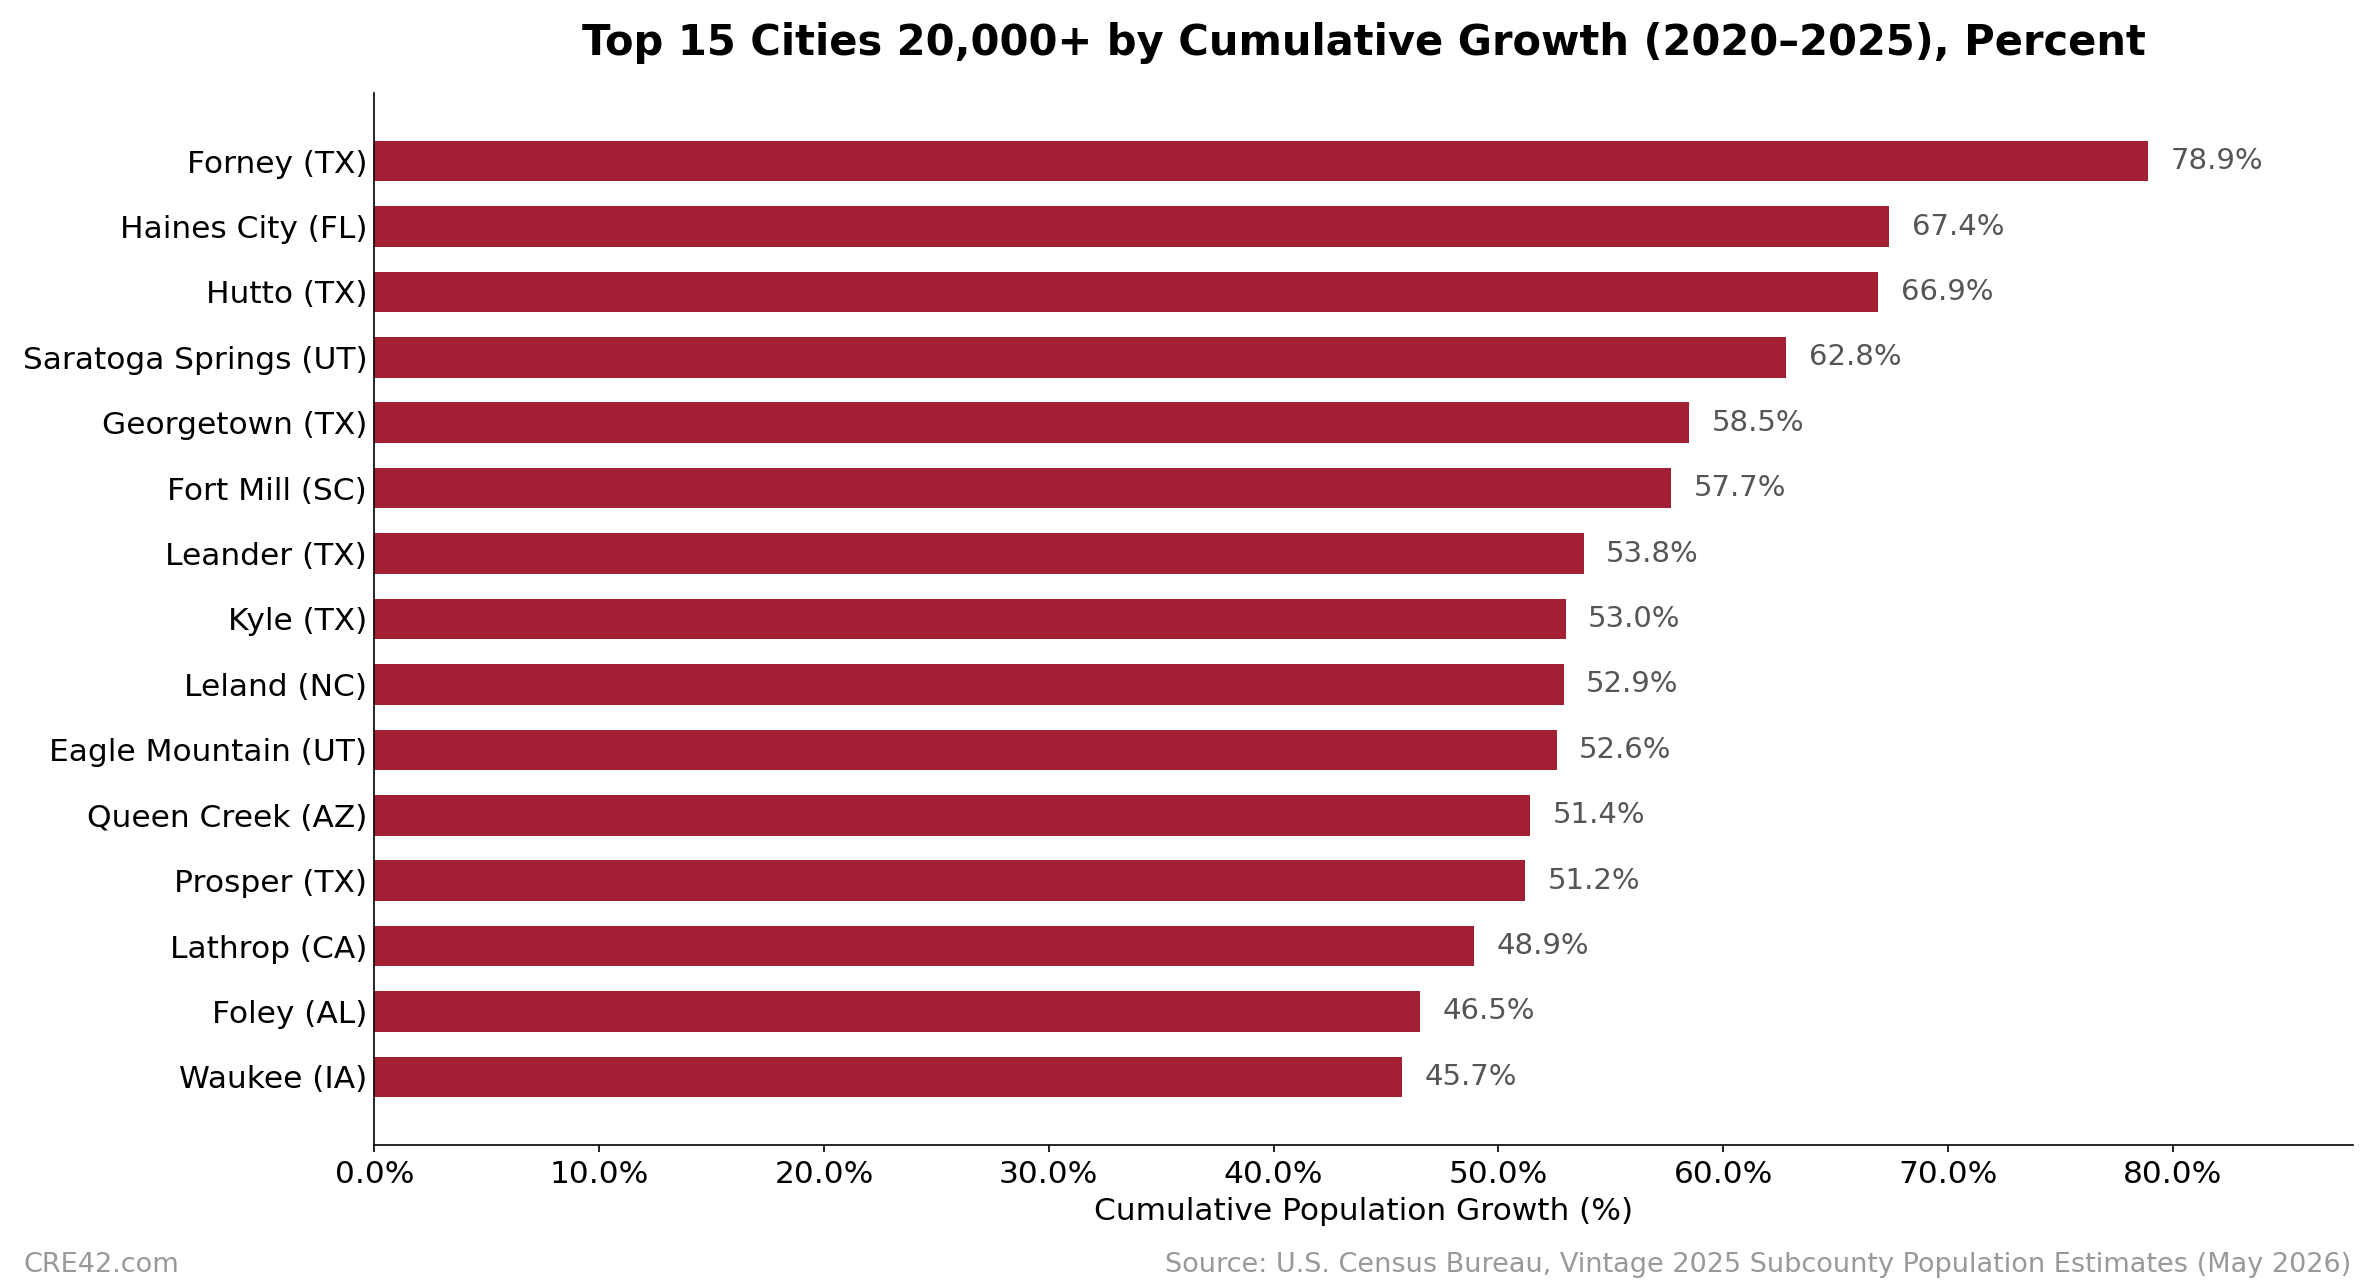
Bar chart showing the top 15 U.S. cities by cumulative percent population growth from 2020 to 2025 among places of 20,000 or more in 2020. Forney, Texas leads at 78.9 percent.

Top 15 Cities 20,000+ by Cumulative Growth (2020–2025), Percent | Source: U.S. Census Bureau, Vintage 2025 Subcounty Population Estimates (May 2026) | Chart: CRE42

Map: Top 15 Cities 20,000+ by Cumulative Growth (2020–2025)
Forney (+78.9%), outside Dallas, leads all places of 20,000 or more for cumulative 2020–2025 growth; Haines City, Florida (+67.4%) and Hutto, Texas (+66.9%) follow.
Texas holds six of the top fifteen (Forney, Hutto, Georgetown, Leander, Kyle, Prosper); Utah holds two (Saratoga Springs, Eagle Mountain).
Places that crossed 20,000 after April 2020, including Celina and Fulshear, are excluded from this ranking by construction; see Methodology.

Florida: Growth Has Moved Inland

Fifty-five of Florida’s 122 cities of 20,000 or more lost population in 2024–2025. The declines concentrate in metro Miami (Hialeah –2,210, Miami Gardens –1,475, Miami Beach –1,024, Doral –996) and Pinellas County (St. Petersburg –1,822, Clearwater –1,699, Largo –1,241). The growth that remains runs through the interior and the Treasure Coast: the Polk and Lake County corridor between Orlando and Tampa (Haines City +9.96%, the fastest 1-year growth of any Florida city; Winter Haven +3.80%; Apopka +5.47%), Port St. Lucie (+9,131, the fourth-largest city gain nationally), Palm Bay (+4.77%), and Jacksonville (+8,319). Aggregate growth across Florida’s 20,000+ cities fell from roughly +235,000 in 2021–2022 to +72,000 in 2024–2025. Miami city proper grew 1.3% while its suburbs contracted, so the metro-level decline is a suburban phenomenon rather than an urban-core one.

Key Observations

Large metro growth tracks state-level patterns. Among the 35 U.S. metros with populations above 2 million, Texas’s four metros (Dallas, Houston, San Antonio, Austin) all rank in the top six for 5-year population growth. New York, California, and Illinois metros cluster near the bottom. The MSA Growth Quotient — which measures average growth rank across a state’s 2M+ metros — ranges from 32.8 (Texas) to 4.8 (Pennsylvania) on a 1–35 scale.
The latest year changed the metro rankings at both ends. Seattle and Indianapolis entered the 1-year top ten; Denver and Las Vegas exited. Miami, New York, and Boston entered the bottom ten as net international migration roughly halved. Only four large metros lost population outright: Los Angeles, San Diego, Miami, and Pittsburgh.
City-level data show growth rotating to the metro edge. Average 2024–2025 growth in cities of 250,000 or more fell from 0.9% to 0.3%, while Celina (+24.6%) and Fulshear (+21.0%), both Texas exurbs, grew fastest in the nation. Charlotte’s +20,731 was the largest absolute city gain.[1]
Florida’s city data reveal a coastal-to-interior rotation. Fifty-five of the state’s 122 cities of 20,000 or more shrank in 2024–2025, concentrated in metro Miami and Pinellas County, while interior corridor cities such as Haines City and Port St. Lucie posted nationally elite growth.

What to Watch For in 2026 and Beyond

Sources to Track Metro & City Growth in 2026:

Source Next Release Date Notes
Census Bureau — Vintage 2025 MSA Estimates MSA totals & components of change March 2026 (released) MSA-level data now available through July 2025; incorporated into this page
Census Bureau — Vintage 2025 City/Town Estimates Incorporated places 20,000+ May 2026 (released) City-level totals through July 2025; incorporated into this page
BLS — QCEW Q3 2025 county & metro employment/wages March 10, 2026 Most comprehensive measure of metro-level job growth; 450+ metros by industry
FHFA — House Price Index Q4 2025 quarterly report February 24, 2026 400+ metro home prices; interactive top-100 MSA ranking dashboard

Notes

[1] U.S. Census Bureau, “Population Growth Holds Steady in Midsized Cities Amid Widespread Slowdown,” press release, May 2026. Average growth rates by city-size class, the Austin and Raleigh population milestones, and regional counts of the fastest-growing places are from this release.

Sources

1. U.S. Census Bureau. Vintage 2025 MSA Population Estimates (March 2026). census.gov/metro-micro/tables

2. U.S. Census Bureau. Intercensal MSA Population Estimates: 2010–2020 (November 2024). census.gov/popest/intercensal-2010-2020-metro

3. U.S. Census Bureau. Vintage 2009 MSA Population Estimates: 2000–2009. census.gov/popest/2000-2009/metro

4. U.S. Census Bureau. Vintage 2025 Subcounty Population Estimates: Incorporated Places of 20,000 or More (May 2026). Files SUB-IP-EST2025-ANNRNK and SUB-IP-EST2025-CUMCHG. census.gov/popest/2020s-total-cities-and-towns

5. U.S. Census Bureau. “Population Growth Holds Steady in Midsized Cities Amid Widespread Slowdown.” Press release (May 2026). census.gov/newsroom/2026/vintage-2025-city-town-pop-estimates

Companion workbook. demographics-domestic-migration.xlsx — MSA population data (393 MSAs, 2000–2025), Growth Quotient analysis for 2M+ metros, state point allocation tables, and city-level tables for incorporated places of 20,000+ (2020–2025)

Methodology & Data Notes

MSA Population Data

MSA-level data spans three periods with different OMB boundary definitions. The 2010–2019 intercensal estimates and 2020–2025 Vintage 2025 estimates both use 2020 OMB MSA definitions and are directly comparable. The 2000–2009 Vintage 2009 estimates use pre-2010 OMB definitions. MSAs with material boundary changes between definitions are marked with an asterisk (*) in the spreadsheet. For most top-100 MSAs, the geographic composition is similar enough that growth rates are meaningful, but users should exercise caution when interpreting 25-year growth rates for MSAs that gained or lost counties between definitions (e.g., Charlotte, Grand Rapids, Durham).

City (Incorporated Place) Population Data

City-level figures come from the Census Bureau’s Vintage 2025 subcounty estimates (released May 2026). Two files with different universes are used. The annual file covers incorporated places of 20,000 or more on July 1, 2025 (1,959 places) and supports the 1-year rankings. The cumulative file covers places of 20,000 or more on April 1, 2020 (1,852 places) and supports the 2020–2025 rankings; places that crossed 20,000 after April 2020, such as Celina and Fulshear, Texas, appear only in the annual file. Estimates are as of July 1 each year except the April 1, 2020 base. Census designated places are not included. City tables and charts derive from the Cities tabs of the companion workbook.

MSA Growth Quotient

The Growth Quotient is an original metric that measures the average growth rank of a state’s 2M+ metros. The 35 MSAs with 2025 populations above 2 million are ranked 1 (slowest 5-year CAGR) through 35 (fastest). For multi-state MSAs, one point is split equally among constituent states (excluding D.C.). Each state’s “adjusted rank points” equal the sum of (rank × fractional point) across all its metros. The Growth Quotient equals adjusted rank points divided by appearance points, yielding the weighted average rank — interpretable as “where does the average metro in this state sit on a 1–35 growth scale.” A state with a single fast-growing metro and a state with four fast-growing metros can score similarly, isolating growth quality from breadth.

Growth Rate Calculations

CAGR (Compound Annual Growth Rate) = (End/Start)^(1/n) – 1, where n is the number of years. Cumulative growth = (End – Start) / Start. All growth rate columns in the spreadsheets are live Excel formulas that recalculate automatically when source data is updated.