Demographics

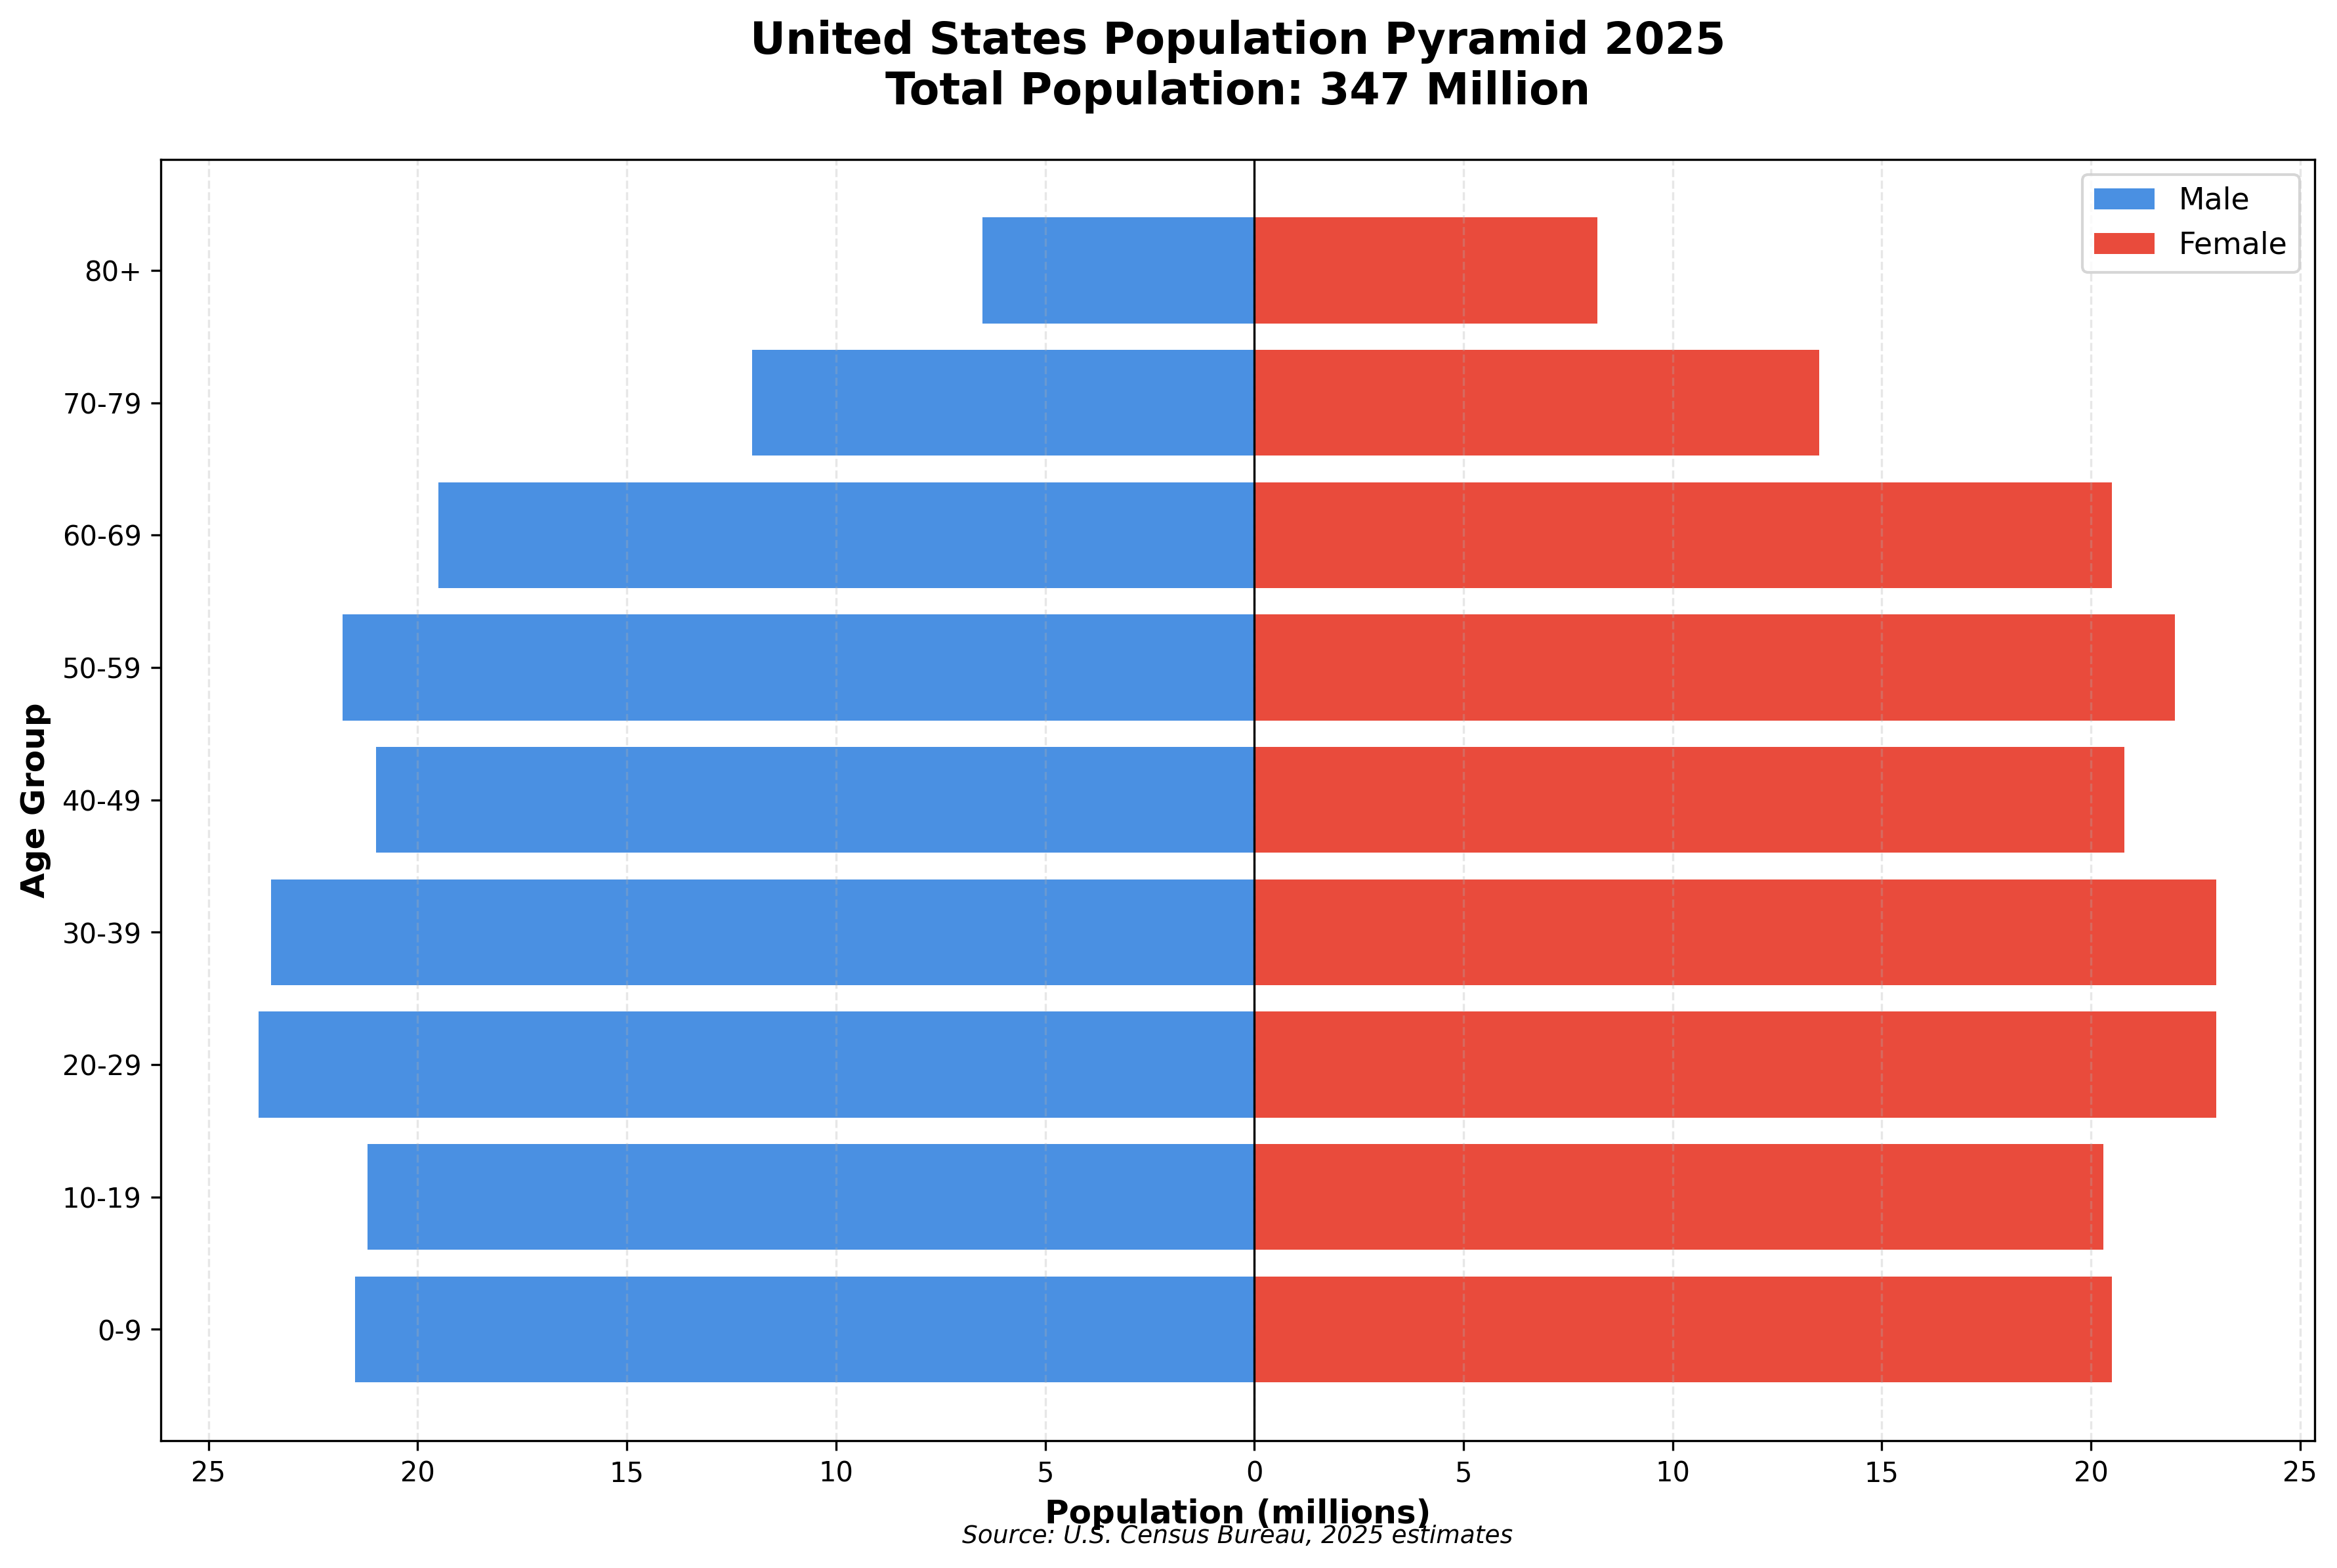
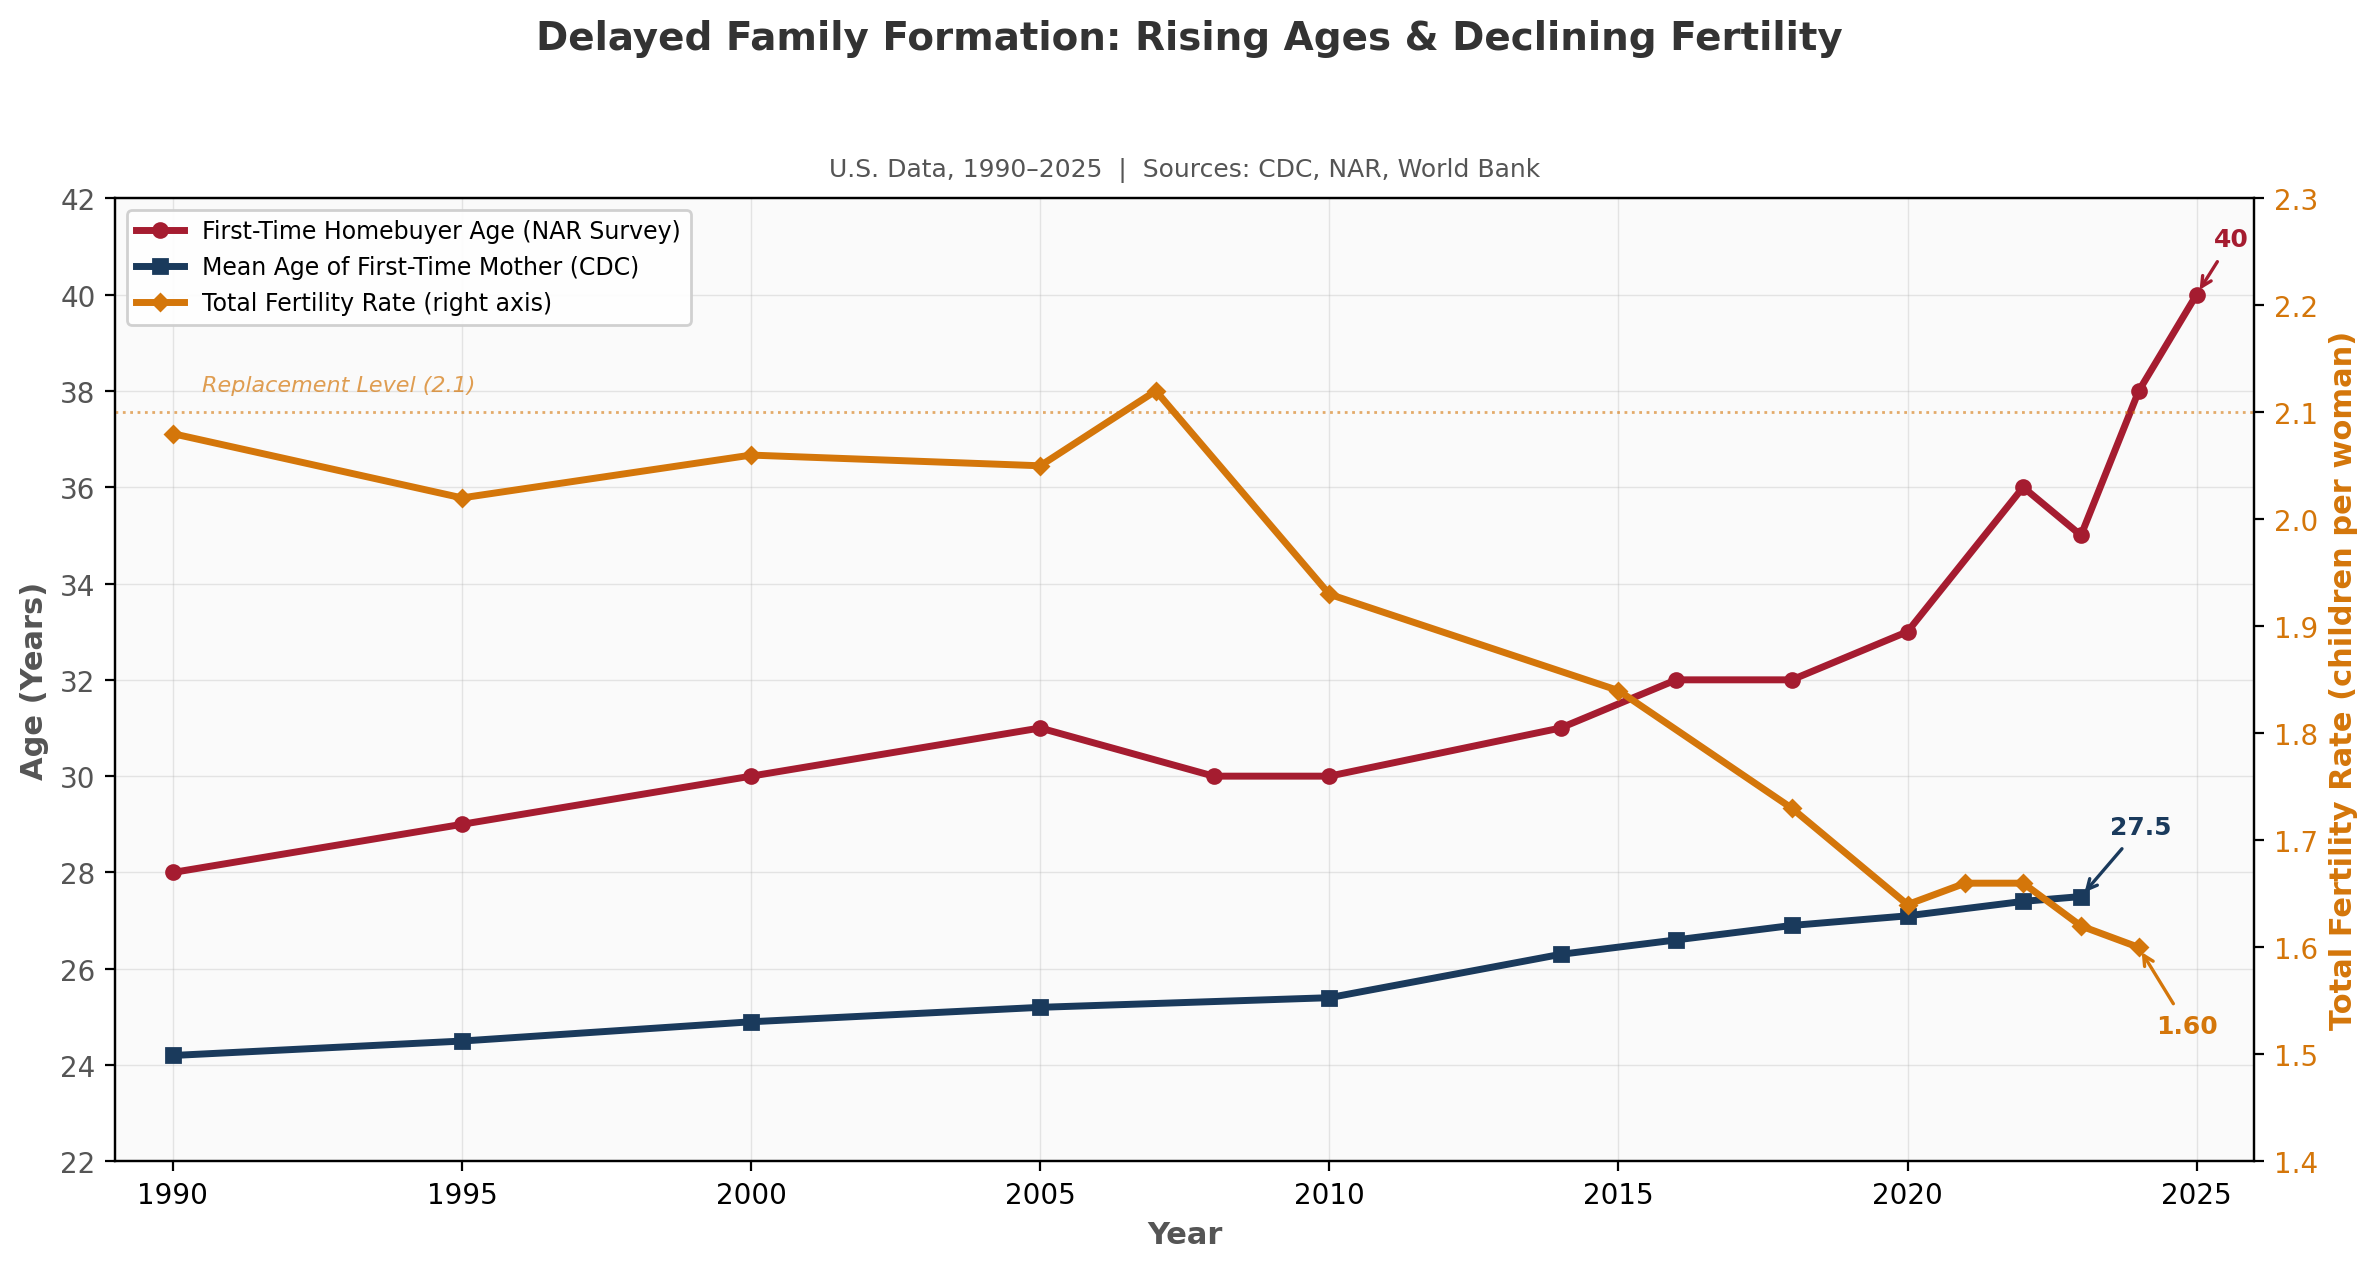
Millennials (age 29–44) and baby boomers (age 61–79) are currently the largest generations in the United States. As they graduate from entry level positions (millennials) and retire from the workforce (boomers), the much smaller Gen Z and Gen X cohorts are now filling those positions, contributing to nationwide labor shortages in industries including healthcare, construction, trucking, and logistics. This dynamic is even more pronounced in the rapidly aging nations of developed Europe and Asia, with China, Japan, and many Western European nations feeling the stress of top-heavy populations, placing additional burden on younger and smaller generations. The U.S. is increasingly following this demographic path, with reduced birthrates leading to delayed family formation and homeownership, and (more recently) reduced net immigration. This section summarizes and provides measurable context for demographic shifts currently in motion as respective generations change with the passage of time. As a CRE investor, demographics are key to understanding the evolving shape and texture of demand for multifamily/residential housing, senior living, office use, industrial distribution and manufacturing, and retail space.

U.S. Population Pyramid 2025 Family Formation Trends
U.S. Demographics and Economic Forces
Millennial delayed homeownership, Boomer senior housing demand, Gen X/Z generational sizing, fertility decline, and the sharp immigration slowdown from the January 2026 Census estimates
Global Demographics: Economic Competitiveness & Import/Export Trends
Four-country population pyramid comparison; Mexico’s nearshoring labor advantage, China/Germany automation imperative, manufacturing wages, industrial robot density, Japanese homebuilders acquiring U.S. companies
Delayed Family Formation Impact on Housing Demand
NAR first-time homebuyer age hits 40 (2025); fertility falls to 1.60; $84–105T wealth transfer bifurcating the housing market; prime rental-age population peaks ~2028 then declines — multifamily demand implications through the 2030s
U.S. Senior Population Growth and Senior Living Demand
75+ population grows from 27.4M to 44.8M by 2045 (+64%); peak Boomer cohorts turn 75 in 2032–2036; 85+ doubles to 16M; care-level demand drivers and supply-demand gap implications
Domestic Migration & Regional Growth
Florida, Texas account for 45% of U.S. population growth (2020–2024); pandemic-era migration patterns and their persistence; reshaping CRE demand concentration across Sun Belt metros
U.S. State Population Pyramids
Interactive population pyramids for all 50 states and D.C., built from the 2024 American Community Survey 5-Year Estimates. Click any state on the map to see its age and sex distribution — a foundational tool for assessing senior housing, multifamily, and workforce-driven CRE demand by geography.
Immigration & Labor Markets
Net immigration fell 54% to 1.3M in 2025; Census projects further decline to ~321K by mid-2026; critical variable for housing demand and labor force growth

Key Data Sources & Research

U.S. Census Bureau
www.census.gov - Population estimates, American Housing Survey, migration data
CDC National Vital Statistics
www.cdc.gov - Birth rates, maternal age, mortality data
National Association of Realtors
www.nar.realtor - Homebuyer profiles, market trends
Federal Reserve (FRED)
fred.stlouisfed.org - Economic data, housing statistics
UN Population Division
population.un.org - Global demographic forecasts
Bureau of Labor Statistics
www.bls.gov - Labor force data, unemployment trends
International Federation of Robotics
ifr.org - Industrial robot density, global automation data