Overview
U.S. Federal debt surpassed $35.5 trillion at the end of FY2024, exceeding 121% of GDP — well beyond the 100% level historically considered high risk. With the U.S. continuing to run large fiscal deficits, financial markets and many experts foresee elevated inflation going forward, as reflected by the elevated yield associated with the 10-year UST, which has not (as of February 2026) responded to short-term interest rate cuts from the Federal Reserve. Optimists believe inflation and long-term rates will naturally fall with increased AI / technology-driven productivity gains, strong economic growth, and the maintenance of the U.S. dollar as the world’s reserve currency.
U.S. Federal Debt vs. Nominal GDP, 1960–2024
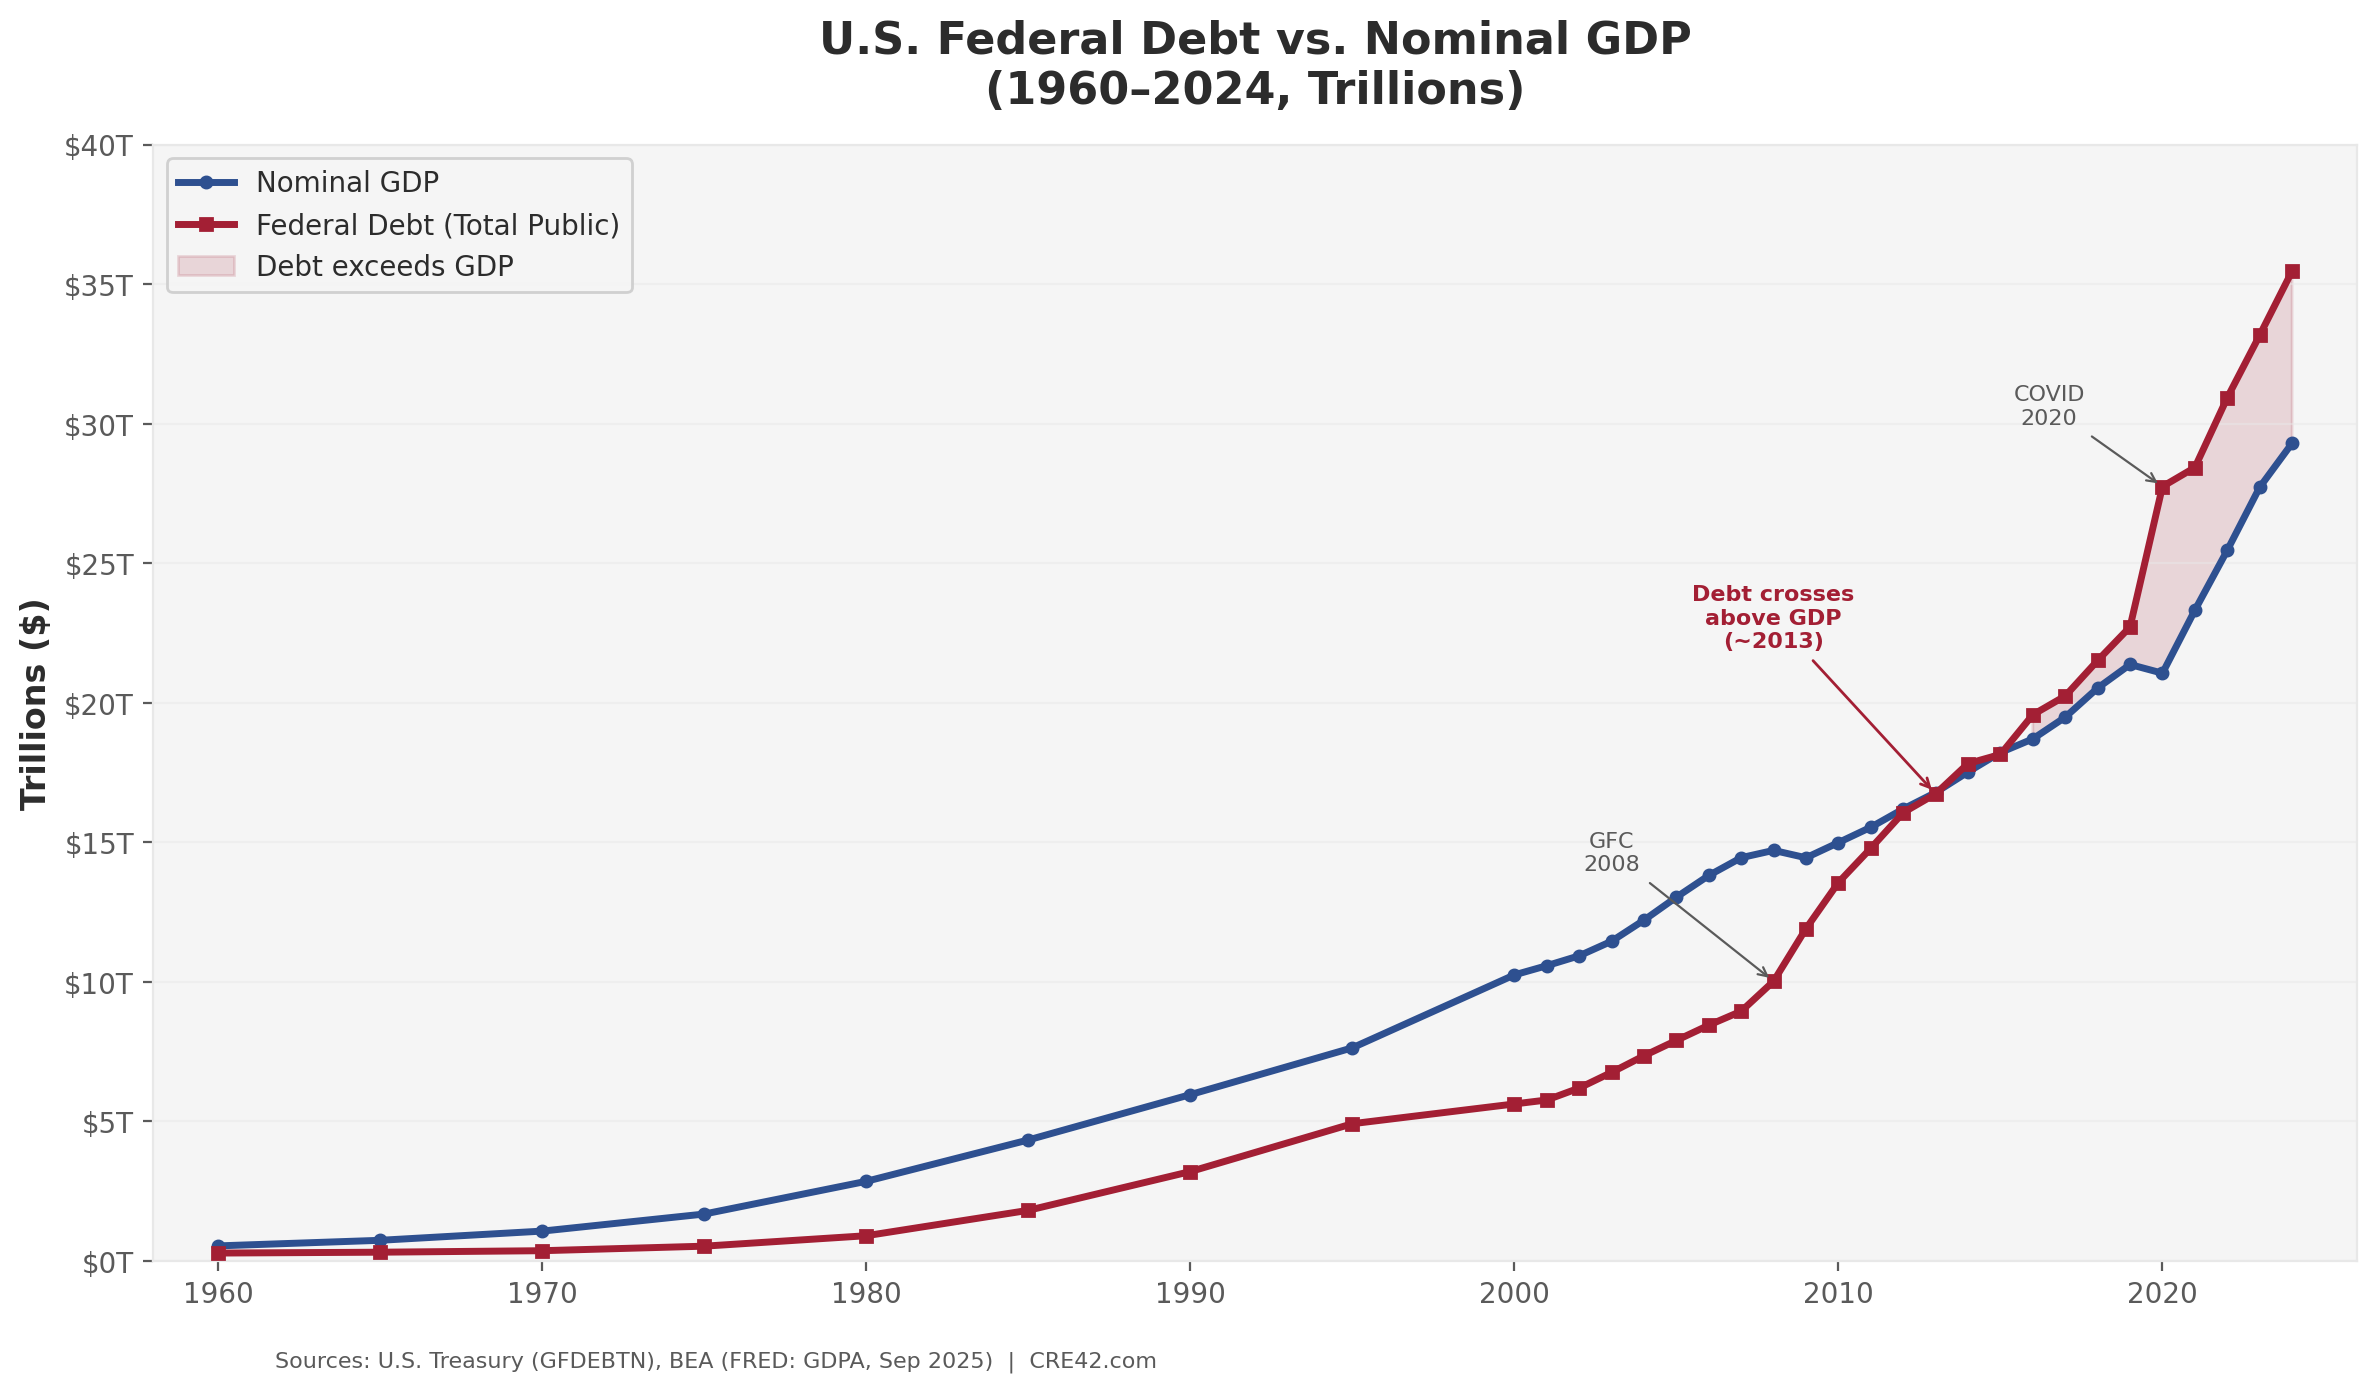
Federal debt crossed above nominal GDP around 2013 and the gap has widened since. Source: U.S. Treasury (GFDEBTN), BEA (FRED: GDPA) | Analysis: CRE42.com
Key Observations
Historical Context & Scale
From 1960 to 1980, federal debt hovered between 30–35% of GDP — low enough to be a non-issue in most economic discussions. The Reagan-era defense buildup doubled the debt in dollar terms during the 1980s, pushing the ratio toward 60%. That threshold — the same one later enshrined in the EU’s Maastricht Treaty — prompted genuine bipartisan alarm in the 1990s and was a driving force behind the deficit reduction efforts that produced brief budget surpluses under Clinton (along with massive windfall capital gains tax receipts associated with the dotcom boom). The ratio dipped to ~55% by 2000, the lowest since the early 1980s. Then came the GFC, then the post-GFC recovery spending, then COVID.
In their 2009 study This Time Is Different, economists Carmen Reinhart and Kenneth Rogoff examined eight centuries of sovereign debt crises. Their most striking finding for our purposes: 84% of middle-income country sovereign defaults between 1970 and 2008 occurred at debt-to-GNP ratios below 100%. The U.S. now sits at 121%. The important caveat: the U.S. is a high-income country, issues debt in its own currency, and the dollar remains the world’s reserve currency — advantages no defaulting sovereign has ever enjoyed. Outright default on U.S. Treasuries is near-unimaginable. But the alternative — creating money to service the debt — is inherently inflationary.
The FY2024 federal deficit was approximately $1.83 trillion — the third-largest in history outside of the pandemic years. Annual interest payments on the debt have surpassed $1 trillion and now exceed defense spending for the first time in U.S. history. The Congressional Budget Office projects deficits remaining above $1.5 trillion annually through the foreseeable future, regardless of which party controls the budget. This is not a cyclical problem being driven by recession-era emergency spending; it is structural.
Annual Growth: Debt vs. Nominal GDP vs. Real GDP (2001–2024)
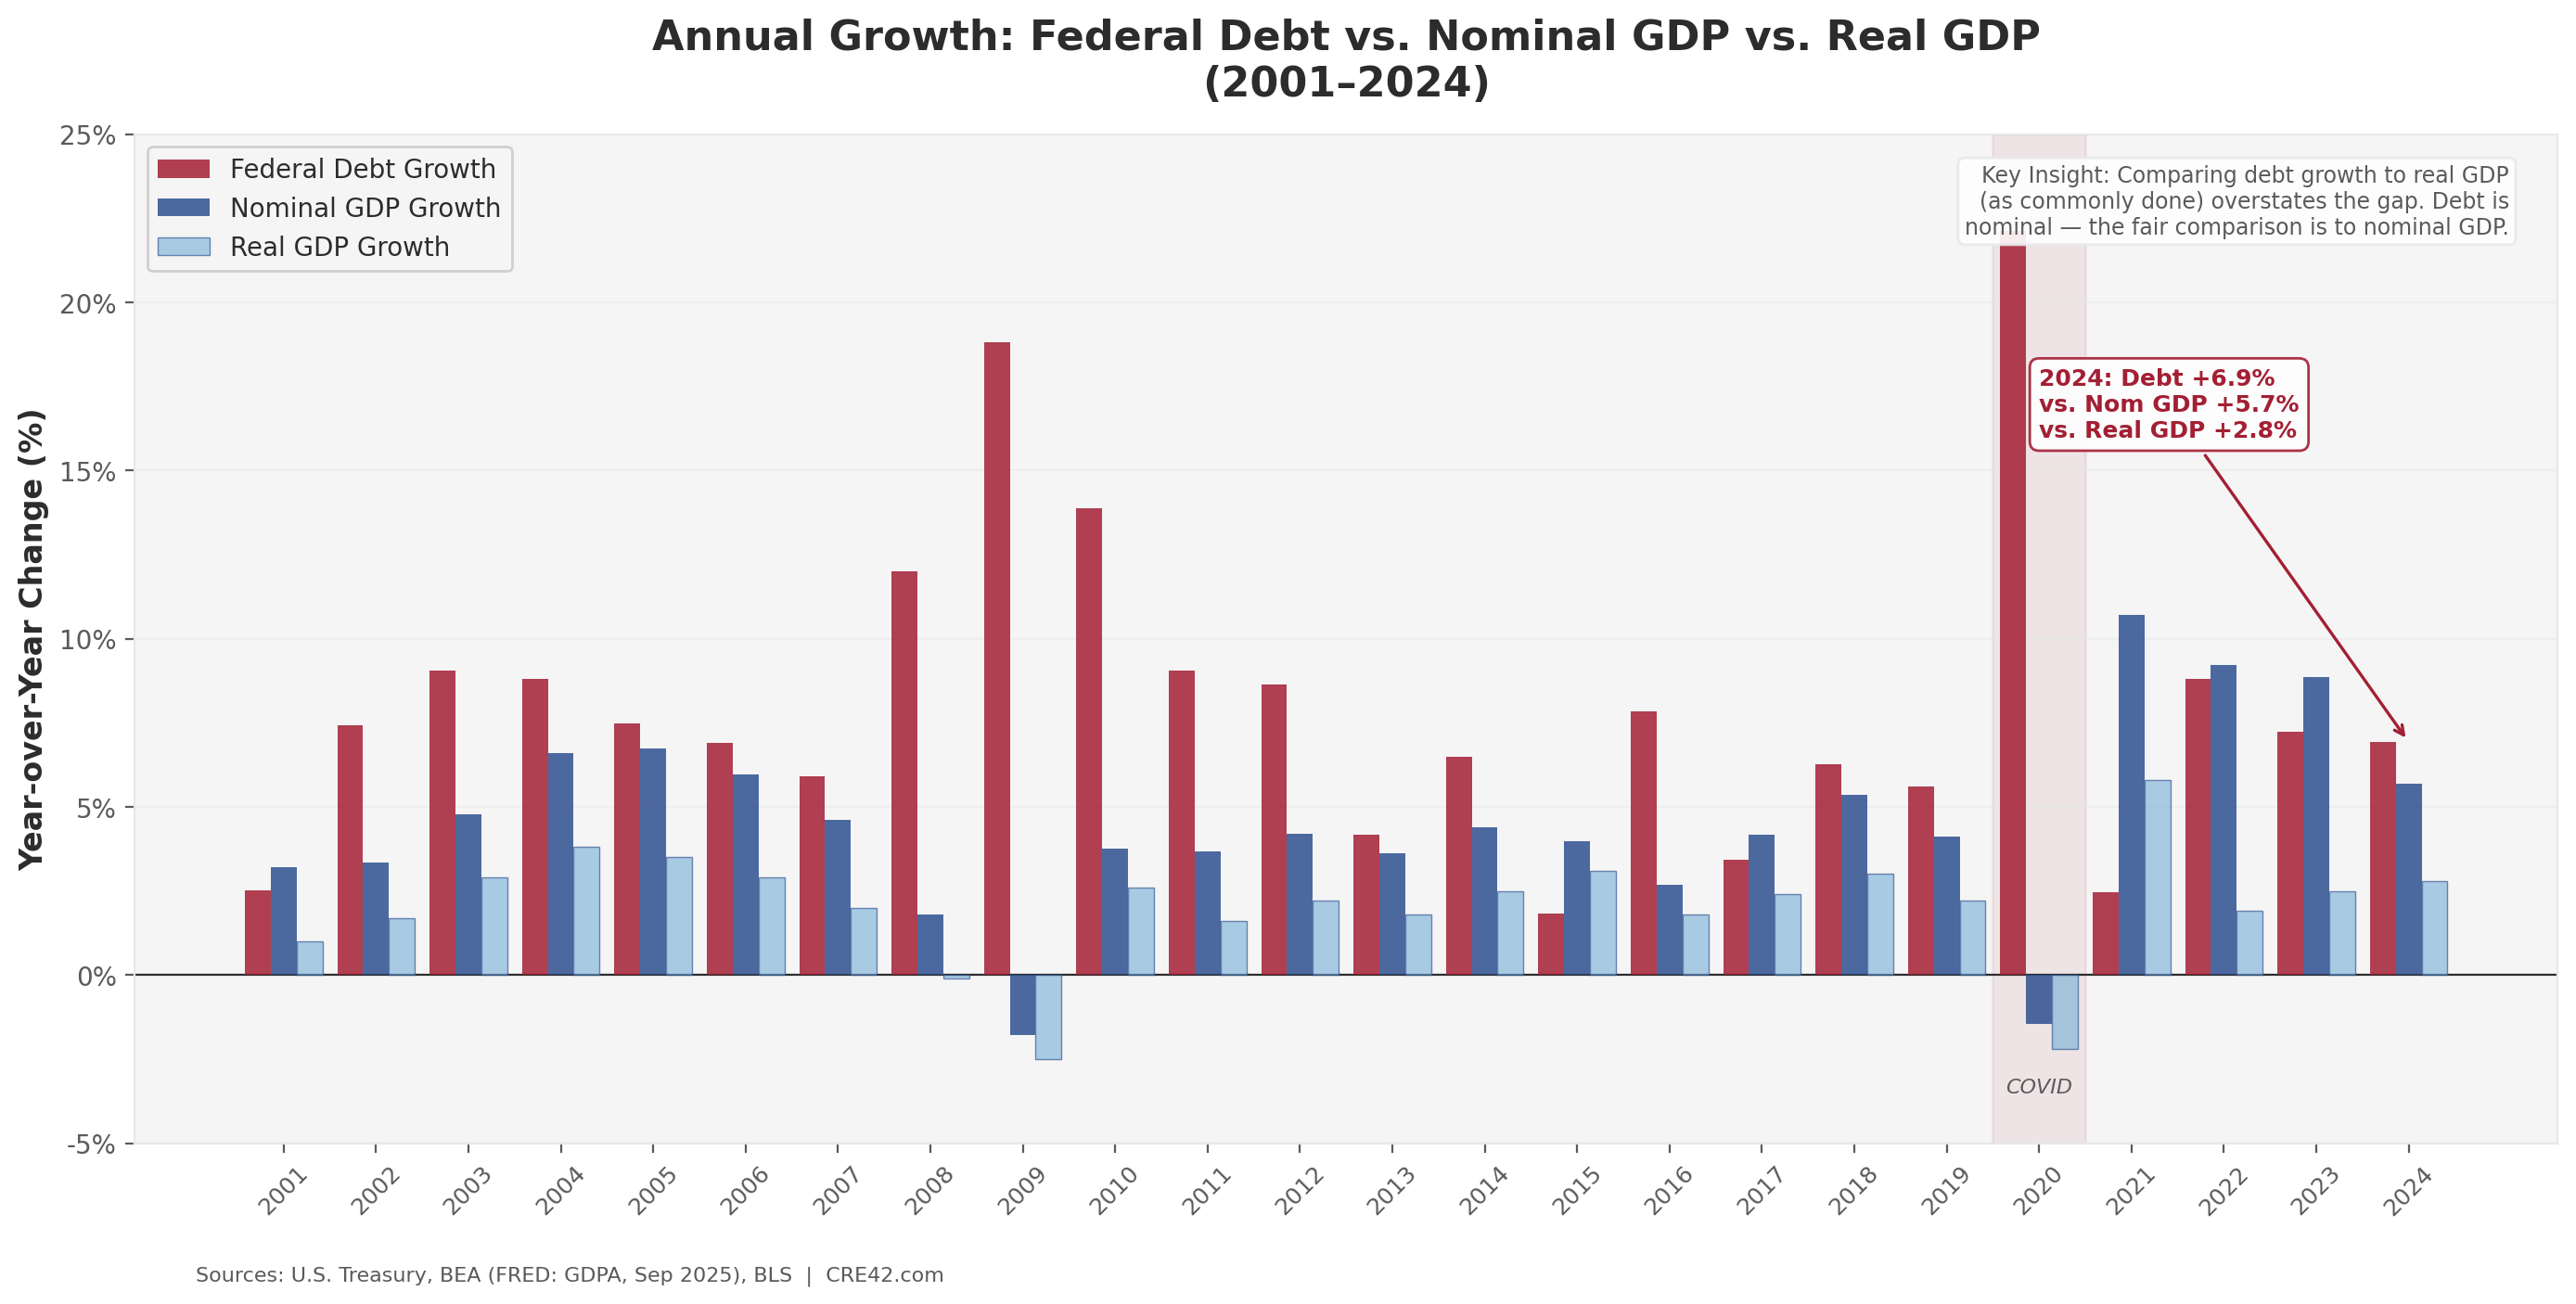
The three-bar comparison reveals the central analytical question: should debt growth be compared to nominal or real GDP growth? The answer fundamentally changes the sustainability narrative. Source: U.S. Treasury, BEA, BLS | Analysis: CRE42.com
Debt-to-GDP Ratio Trajectory, 1960–2024
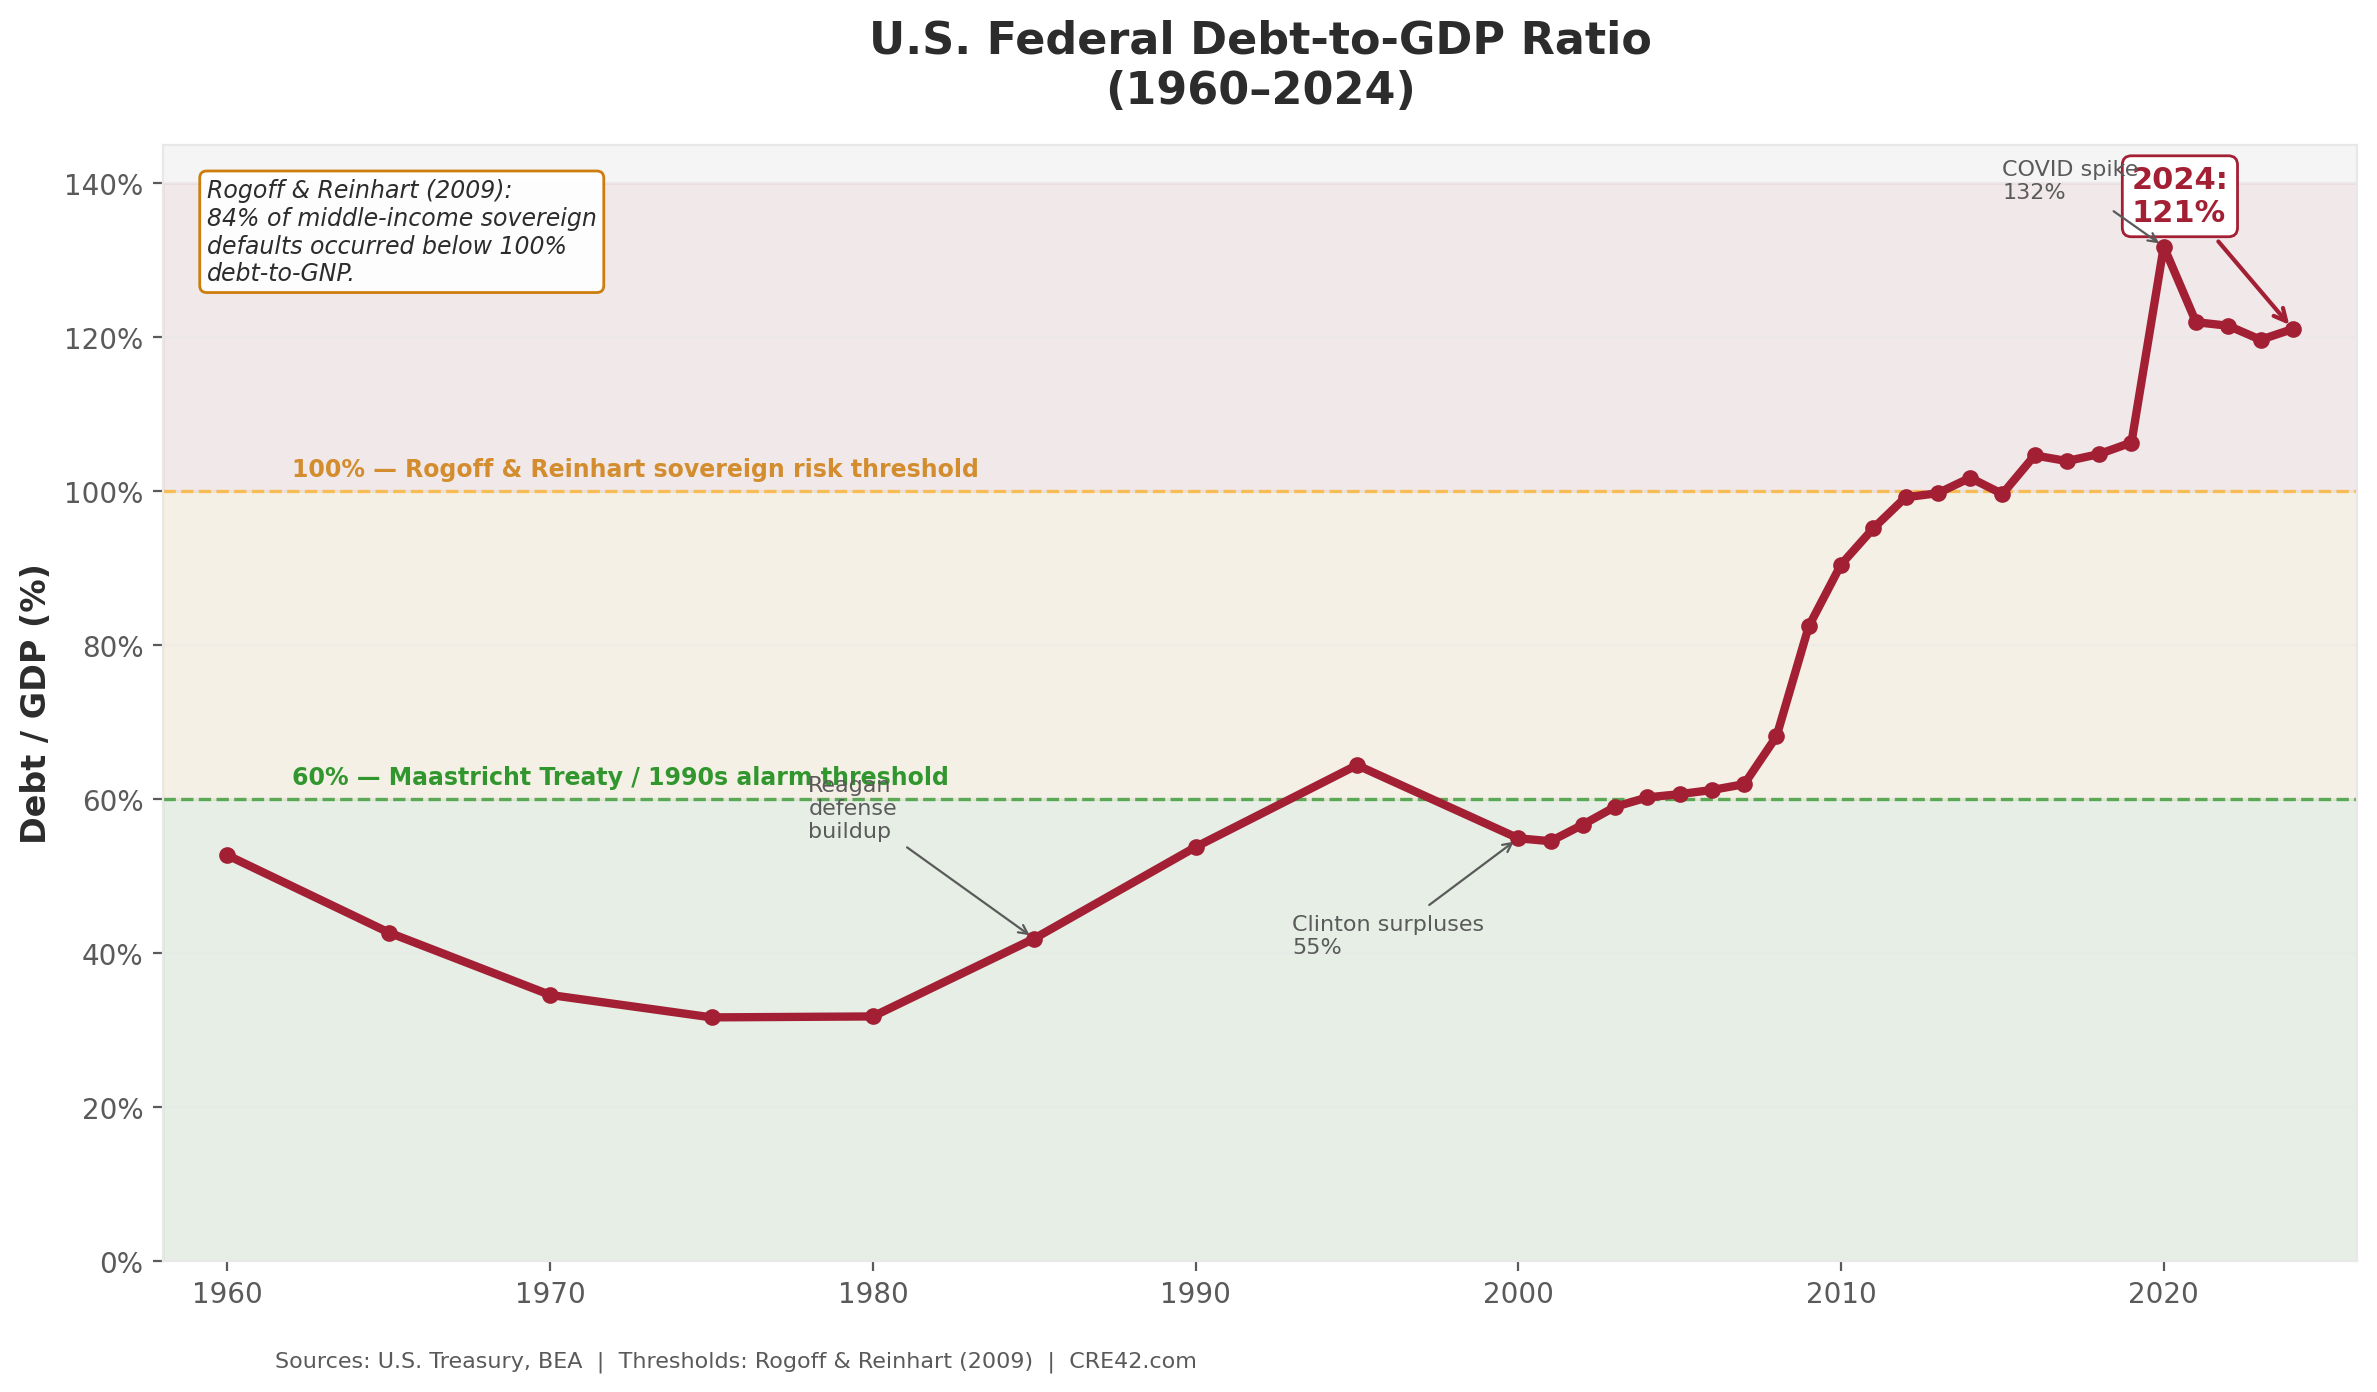
The U.S. has blown through both the 60% “grave concern” threshold of the 1990s and the 100% “danger zone” identified by Rogoff & Reinhart. Current level: 121%. Source: U.S. Treasury, BEA | Analysis: CRE42.com
The Debasement Trade: Gold, Silver & Bitcoin (Dec 2019–Feb 2026)
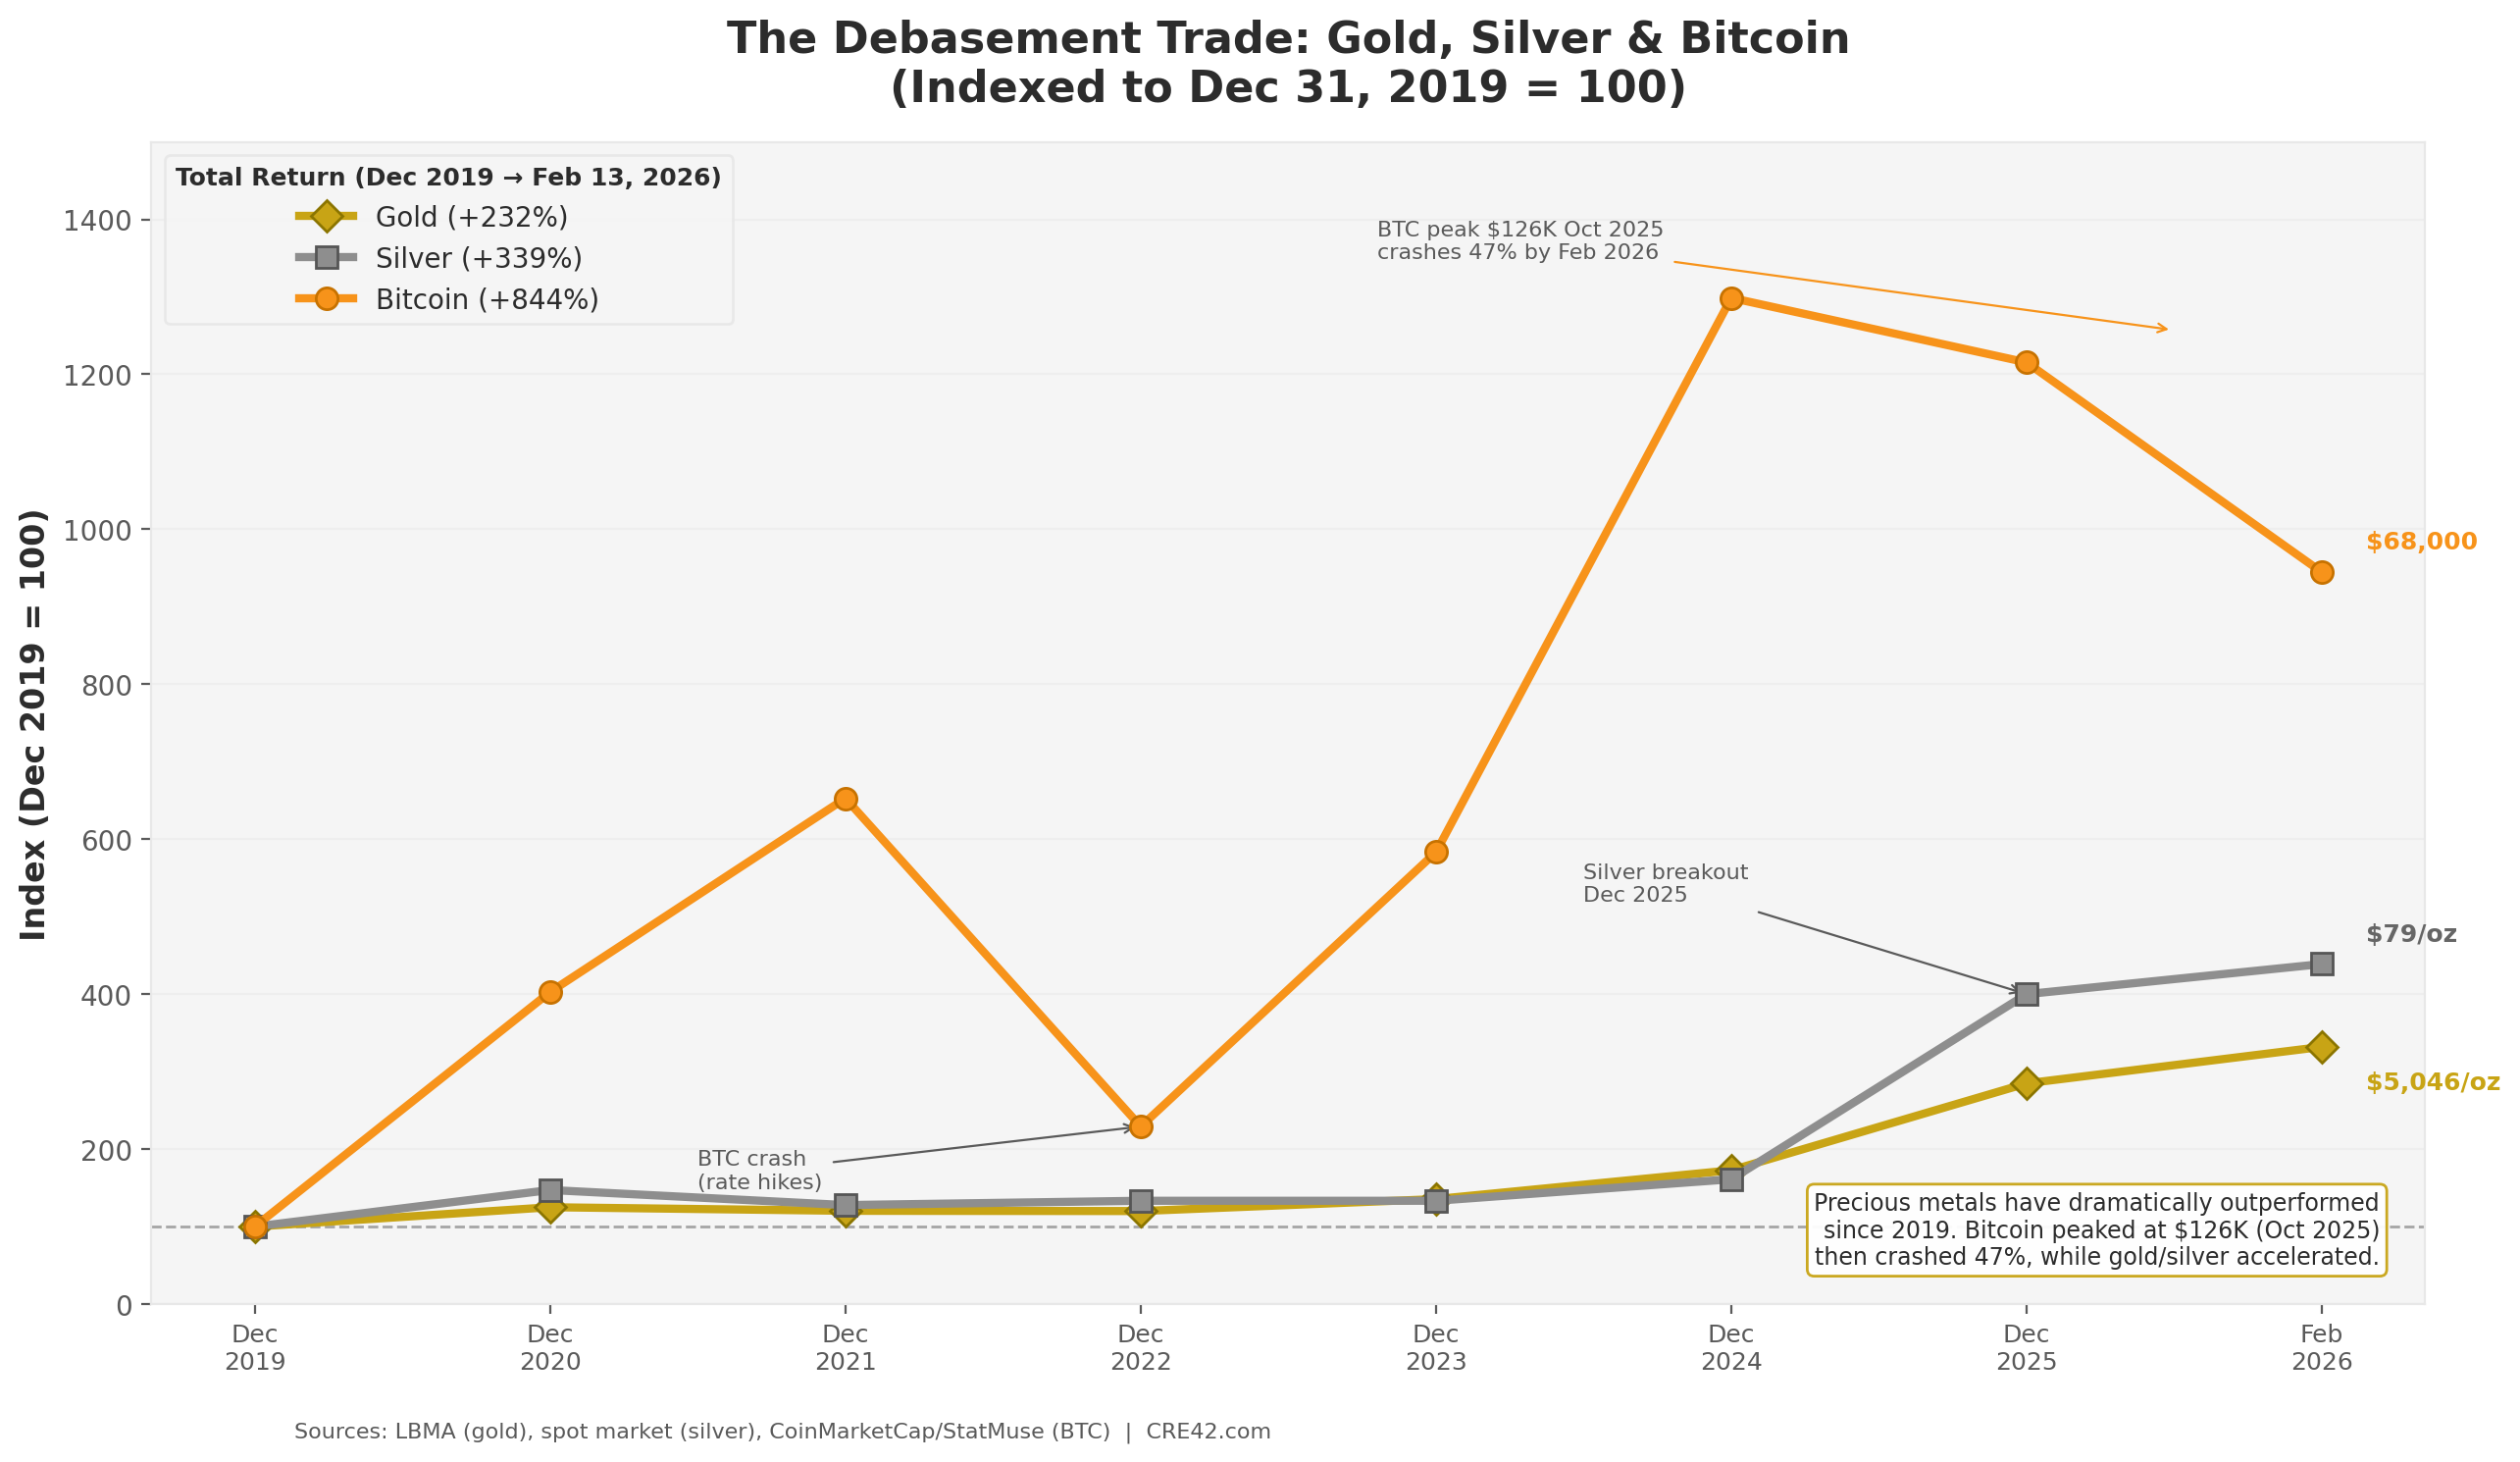
All three “debasement trade” assets have dramatically outperformed the S&P 500 since end of 2019, though Bitcoin crashed 47% from its October 2025 ATH while precious metals accelerated. Indexed to Dec 31, 2019 = 100. Sources: LBMA, spot market, CoinMarketCap | Analysis: CRE42.com
Trailing 12 Months: Precious Metals vs. Bitcoin
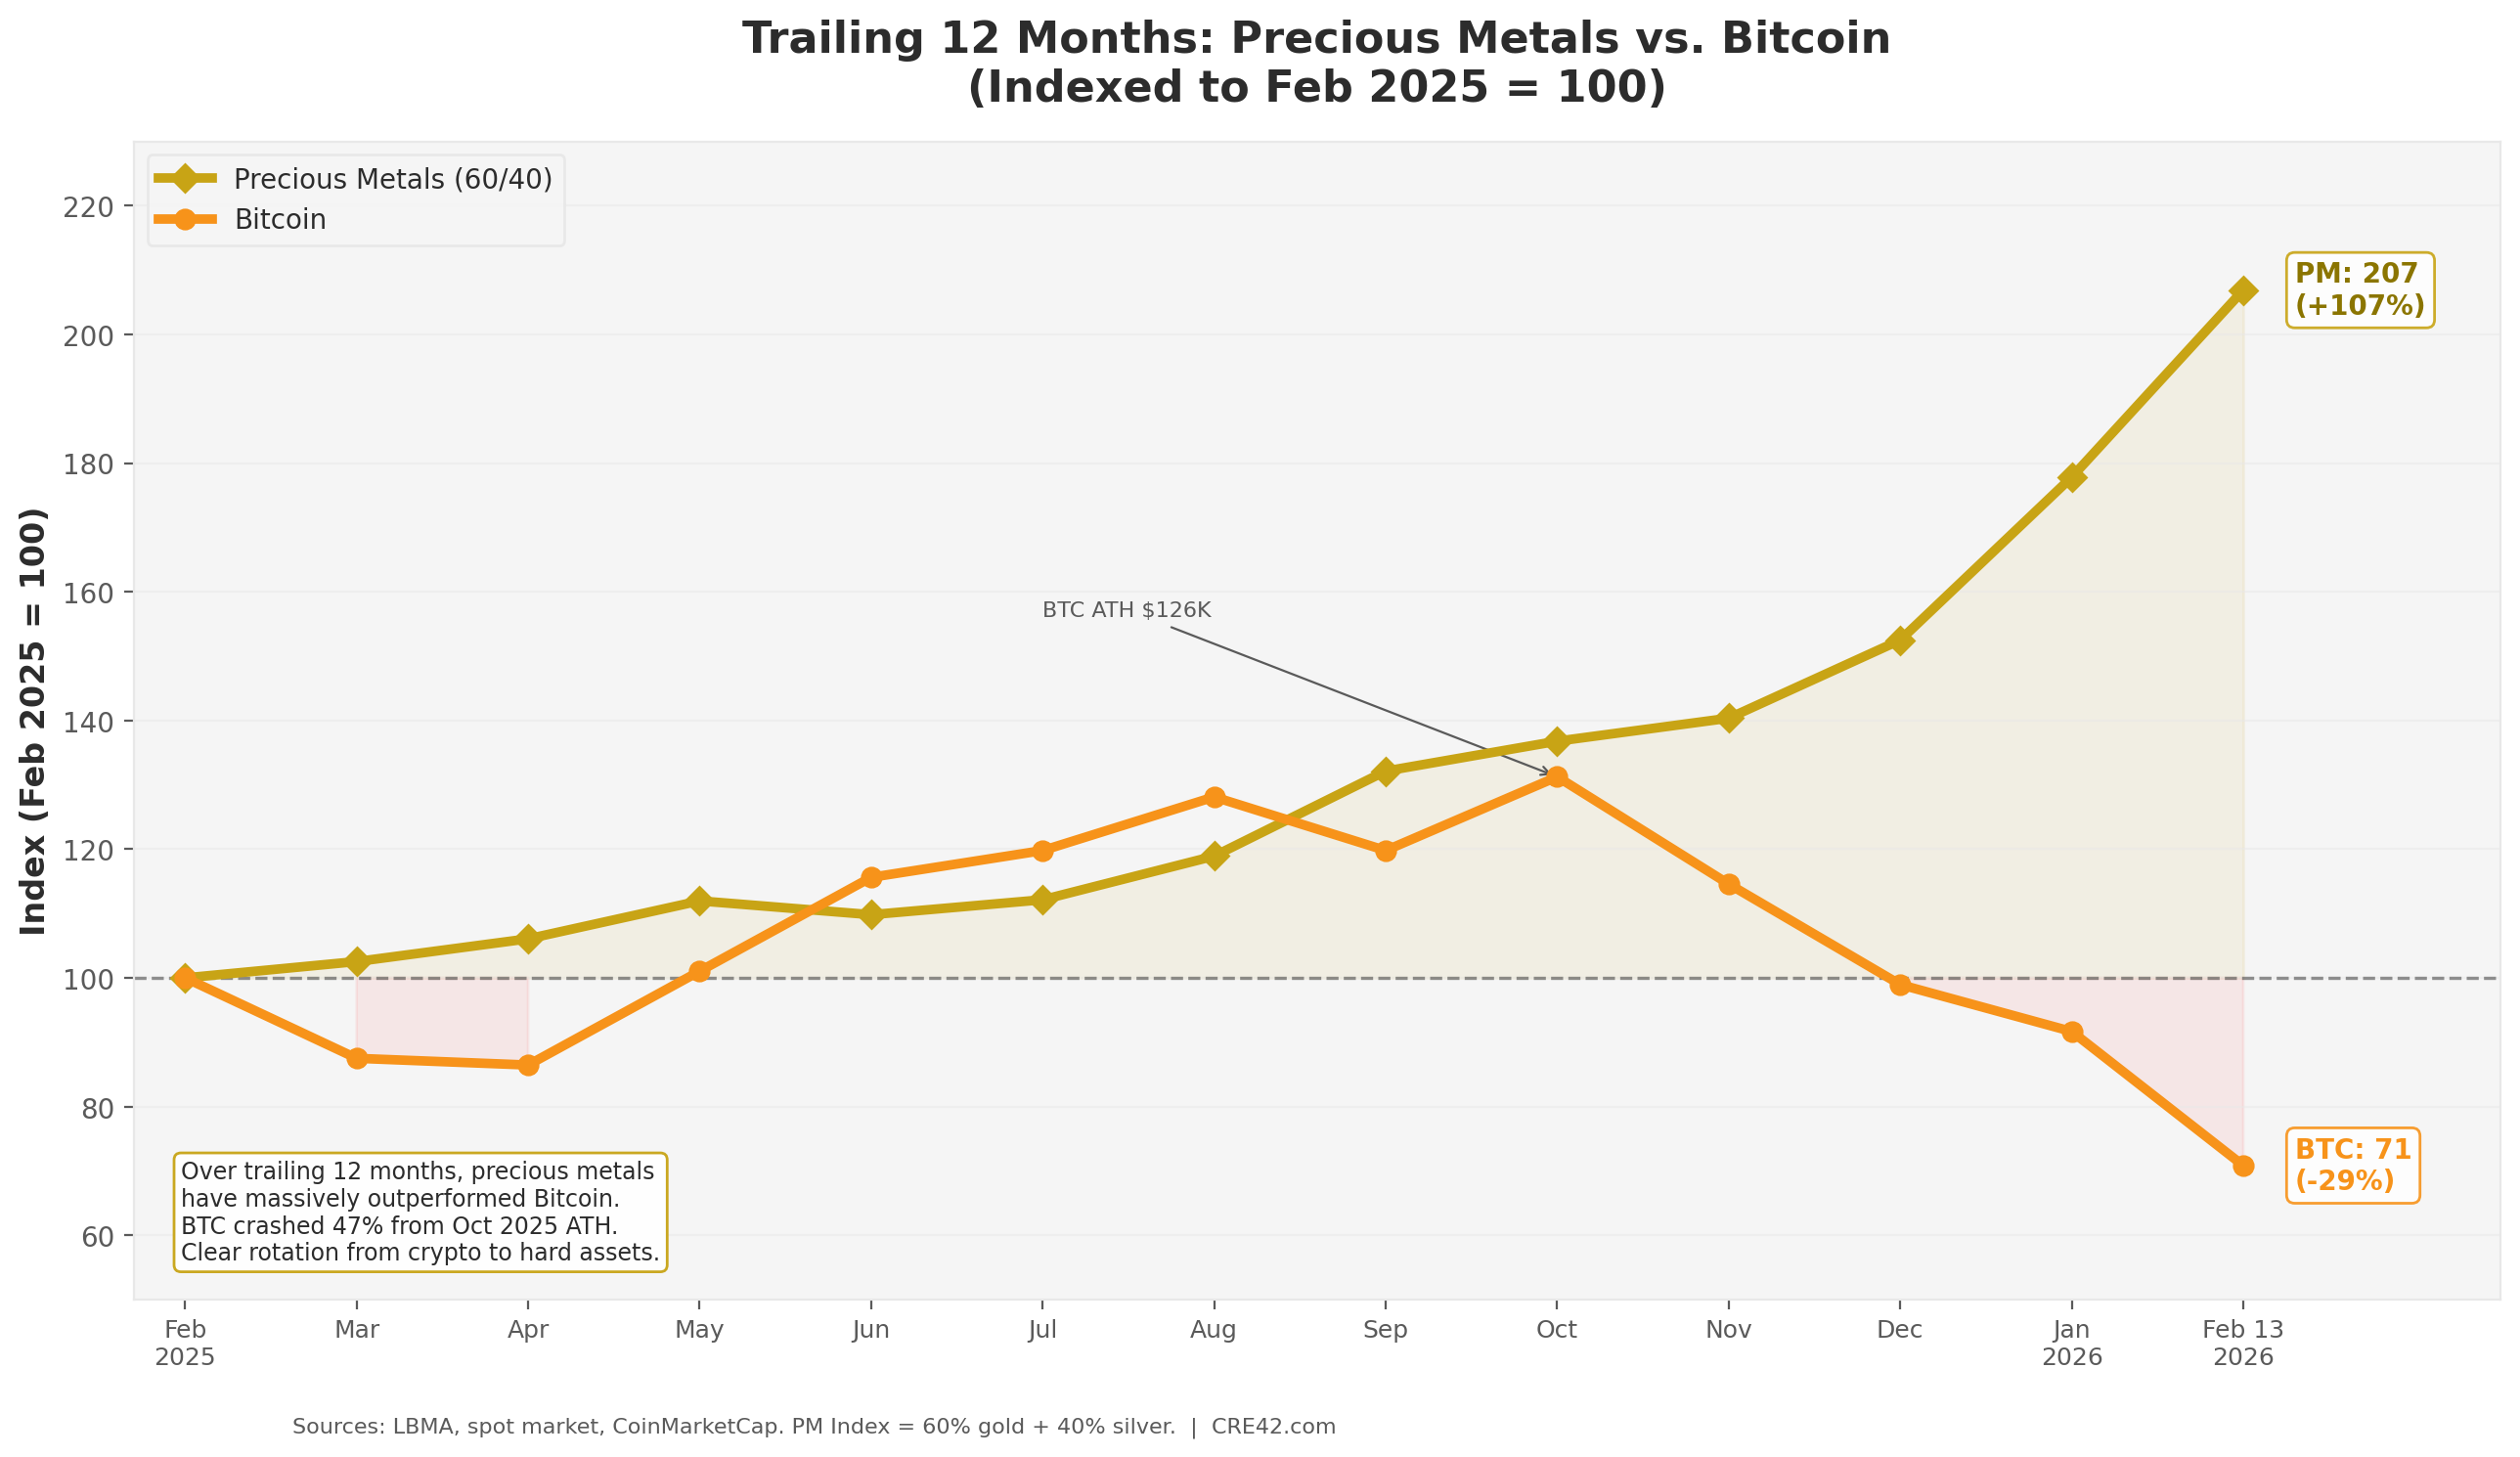
Over the trailing 12 months, the 60/40 gold/silver index has gained 107% while Bitcoin has declined 29% — a clear rotation from speculative crypto into traditional hard assets. Indexed to Feb 2025 = 100. Sources: LBMA, spot market, CoinMarketCap | Analysis: CRE42.com
Document Links
inflation-national-debt.xlsx — Historical data 1960–2024, debt vs. GDP growth comparison, debasement trade, embedded charts, sources & methodology
Sources
1. U.S. Treasury Department. “Monthly Statement of the Public Debt.” FRED Series GFDEBTN. fred.stlouisfed.org/series/GFDEBTN
2. Bureau of Economic Analysis (BEA). “Gross Domestic Product.” FRED Series GDPA (Sep 2025 revision). CY2024: $29,298B. fred.stlouisfed.org/series/GDPA
3. Bureau of Economic Analysis (BEA). Table 1.1.1: Percent Change From Preceding Period in Real Gross Domestic Product. CY2024: 2.8% (third estimate, Mar 2025). bea.gov/data/gdp
4. Bureau of Labor Statistics (BLS). CPI-U, All Items, 1982–84=100. fred.stlouisfed.org/series/CPIAUCSL
5. Office of Management and Budget (OMB). Historical Tables. whitehouse.gov/omb/budget/historical-tables
6. Congressional Budget Office (CBO). Budget and Economic Outlook. cbo.gov/topics/budget
7. Government Accountability Office (GAO). FY2024 Financial Report of the U.S. Government (GAO-25-107138). Total debt: $35.5T. Gross interest: $1,126.5B. gao.gov/products/gao-25-107138
8. Carmen M. Reinhart and Kenneth S. Rogoff. This Time Is Different: Eight Centuries of Financial Folly. Princeton University Press, 2009.
9. Olivier Blanchard. “Public Debt and Low Interest Rates.” AEA Presidential Address, American Economic Review, 2019.
10. Peter G. Peterson Foundation. “What Is R Versus G and Why Does It Matter for the National Debt?” April 2025. pgpf.org
11. Stanford Institute for Economic Policy Research (SIEPR). “The US Budget Math Is Looking Dangerous.” 2025.
12. Capital Group. “What Happens If U.S. Debt Becomes Unsustainable?” September 2025.
13. CRE42.com Debt & GDP Data Model. inflation-national-debt.xlsx
Debasement Trade Data Sources:
• Gold: LBMA London PM Fix (year-end approximation). USAGOLD, exchange-rates.org.
• Silver: Spot market year-end close. JM Bullion, TradingEconomics.
• Bitcoin: CoinMarketCap / StatMuse (year-end close). Dec 31, 2025: $87,502. ATH: $126,000 (Oct 2025). Feb 13, 2026: ~$68,000 (CoinDesk, U.Today).
• TTM Monthly: Approximate first-trading-day prices from LiteFinance, exchange-rates.org, CoinDesk. 60/40 precious metals weighting is illustrative.
Methodology & Data Notes
Debt-to-GDP Calculation
Fiscal year-end debt (September 30) divided by calendar year GDP, multiplied by 100. This minor timing mismatch (FY ends Sept, CY ends Dec) follows the convention used by OMB and CBO in official publications. FY2024 debt: $35.5T (GAO audit). CY2024 GDP: $29,298B (BEA/FRED GDPA, Sep 2025 revision). Resulting ratio: 121.0%.
Nominal vs. Real GDP
Debt is denominated in nominal dollars. The standard debt sustainability comparison (the “r versus g” framework popularized by Blanchard, 2019) operates entirely in nominal terms: debt is sustainable when nominal GDP growth (g) exceeds the nominal interest rate on government debt (r). Comparing debt growth to real GDP growth implicitly ignores that inflation erodes the real burden of existing debt. Both comparisons are presented in the data model — with the nominal comparison labeled as the standard framework and the real comparison provided for context.
2024 Data Summary
FY2024 deficit: $1.833T (Treasury MTS Final). Debt growth FY2023→FY2024: 6.9%. Nominal GDP growth CY2023→CY2024: 5.7%. Real GDP growth CY2024: 2.8% (BEA third estimate, Mar 2025). GDP deflator 2024: 2.4%. Gap (debt growth vs. nominal GDP growth): 1.2 percentage points. Gap (debt growth vs. real GDP growth): 4.1 percentage points.
Interest on Debt
Multiple measures exist: GAO reports gross interest of $1,126.5B for FY2024; CBO reports net interest outlays of $949B; the American Action Forum cites $882B. Differences reflect treatment of intragovernmental interest (e.g., interest credited to Social Security trust funds). All sources confirm FY2024 was the first year interest payments exceeded defense spending.
Debasement Trade Methodology
Year-end closing prices (Dec 31) from the sources cited above. The Feb 2026 data point uses Feb 13, 2026. The trailing 12-month comparison indexes all assets to Feb 2025 = 100 and uses approximate first-trading-day-of-month prices. The 60/40 gold/silver weighting for the “Precious Metals Index” is illustrative, chosen to reflect gold’s larger market capitalization while giving meaningful weight to silver’s recent outperformance.
Rogoff & Reinhart Threshold
The 100% debt-to-GDP threshold referenced throughout this analysis comes from Reinhart and Rogoff (2009). The original study found that 84% of middle-income sovereign defaults occurred below this level. Their subsequent work (2010) on “Growth in a Time of Debt” suggested GDP growth slows above 90% debt-to-GDP, though this specific finding was later contested due to a coding error identified by Herndon, Ash, and Pollin (2013). The broader qualitative finding — that very high debt levels are associated with elevated sovereign risk — remains widely accepted.