U.S. Multifamily Supply Cycle: Boom, Bust, Construction Cliff
▸ THIS SECTION INCLUDES PROPRIETARY DATA AND IS NOT AVAILABLE FOR PUBLIC USE
Overview
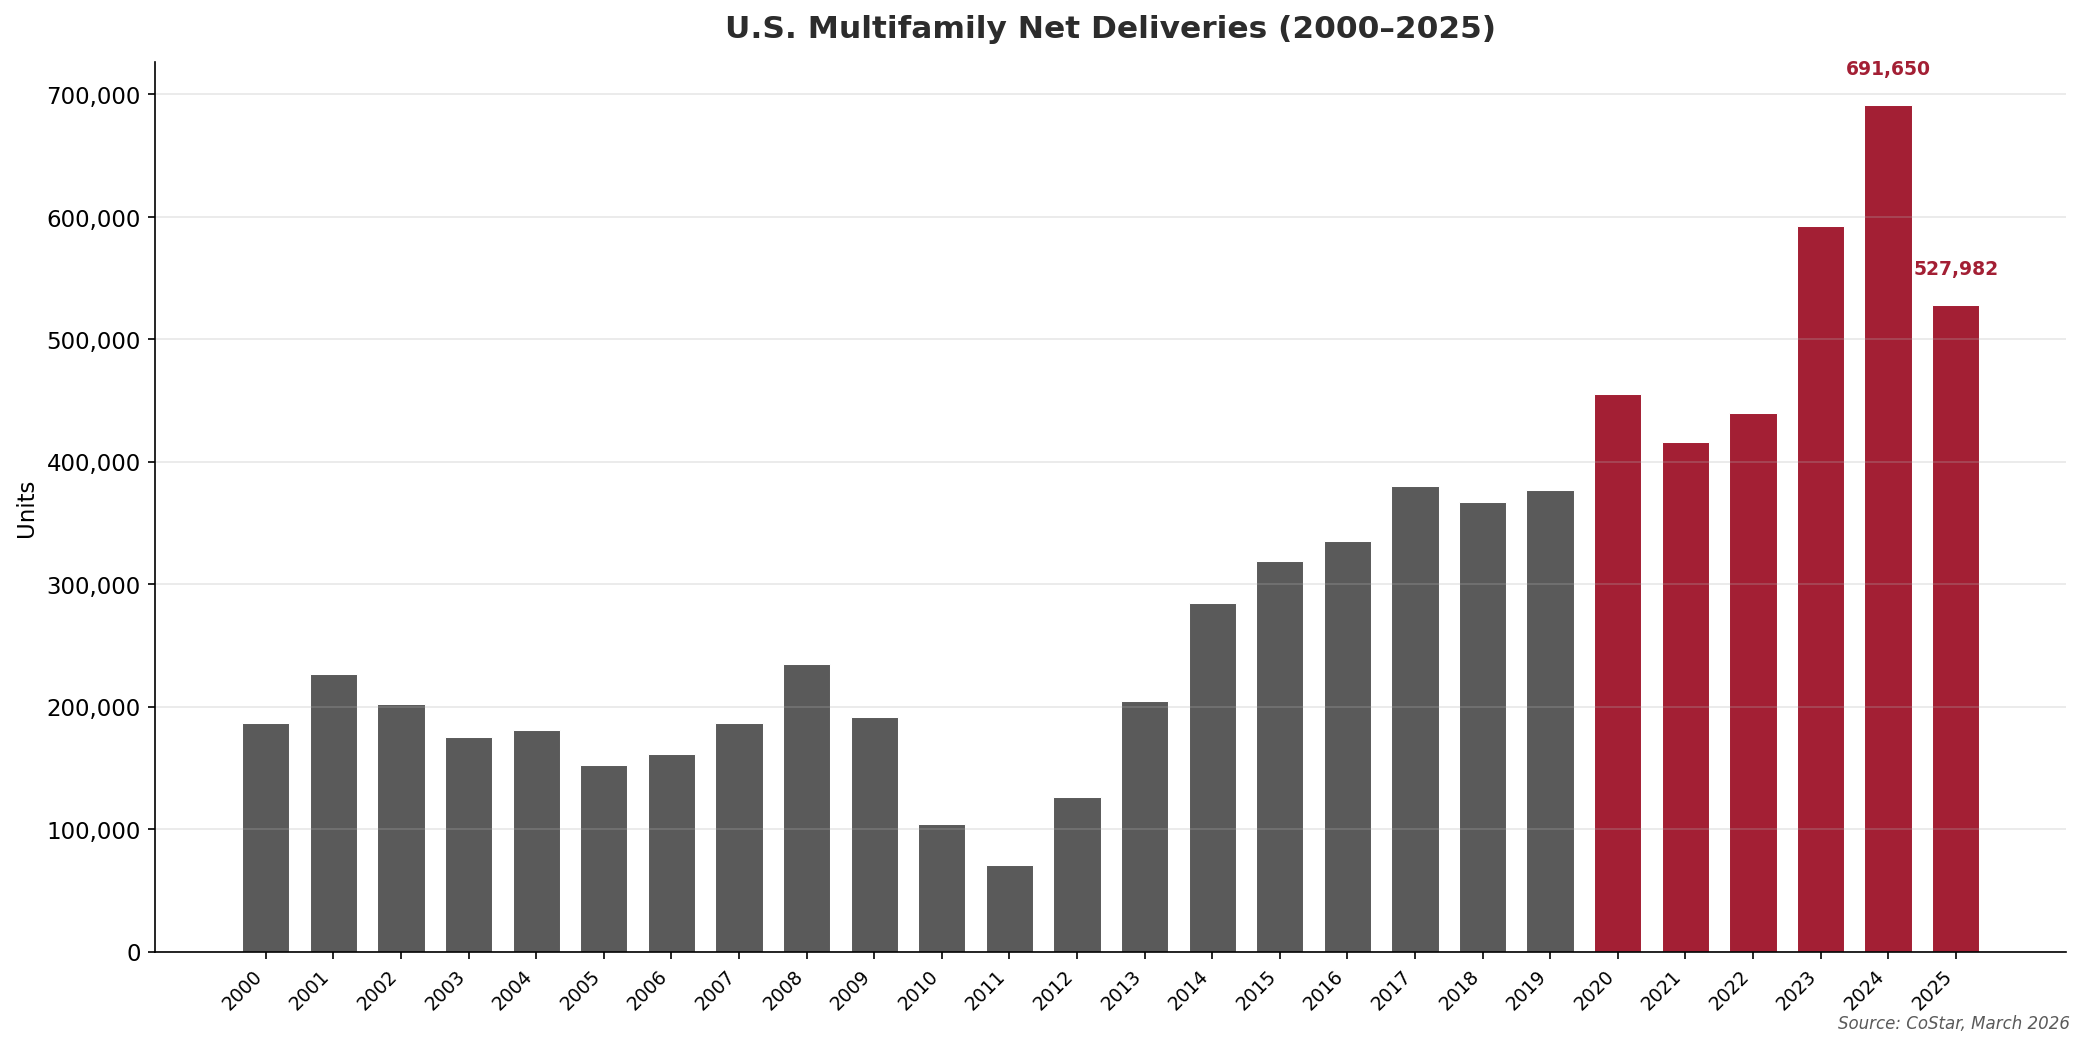
U.S. Multifamily Net Deliveries (2000–2025)
Source: CoStar, March 2026
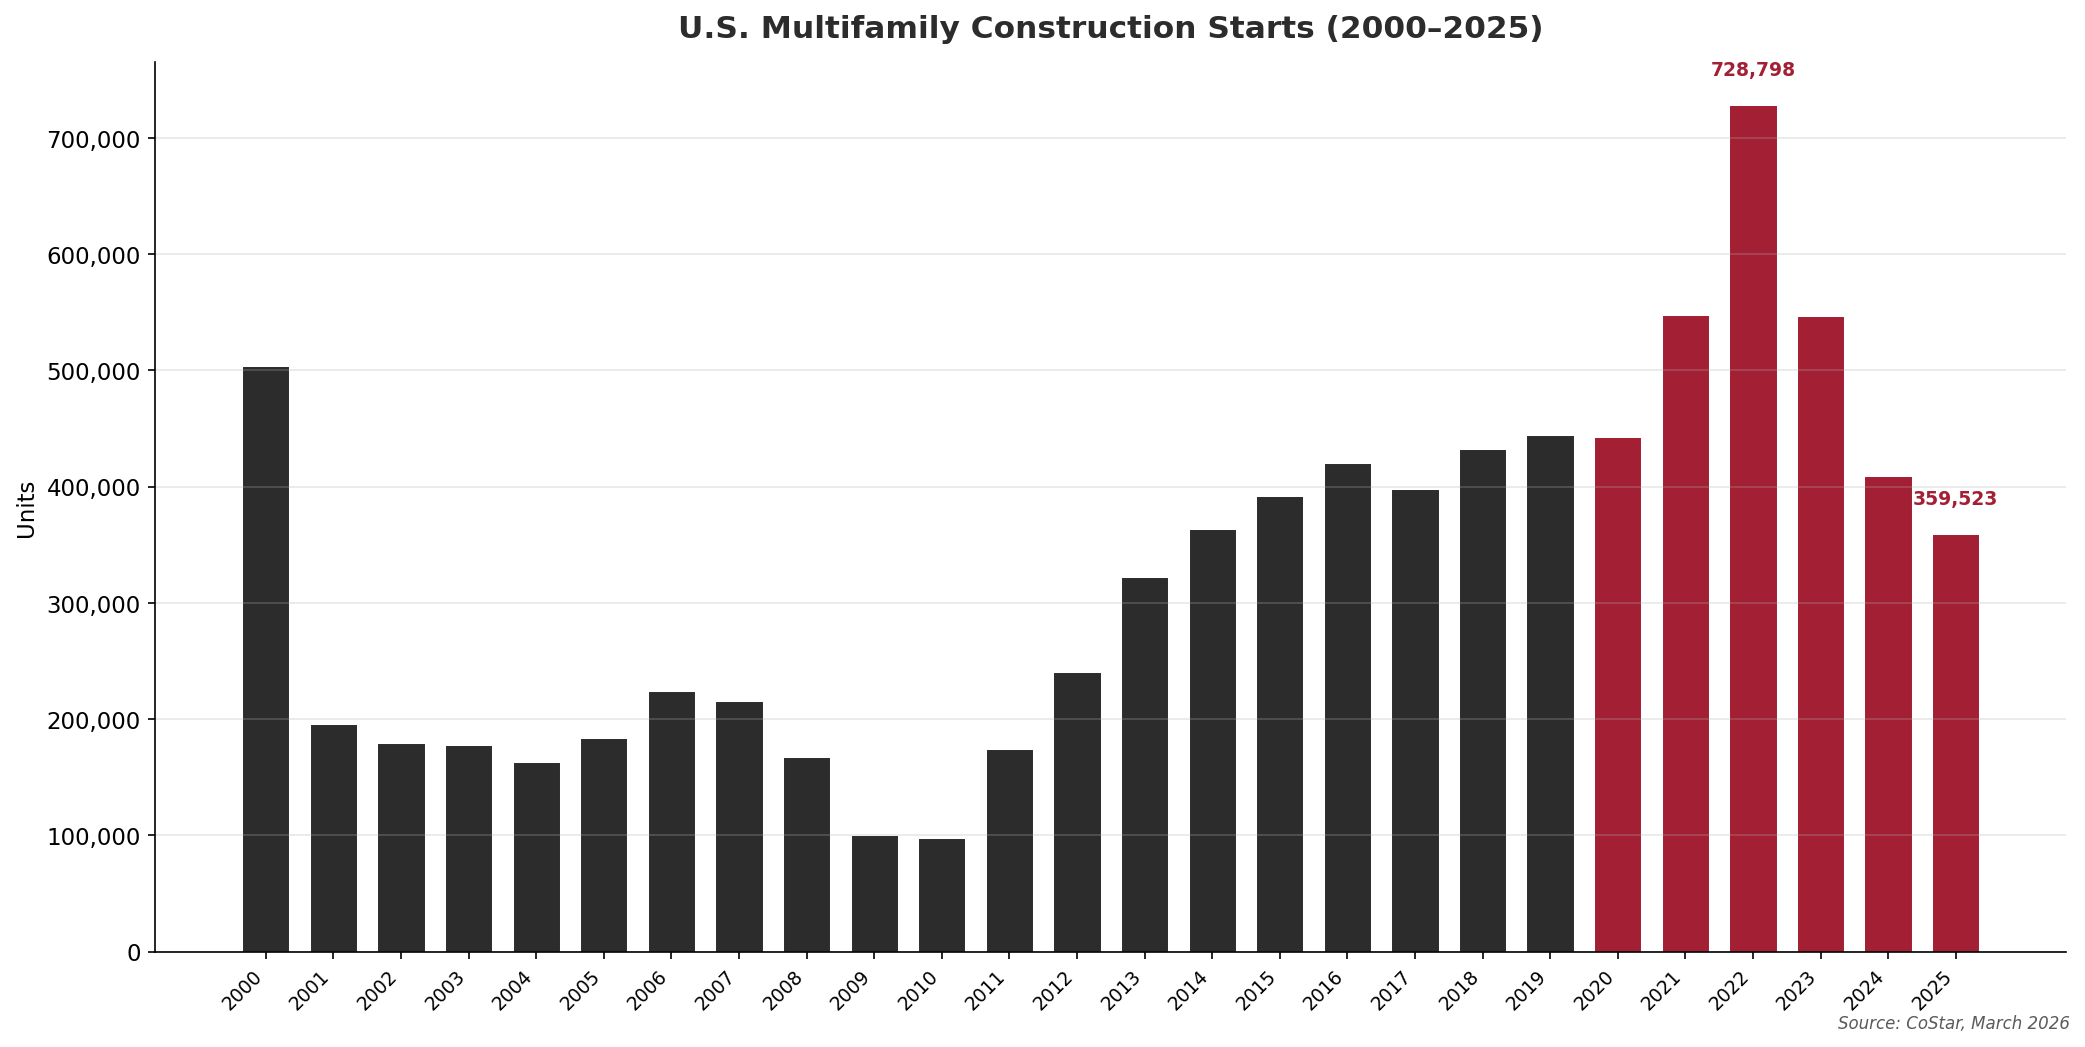
U.S. Multifamily Construction Starts (2000–2025)
Source: CoStar, March 2026
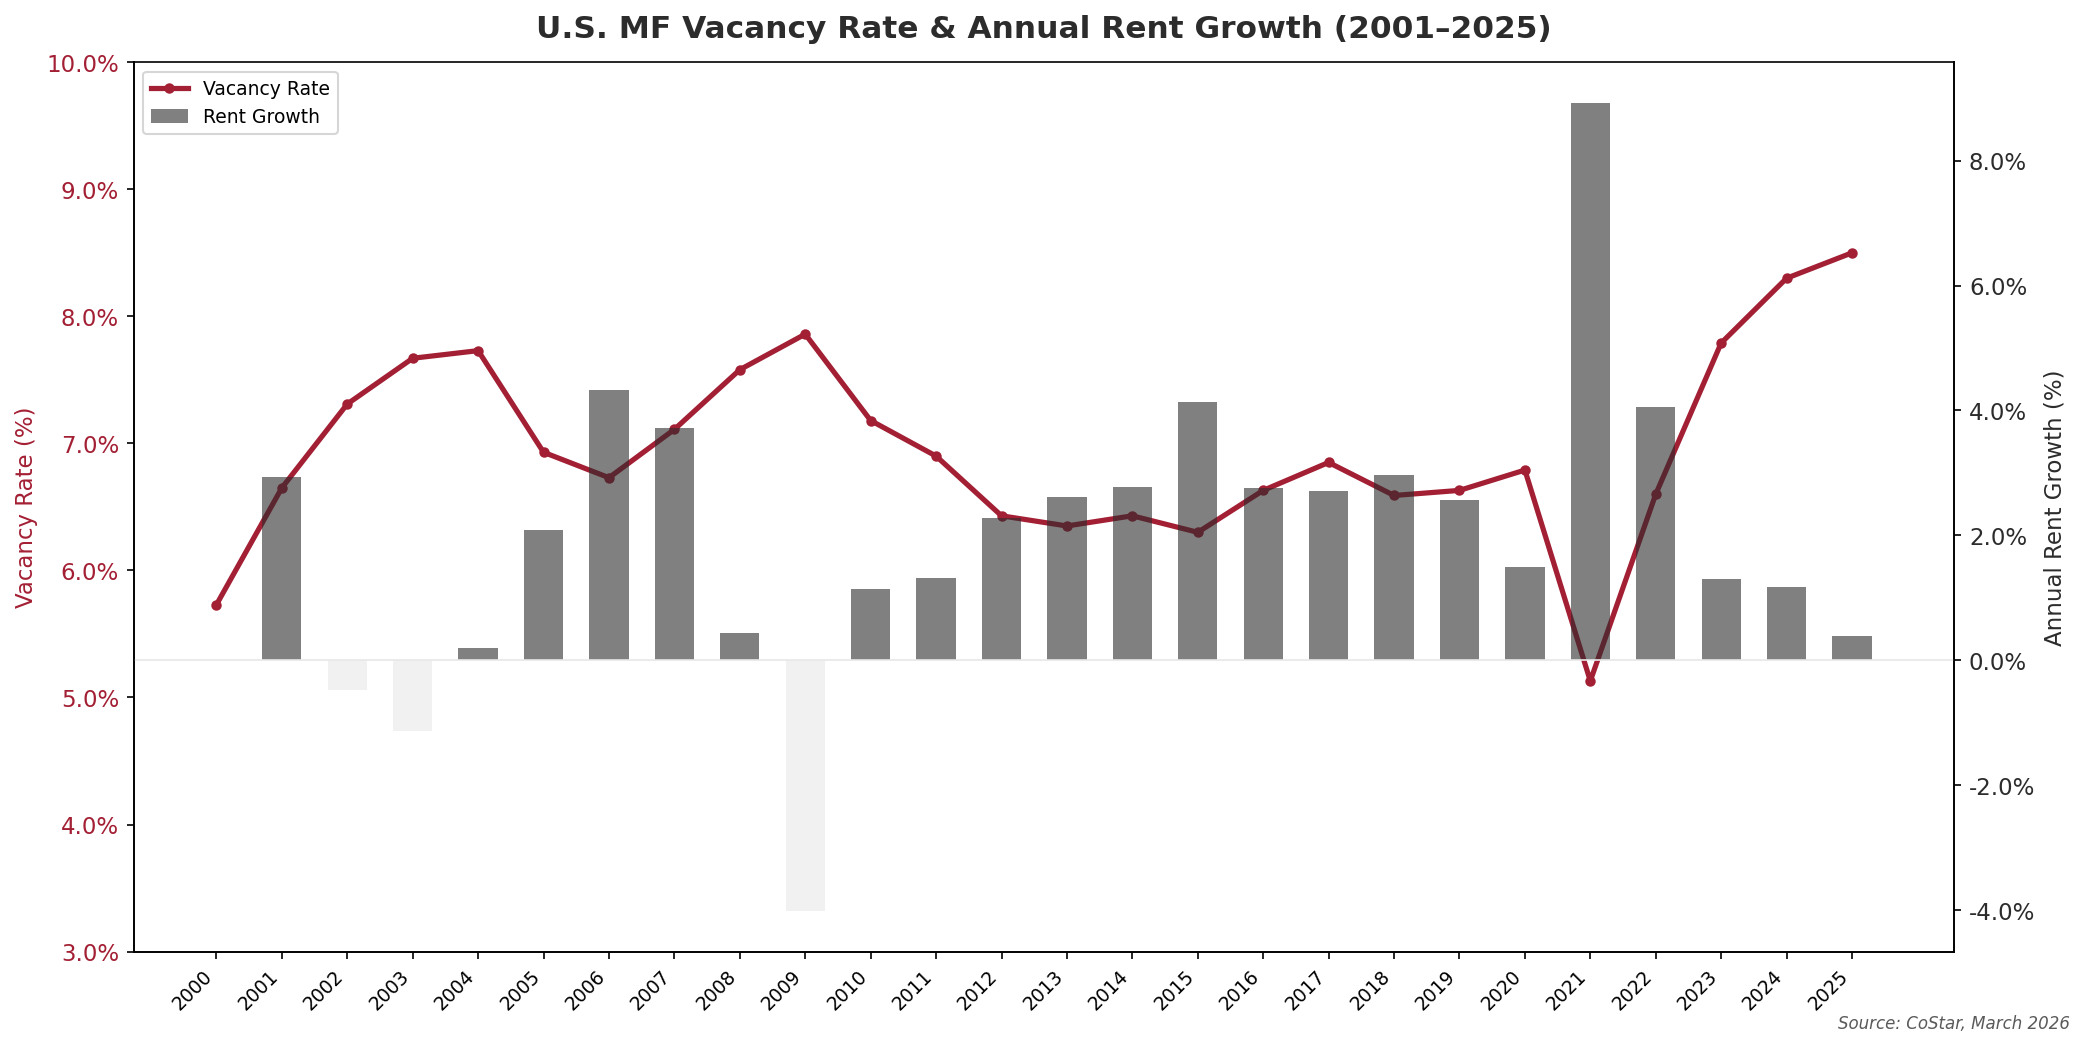
U.S. MF Vacancy Rate & Annual Rent Growth (2001–2025)
Source: CoStar, March 2026
U.S. MF Deliveries vs. Construction Starts (Prior 2-Year Average)
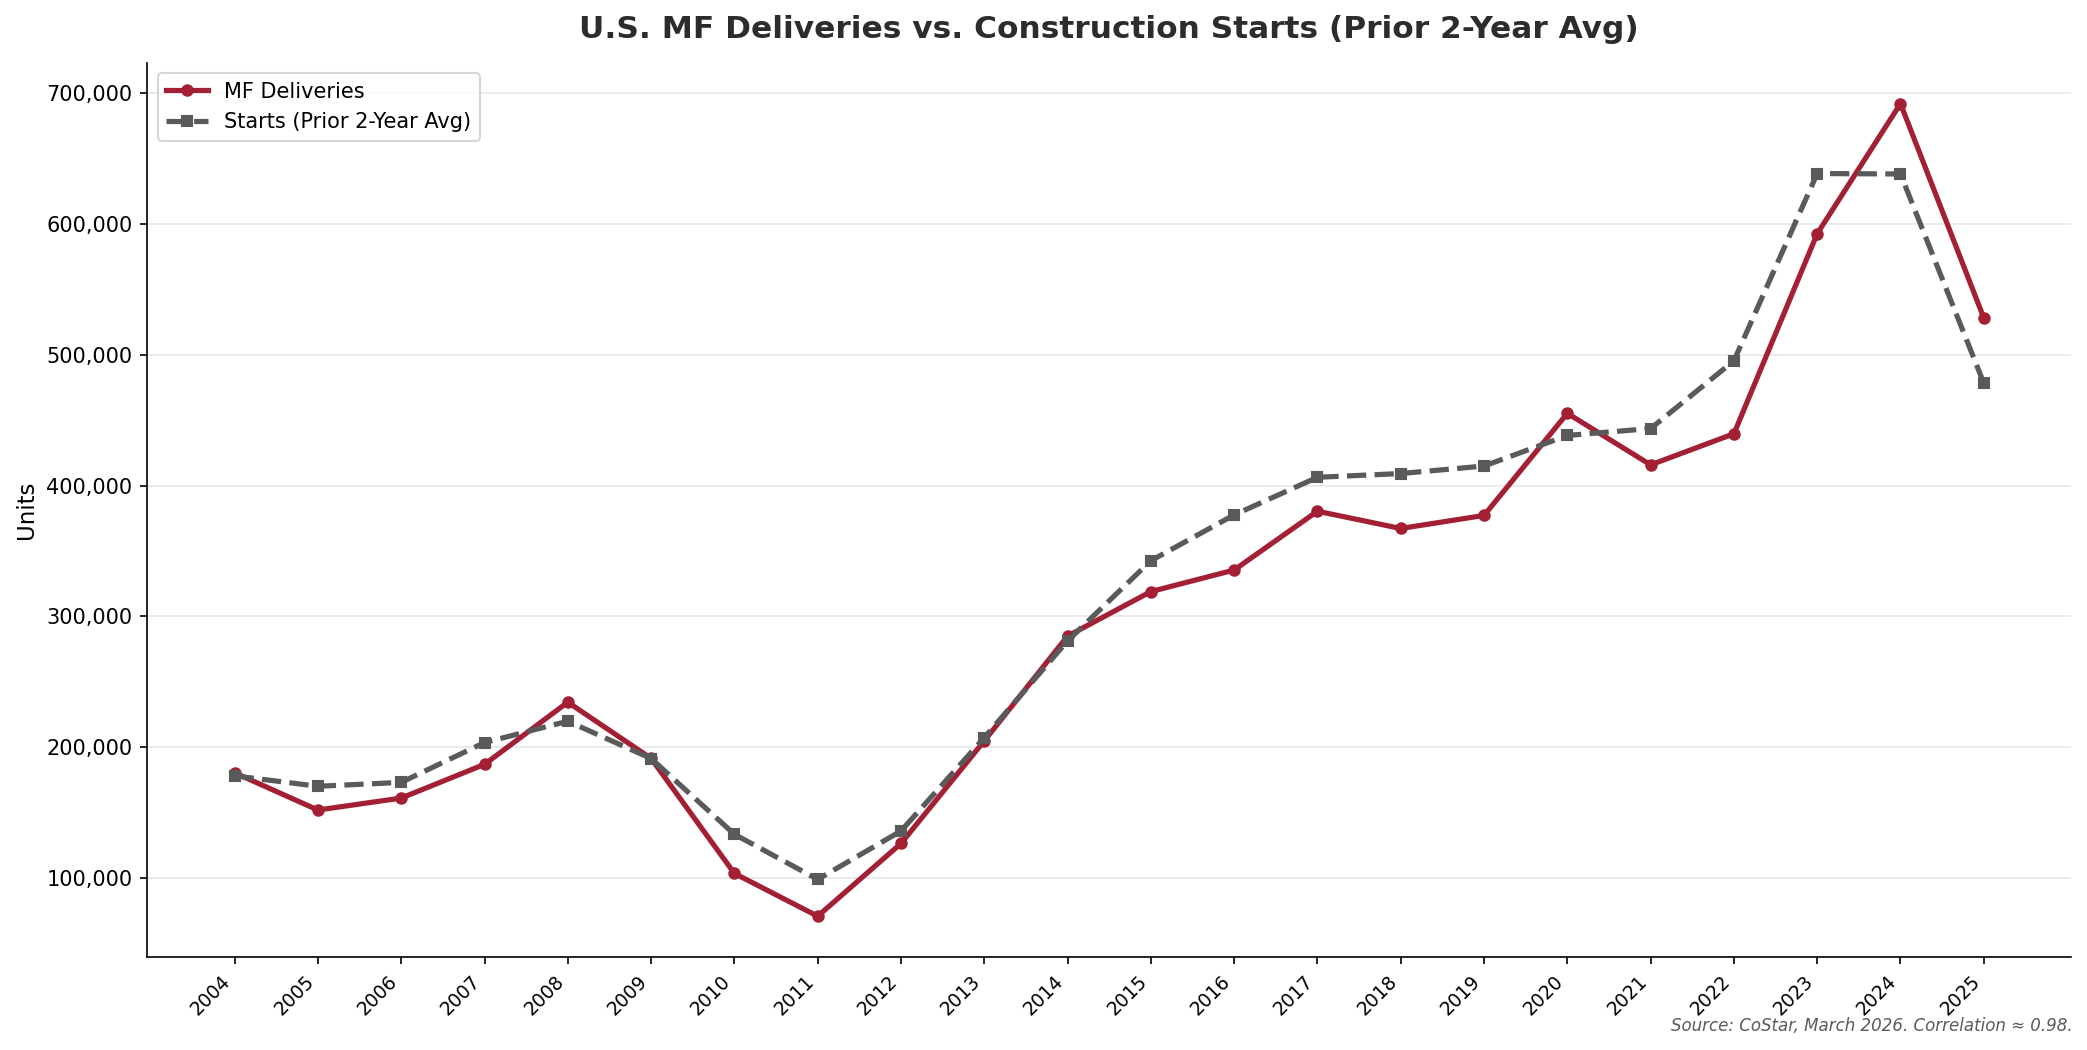
Source: CoStar, March 2026. Correlation between annual deliveries and prior 2-year average starts ≈ 0.98.
Document Links
multifamily-national-supply-cycle.xlsx — National multifamily historical data (2000–2025) with native charts. CoStar, March 2026.
Key Observations
Context & Discussion
The Post-Pandemic MF Supply Boom
The 2020–2024 apartment construction boom was the largest sustained period of multifamily supply growth in at least 25 years. From 2020 through 2024, U.S. builders delivered approximately 2.5 million net new apartment units, compared to roughly 1.6 million during the preceding five-year period (2015–2019).[1] The boom was fueled by a convergence of factors: pandemic-era fiscal stimulus and historically low interest rates made construction financing widely available; rapid domestic migration (especially of young adults in their prime rental years) to Sun Belt metros created a surge in rental demand; and rising home prices pushed would-be buyers into the rental market. The post-pandemic U.S. MF supply boom was dominated by southern growth MSAs; see U.S. Multifamily Regional Divergence for details.
MF Construction Slow Down
The combination of high construction costs, elevated borrowing rates, soft rents (mainly due to supply shock), and wider cap rates has made new ground-up multifamily development unprofitable in a majority of U.S. markets. Multifamily construction starts peaked at 729,000 units in 2022 and have since fallen to 360,000 in 2025—a 51% decline.[1] The standard construction period for a multifamily building is approximately two years, meaning today’s depressed starts will flow through to completions in 2027–2028. CoStar’s forward estimates project deliveries falling to approximately 361,000 units in 2026 and 256,000 in 2027, which would be below the 2015–2019 annual average of approximately 356,000 units.[1] The near-perfect correlation (r ≈ 0.98) between annual deliveries and the prior two-year average of construction starts provides a high degree of confidence in these projections.
Absorption Strength vs. Supply Headwinds
Net absorption has been historically strong—536,000 units in 2024 and 443,000 in 2025—but has not been sufficient to offset peak-cycle deliveries. The result has been steadily rising vacancy, from 5.1% at the 2021 trough to 8.6% as of early 2026.[1] Rent growth has followed the expected pattern, decelerating from 8.9% in 2021 to approximately flat in early 2026. The vacancy-rent growth relationship has been remarkably consistent over the full 25-year data series: periods of rising vacancy compress rents, which in turn discourage new starts, eventually constraining supply and allowing vacancy to tighten. The current cycle appears to be approaching the inflection point where falling supply begins to catch up with (and eventually fall below) absorption, setting the stage for vacancy compression in 2027–2028.
What to Watch in 2026
Supply absorption continues in oversupplied growth markets but opinions range with respect to when oversupplied high-growth markets will achieve stabilization (“stabilization” is a subjective measure but generally 90–92% occupancy). Domestic migration to warmer and more affordable MSAs continues as boomers retire and young adults seek reasonable living costs, driven by the large millennial and boomer generations. This dynamic may recede going forward as overall U.S. population growth has recently slowed due to reduced immigration and delayed family formation. We will continue to track net migration, interest rates, family formation metrics, MF construction starts, SF permits, and cost of living disparities (mainly home prices) between mature and growth metros to identify trends as the southern oversupply absorption story unfolds.
Sources to Track U.S. Multifamily Supply in 2026:
| Source | Next Release | Date | Notes |
|---|---|---|---|
| U.S. Census Bureau | New Residential Construction (Feb 2026) | TBD (delayed) | Monthly starts and completions by structure type and region |
| CoStar | Quarterly national and MSA-level update | Ongoing (subscription) | Most granular source for deliveries, starts, absorption, and vacancy by submarket |
| FRED (Census/HVS) | Q1 2026 Total Housing Units | Expected April 28, 2026 | Quarterly total U.S. housing inventory (SF + MF); currently shows 148.7M units as of Q4 2025 |
Notes
[1] CoStar. U.S. Multifamily National Historical Data (March 18, 2026). costar.com. Includes annual data for net delivered units, construction starts, net absorption, vacancy rate, asking rent, and rent growth for the U.S. multifamily market, 2000–2025, with forecasts through 2031. ↩
[2] U.S. Census Bureau. Housing Inventory Estimate: Total Housing Units in the United States (ETOTALUSQ176N). Q4 2025: 148,712 thousand units. fred.stlouisfed.org ↩
[3] U.S. Census Bureau and U.S. Department of Housing and Urban Development. New Residential Construction (January 2026 release, March 12, 2026). census.gov/construction/nrc ↩
Methodology & Data Notes
Data Source & Period
All national multifamily data sourced from CoStar’s U.S. Multifamily National Historical dataset, downloaded March 18, 2026. The dataset covers annual observations from 2000 through 2025, with CoStar forward estimates through 2031. “Net Delivered Units” subtracts demolished units from gross deliveries. “Construction Starts” represents the number of units where ground was broken in each calendar year. “Net Absorption” represents the change in occupied units over the period.
Starts-to-Deliveries Correlation
The correlation of approximately 0.98 is calculated between annual net delivered units and the simple average of construction starts from the two preceding calendar years (e.g., 2025 deliveries correlated with the average of 2023 and 2024 starts). The two-year lag reflects the typical construction timeline for multifamily projects. This methodology is consistent with the approach used in the MIT Center for Real Estate Fall 2025 multifamily case study.
Vacancy & Rent Growth
Vacancy rate represents the percentage of total inventory units that are vacant at period end. Annual rent growth represents year-over-year change in market asking rent per unit. Both metrics are reported at the national level and reflect the full CoStar-tracked multifamily universe (approximately 20.7 million units as of 2025).