U.S. Multifamily Regional Divergence: South vs. Supply-Constrained Markets
▸ THIS SECTION INCLUDES PROPRIETARY DATA AND IS NOT AVAILABLE FOR PUBLIC USE
Overview
Among U.S. multifamily markets with 50,000+ units, the South accounted for 49% (184,500 of 378,000) of total U.S. units delivered in the trailing twelve months through March 2026.[1] The U.S. South’s inventory-weighted average vacancy now stands at 11.3%, compared to 4.7% in the Northeast, 7.5% in the West, and 7.8% in the Midwest. Twenty of 30 major Southern markets are currently experiencing negative year-over-year rent growth.[1]
At the tightest end of the spectrum, New York (3.1% vacancy), San Jose (4.1%), San Francisco (4.3%), and Providence (4.5%) reflect chronic supply constraints, regulatory barriers to new construction, and persistent demand from high-income employment centers.[1] These markets are posting 2–6% rent growth while fast growing Sun Belt markets like Sarasota (17.5% vacancy, –6.7% rent growth), San Antonio (15.8%, –3.3%), and Austin (13.6%, –4.7%) continue to absorb (at varying pace) new excess unit supply.[1]
MF Deliveries by Census Region — Trailing 12 Months (March 2026)
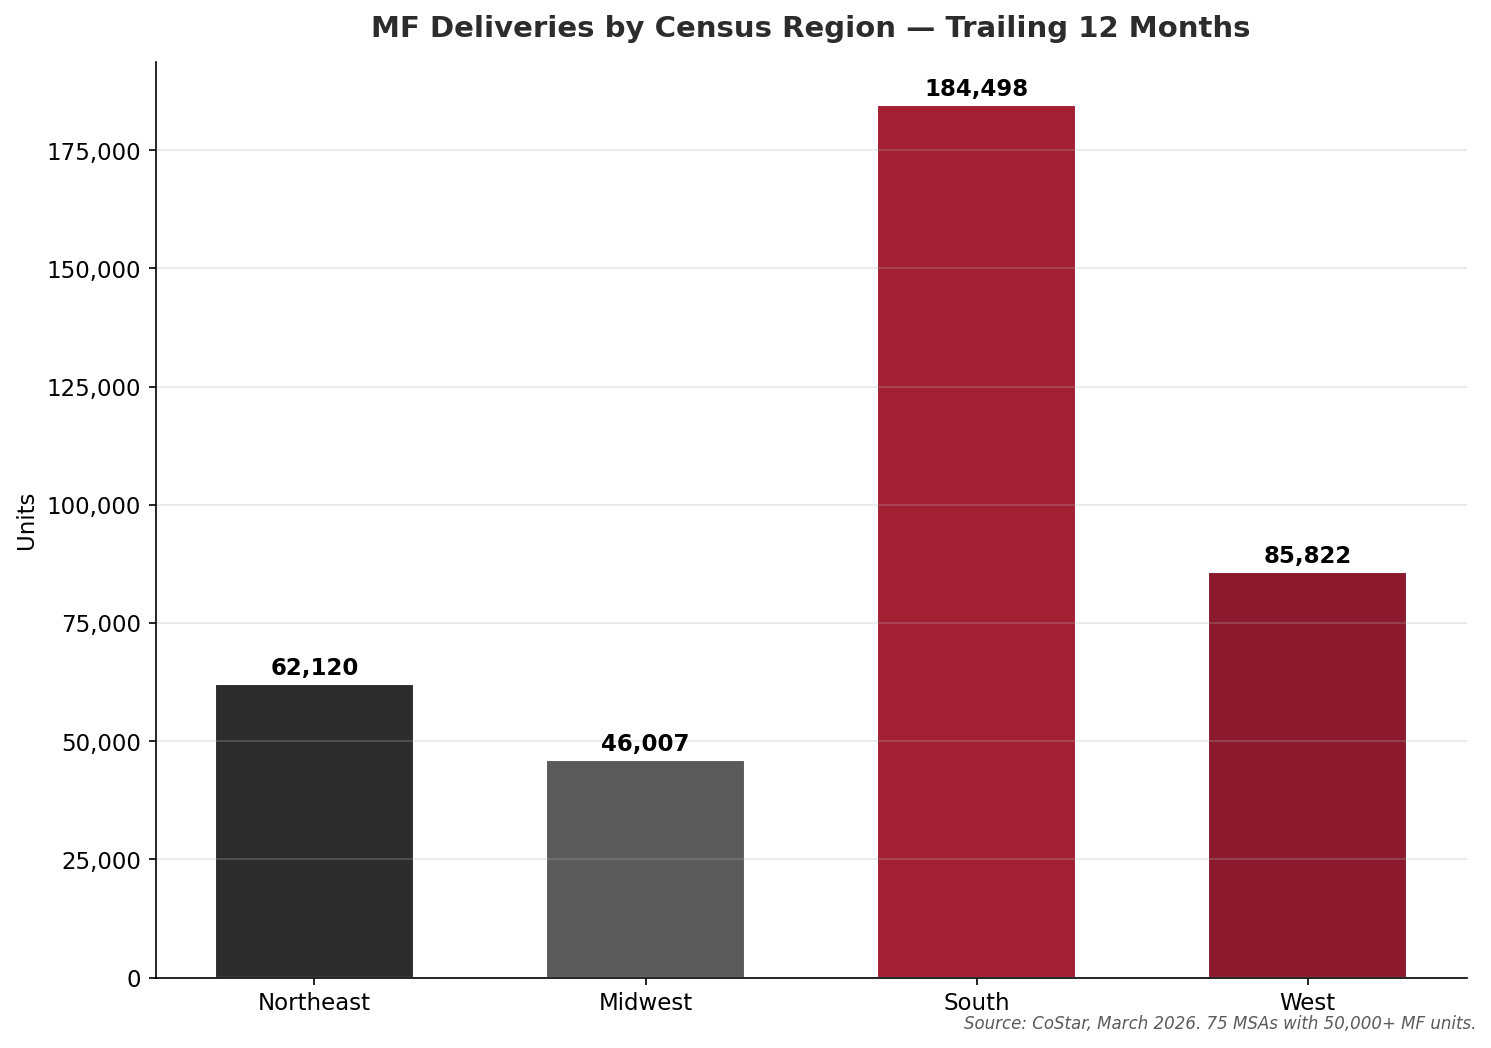
Source: CoStar, March 2026. 75 MSAs with 50,000+ multifamily units, grouped by Census region.
MF Vacancy Rate by Census Region — Inventory-Weighted (March 2026)
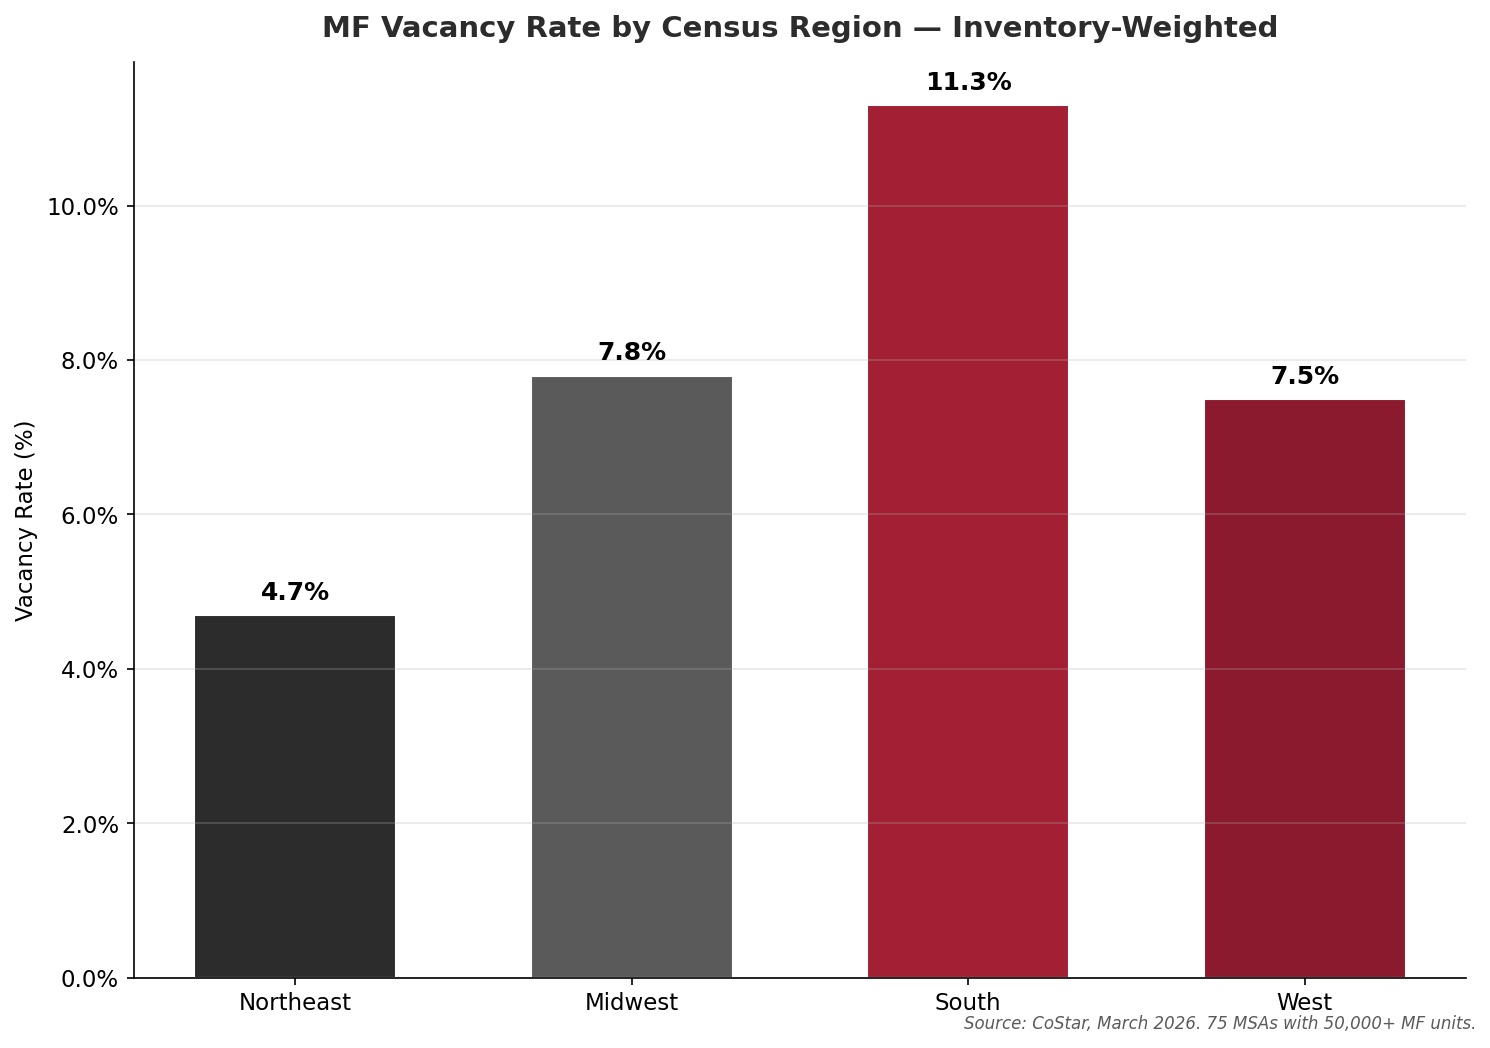
Source: CoStar, March 2026. Weighted by inventory units across 75 MSAs with 50,000+ multifamily units.
Markets with Negative Rent Growth by Census Region (March 2026)
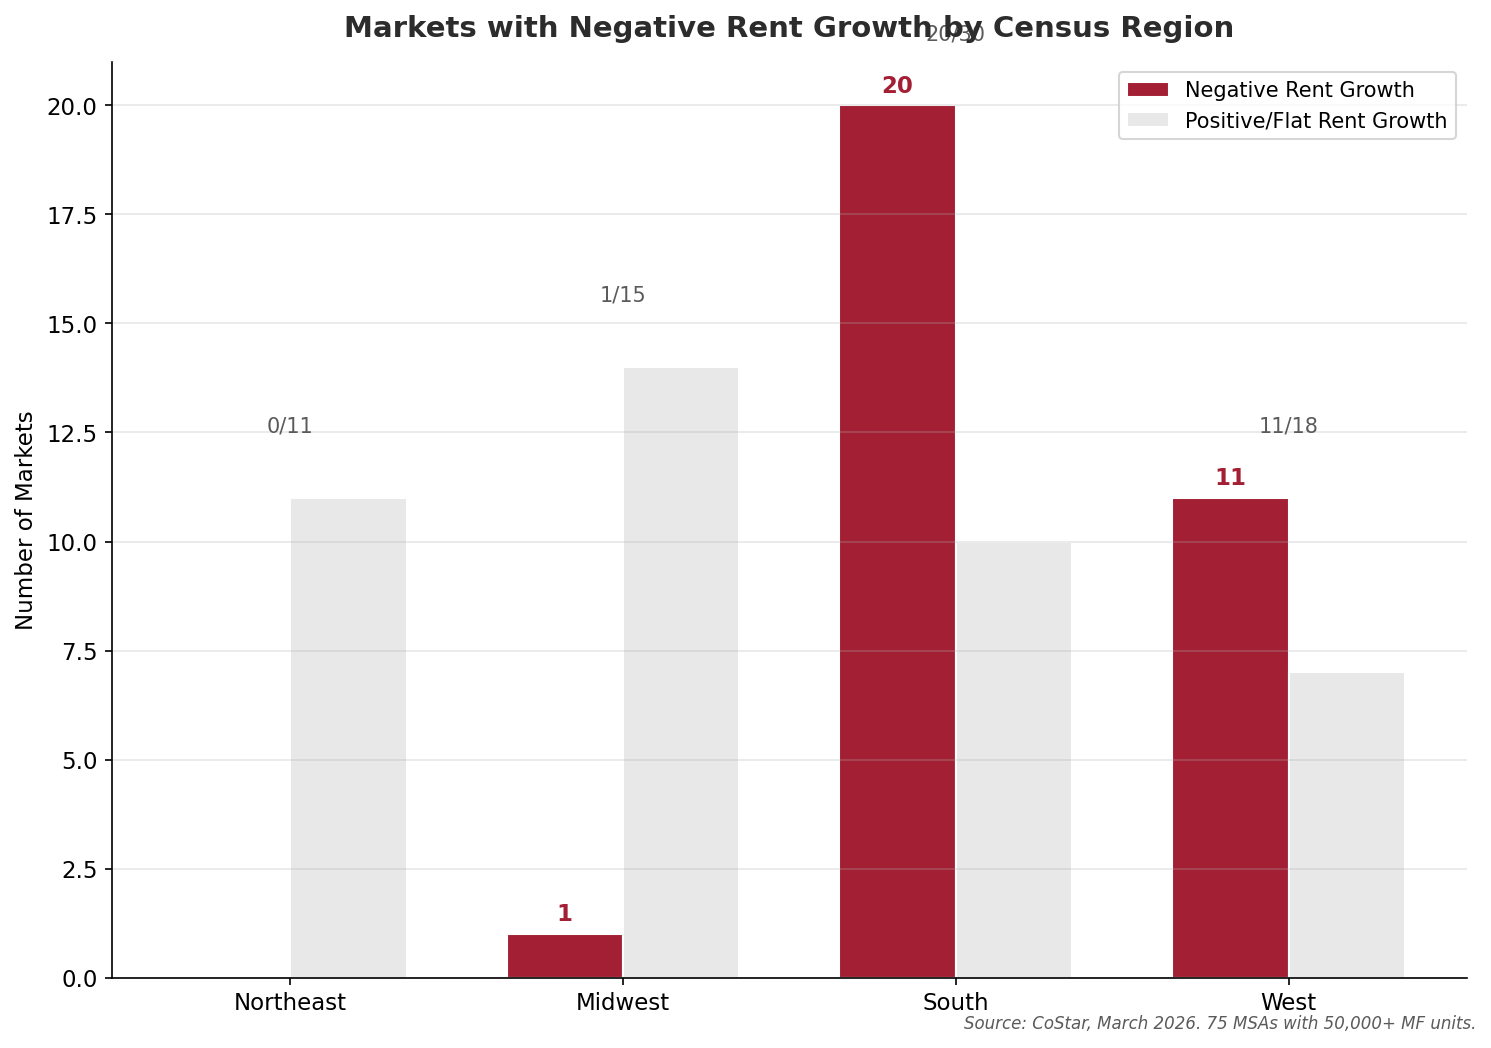
Source: CoStar, March 2026. 75 MSAs with 50,000+ multifamily units.
Document Links
multifamily-regional-divergence.xlsx — Regional summary and 75-market detail with vacancy, rents, deliveries, and cap rates. CoStar, March 2026.
Key Observations
Context & Discussion
Growth Metro Supply Wave
Rapid post-pandemic domestic migration to Sun Belt metros triggered a developer response of historic proportions. Rents in markets like Austin, Nashville, Charlotte, and DFW surged 10–15% in 2021 alone as hundreds of thousands of new residents arrived from expensive coastal cities.[1] Low regulatory barriers, abundant land, and widely available low-rate construction financing enabled developers to break ground at an extraordinary pace. Texas, Florida, and the Carolinas led the way, with Dallas–Fort Worth alone delivering 33,600 multifamily units in the trailing twelve months through March 2026.[1]
Why the Northeast Did Not
Boston, New York, and other Northeastern metros face structural barriers to new construction that have no near-term resolution. Land is constrained and expensive. Building codes designed to reduce energy use and carbon emissions add to construction costs beyond those imposed by the cold climate itself. Transaction costs are elevated by permitting fees, utility connection charges, and mandatory affordable housing set-asides. Community resistance to new density—particularly in established neighborhoods—adds timeline risk and political uncertainty. Because rents and development costs are generally high, affordable unit requirements can create significant operating deficits, forcing developers to build increasingly high-end market-rate product to compensate, which in turn fuels further community opposition.[1] The result: Northeastern markets have maintained vacancy rates below 5% and continue to post positive rent growth even as the rest of the country absorbs a supply glut.
For-Sale Housing Inventory Pricing and Inventory
The regional divergence in multifamily markets is mirrored in for-sale housing inventory. Following the rapid interest rate increases of 2022, the “lock-in effect”—where homeowners with low pandemic-era mortgage rates (often near 3%) are unable or unwilling to sell and take on a new mortgage at 6%+—has kept existing home inventory suppressed in the Northeast and Midwest while Sun Belt and Mountain West markets have seen inventory return to or exceed pre-pandemic levels.[2] As of February 2026, nine states had active for-sale inventory above pre-pandemic 2019 levels, while nationally, inventory remained approximately 17% below February 2019.[2] Many of the same Sun Belt MSAs experiencing high multifamily vacancy are also seeing elevated for-sale inventory (despite the lock-in effect), creating a dual overhang that is compressing both rents and home prices in these markets.
What to Watch in 2026
The regional divergence story will be shaped by several factors: absorption velocity in oversupplied Southern markets (particularly Texas and Florida), the pace of starts recovery by region, the trajectory of for-sale housing inventory, and potential policy changes including zoning reform at the local level or federal housing incentives. Chronically under-supplied states and municipalities have seen a resurgent “YIMBY” (Yes In My Back Yard) movement in recent years, inspiring hopes for increased future supply, but countervailing political forces (e.g., rent control and SFR ownership and development constriction proposals) will likely mitigate or eliminate potential supply gains in mature MSAs as they have for decades. We will continue to track net migration, interest rates, family formation metrics, MF construction starts, SF permits, and cost of living disparities (mainly home prices) between mature and growth metros to identify trends as the southern oversupply absorption story unfolds.
Sources to Track U.S. Multifamily Regional Dynamics in 2026:
| Source | Next Release | Date | Notes |
|---|---|---|---|
| CoStar | Quarterly MSA-level multifamily update | Ongoing (subscription) | Vacancy, rents, deliveries, starts, and absorption for 395 MSAs |
| ResiClub / Realtor.com | Monthly state-level active inventory | Monthly | Tracks for-sale inventory vs. pre-pandemic 2019 levels by state and metro |
| U.S. Census Bureau | New Residential Construction by Region | TBD (delayed) | Monthly starts and completions by Census region (SF + MF combined) |
Notes
[1] CoStar. U.S. Multifamily Market Data — All Cities, 50K+ Units (March 18, 2026). costar.com. Includes trailing-twelve-month data for 75 MSAs with 50,000+ multifamily inventory units. Regional aggregations by CRE42 using Census region definitions (Northeast, Midwest, South, West). Vacancy rates are inventory-weighted. ↩
[2] ResiClub analysis of Realtor.com data. State Inventory Update: Housing Market (February 2026 and March 2026). resiclubanalytics.com. Active listings comparison vs. pre-pandemic 2019 levels. As of February 2026, national active inventory was –17.0% below February 2019. ↩
Methodology & Data Notes
Data Source & Regional Classification
Market-level data sourced from CoStar’s U.S. Multifamily dataset, “50K+ Units” tab, downloaded March 18, 2026. This tab includes 75 MSAs with multifamily inventory of 50,000+ units, representing approximately 16.3 million of the national total of 20.7 million multifamily units (~79% coverage). Markets were assigned to Census regions (Northeast, Midwest, South, West) by CRE42 based on the primary state of each MSA. Washington, D.C. and Baltimore are classified as South per Census convention.
Weighted Averages
Regional vacancy rates are calculated as inventory-weighted averages: the sum of (vacancy rate × inventory units) for all markets in the region, divided by total regional inventory units. Regional cap rates are calculated as asset-value-weighted averages using the same approach. This methodology ensures that larger markets exert proportionally greater influence on regional averages.
For-Sale Housing Data
For-sale housing inventory data referenced from ResiClub’s monthly analysis of Realtor.com active listings. “Pre-pandemic levels” refers to active listing counts from the corresponding month of 2019. The nine states reported above pre-pandemic levels as of February 2026 are: Arizona, Colorado, Florida, Idaho, Nebraska, Tennessee, Texas, Utah, and Washington.