Stabilized CAGR, Q1 2016 – Q2 2026
| Metric | Whole company | Per stab. share |
|---|---|---|
| NOI | 2.9% | 2.4% |
| EBITDAre | 2.5% | 2.0% |
| FFO[6] | 5.1% | 4.6% |
| AFFO | 2.7% | 2.3% |

Definitions. NOI (Net Operating Income) = property-level revenue less direct property operating expenses, as each company publishes it. EBITDAre = Earnings Before Interest, Taxes, Depreciation and Amortization for Real Estate (Nareit definition). FFO (Funds from Operations) = net income excluding real estate depreciation and gains or losses on property sales (Nareit definition). Core/Normalized FFO = AVB's Core FFO plus EQR's Normalized FFO, each company's own published measure excluding non-comparable items (merger costs included among them). AFFO (Adjusted Funds from Operations, cre42 definition) = Core/Normalized FFO less recurring capital expenditures (each company's own recurring measure, summed). CFO (Cash Flow from Operations) = as-reported net cash provided by operating activities. TEV (Total Enterprise Value) = market capitalization plus total value of debt plus preferred shares and other debt-like obligations. CAGR = Compound Annual Growth Rate.
| Metric | Whole company | Per stab. share |
|---|---|---|
| NOI | 2.9% | 2.4% |
| EBITDAre | 2.5% | 2.0% |
| FFO[6] | 5.1% | 4.6% |
| AFFO | 2.7% | 2.3% |
| TTM | Q3 25 | Q4 25 | Q1 26 | Q2 26 | |
|---|---|---|---|---|---|
| AFFO / STAB MKT CAP | 5.4% | 5.4% | 5.7% | 6.4% | 5.3% |
| FFO / STAB MKT CAP | 6.1% | 6.6% | 6.4% | 6.6% | 6.0% |
| EBITDAre / STAB TEV | 5.5% | 5.8% | 5.6% | 5.7% | 5.5% |
| NOI / STAB TEV | 6.1% | 6.0% | 6.3% | 6.7% | 6.2% |
| 2016 | 2017 | 2018 | 2019 | 2020 | 2021 | 2022 | 2023 | 2024 | 2025 | 2026 ann. | |
|---|---|---|---|---|---|---|---|---|---|---|---|
| NOI | $4.32 | $4.39 | $4.56 | $4.69 | $4.43 | $4.12 | $4.77 | $5.05 | $5.23 | $5.39 | $5.55 |
| EBITDAre | $4.08 | $4.07 | $4.21 | $4.32 | $4.08 | $3.73 | $4.33 | $4.58 | $4.71 | $4.94 | $4.85 |
| FFO | $3.13 | $3.23 | $3.28 | $3.45 | $3.24 | $3.00 | $3.58 | $3.84 | $3.96 | $4.14 | $3.99 |
| AFFO | $2.86 | $2.95 | $3.08 | $3.23 | $3.05 | $2.75 | $3.22 | $3.47 | $3.65 | $3.67 | $3.68 |
| CFO | $3.12 | $3.43 | $3.59 | $3.70 | $3.32 | $3.23 | $3.77 | $4.06 | $4.15 | $4.34 | $3.96 |
| 2016 | 2017 | 2018 | 2019 | 2020 | 2021 | 2022 | 2023 | 2024 | 2025 | 2026 ann. | |
|---|---|---|---|---|---|---|---|---|---|---|---|
| NOI | 1.6% | 3.7% | 3.0% | -5.6% | -6.9% | 15.8% | 5.7% | 3.6% | 3.2% | 2.9% | |
| EBITDAre | -0.4% | 3.6% | 2.4% | -5.5% | -8.4% | 15.9% | 5.9% | 2.8% | 4.8% | -1.7% | |
| FFO | 3.0% | 1.6% | 5.3% | -6.2% | -7.3% | 19.2% | 7.5% | 2.9% | 4.7% | -3.7% | |
| AFFO | 2.9% | 4.5% | 4.8% | -5.4% | -10.0% | 17.4% | 7.6% | 5.1% | 0.6% | 0.3% | |
| CFO | 9.8% | 4.7% | 3.0% | -10.3% | -2.6% | 16.7% | 7.7% | 2.1% | 4.7% | -8.7% |
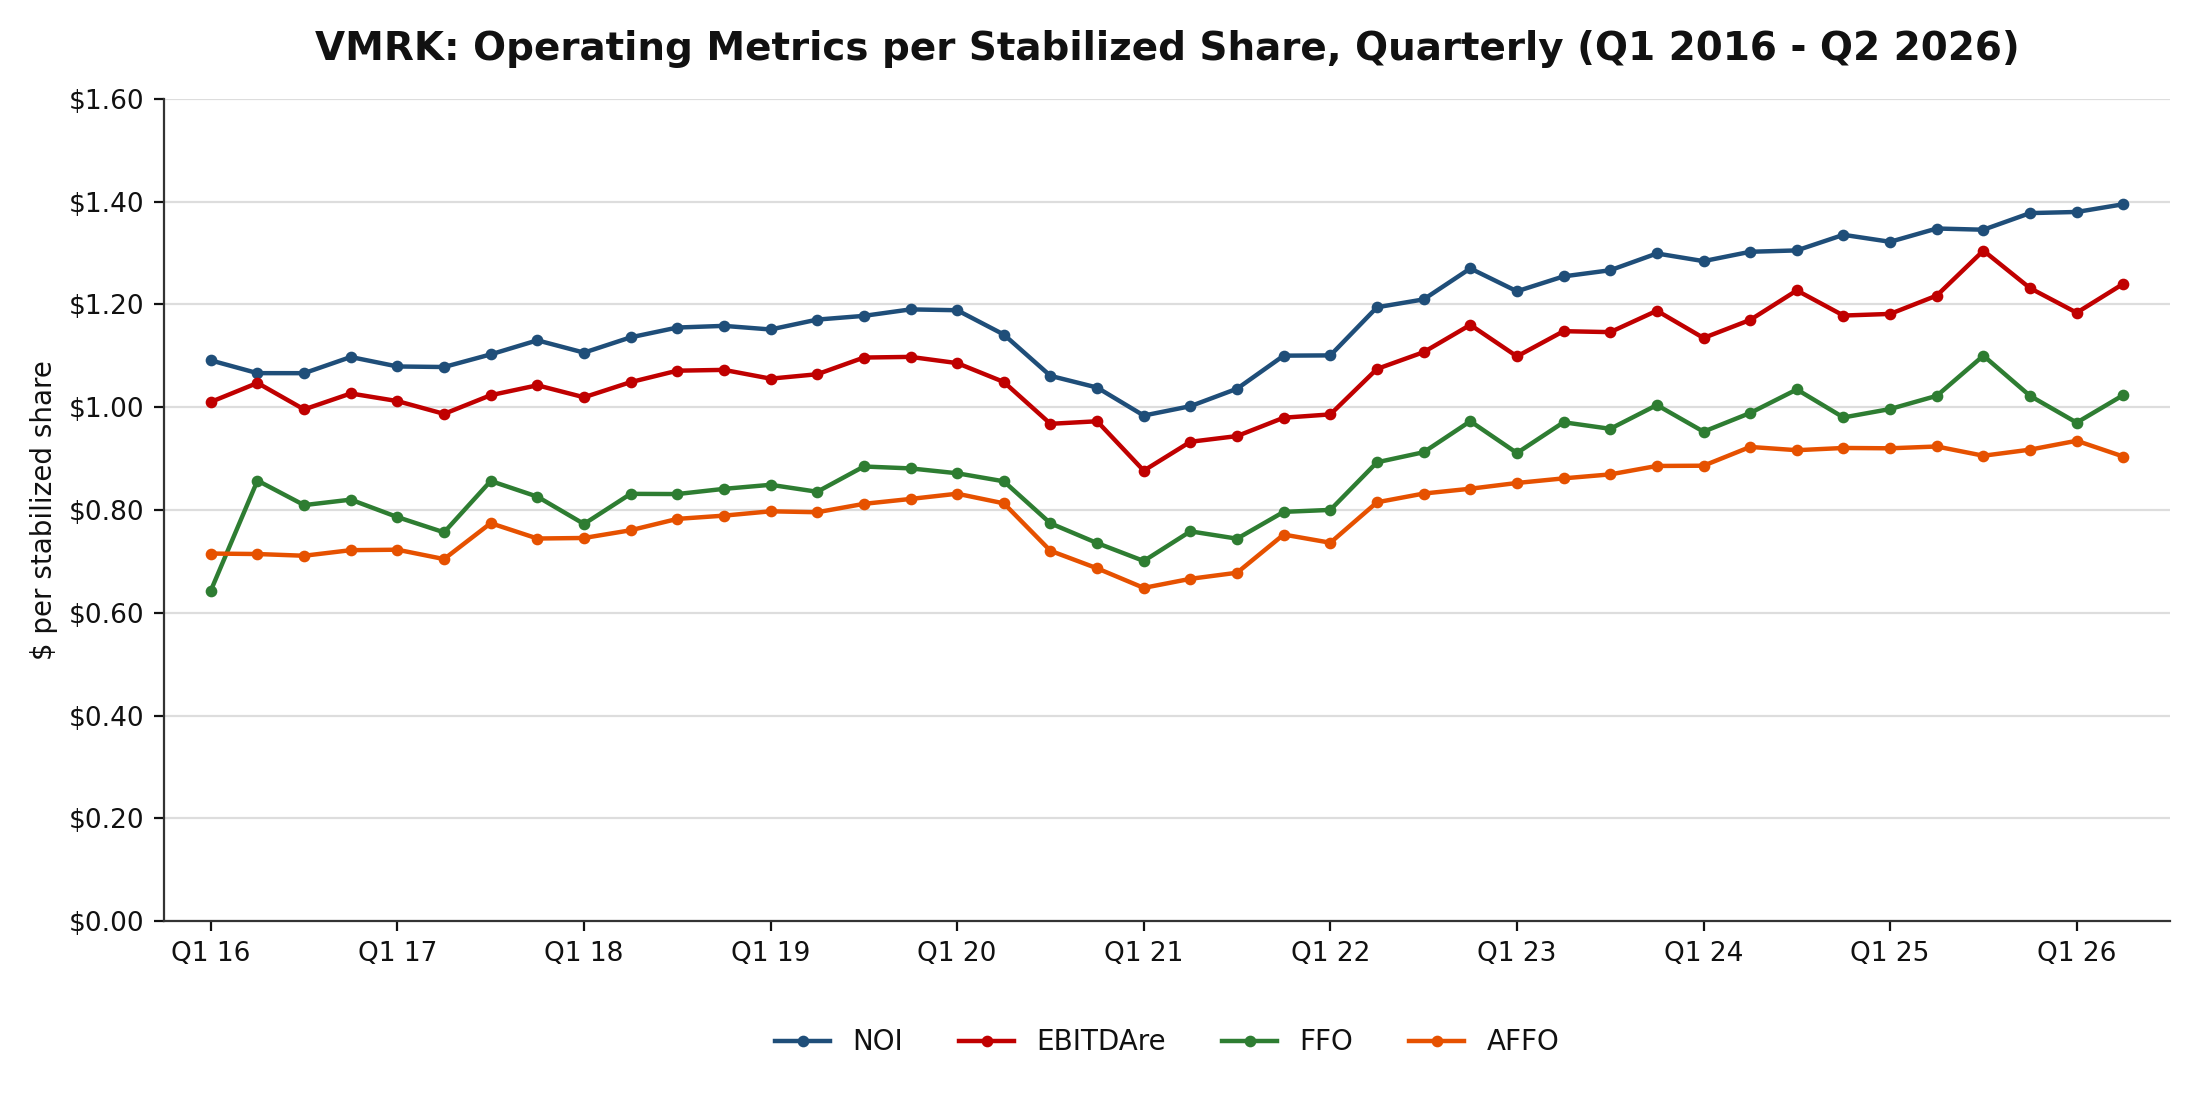
Source: pro forma combination of the AVB and EQR canonical workbooks (companion workbook, AVB Input / EQR Input tabs), Q1 2016–Q2 2026; as-if-converted at 2.793; CRE42 stabilized-share basis. Companion workbook, CHARTS STAB tab.
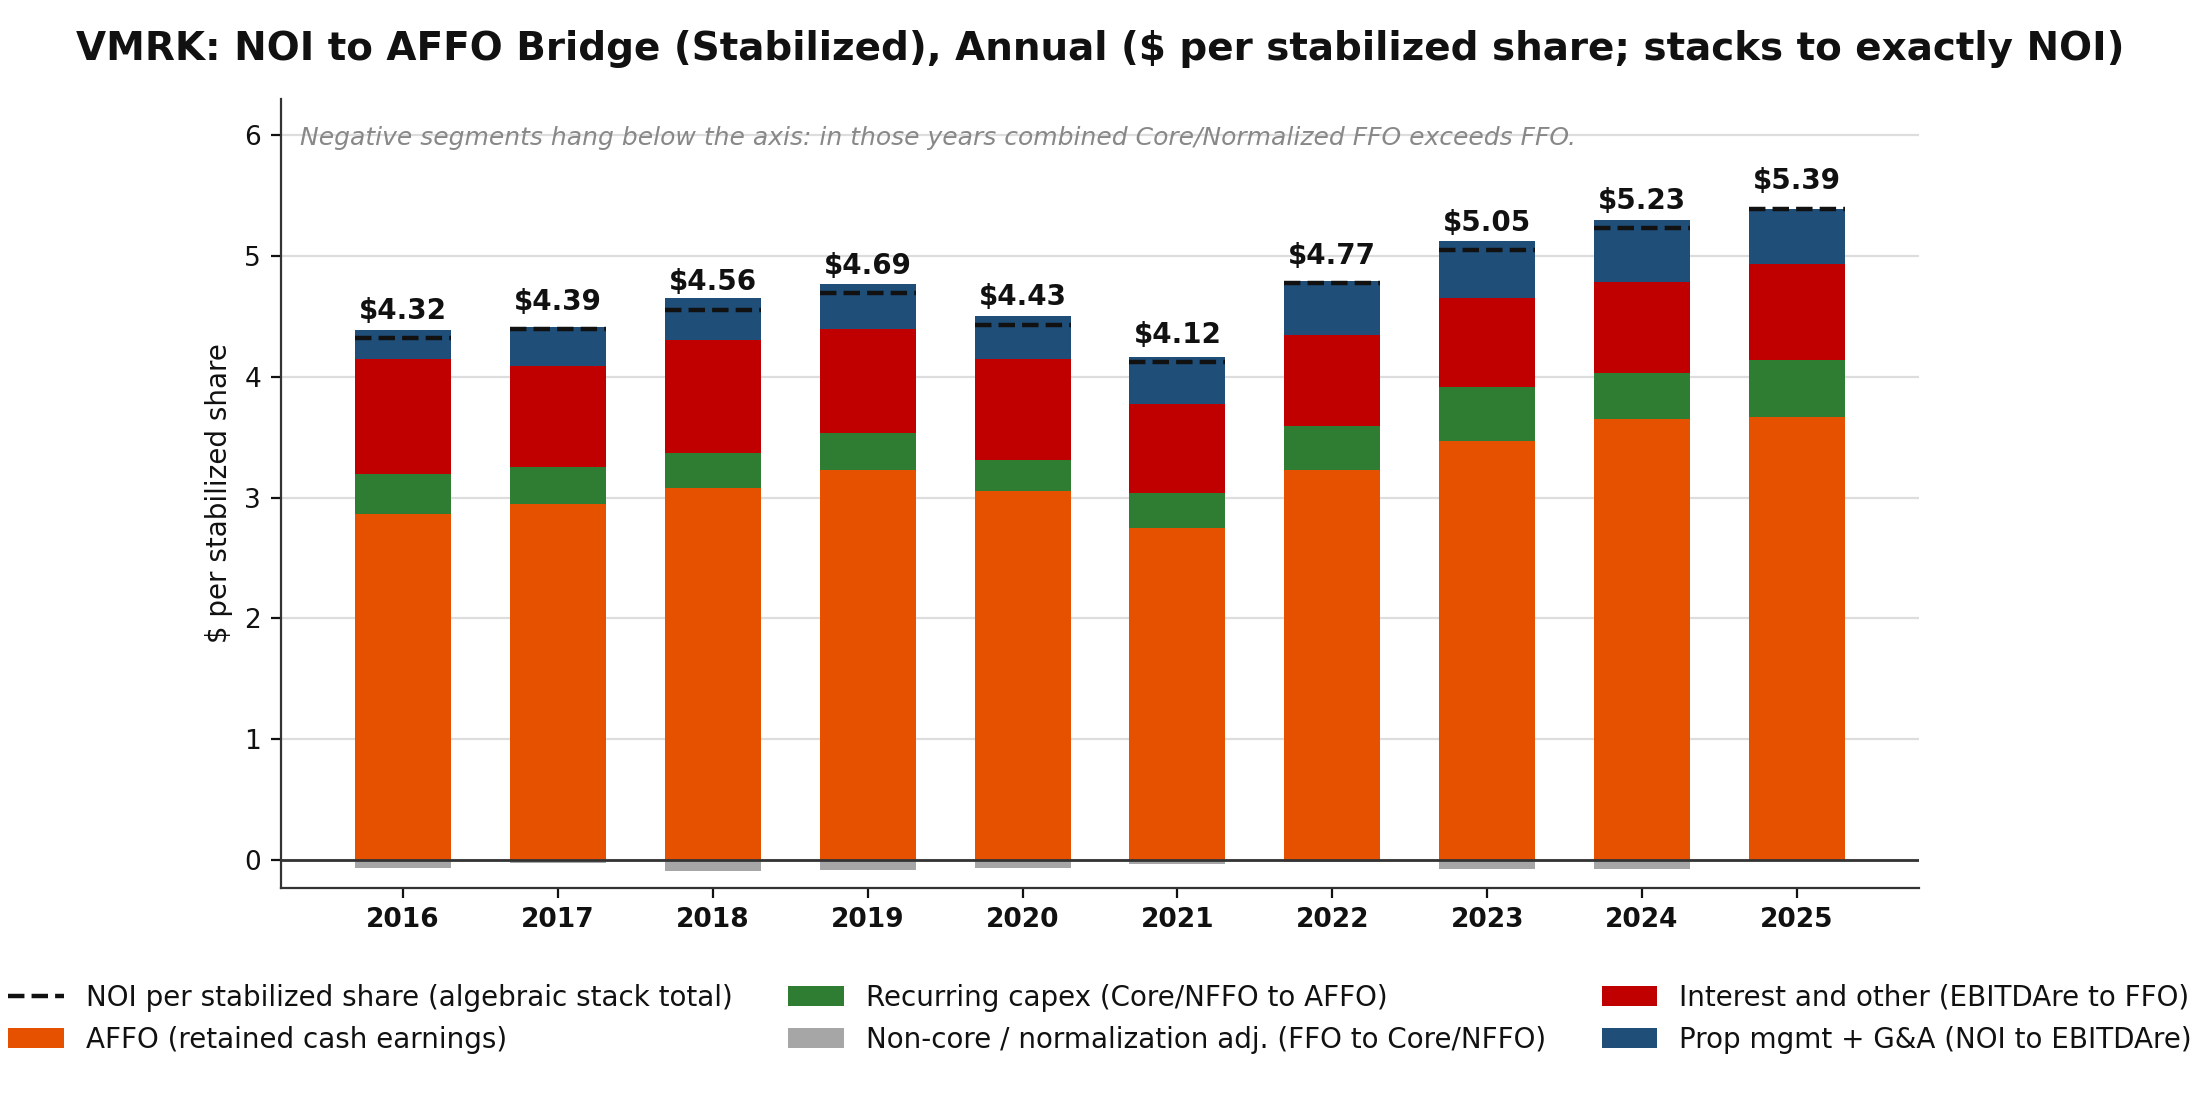
Source: Companion workbook, Quarterly Data annual block; segments are the exact differences between adjacent metrics, per stabilized share, and stack to NOI.
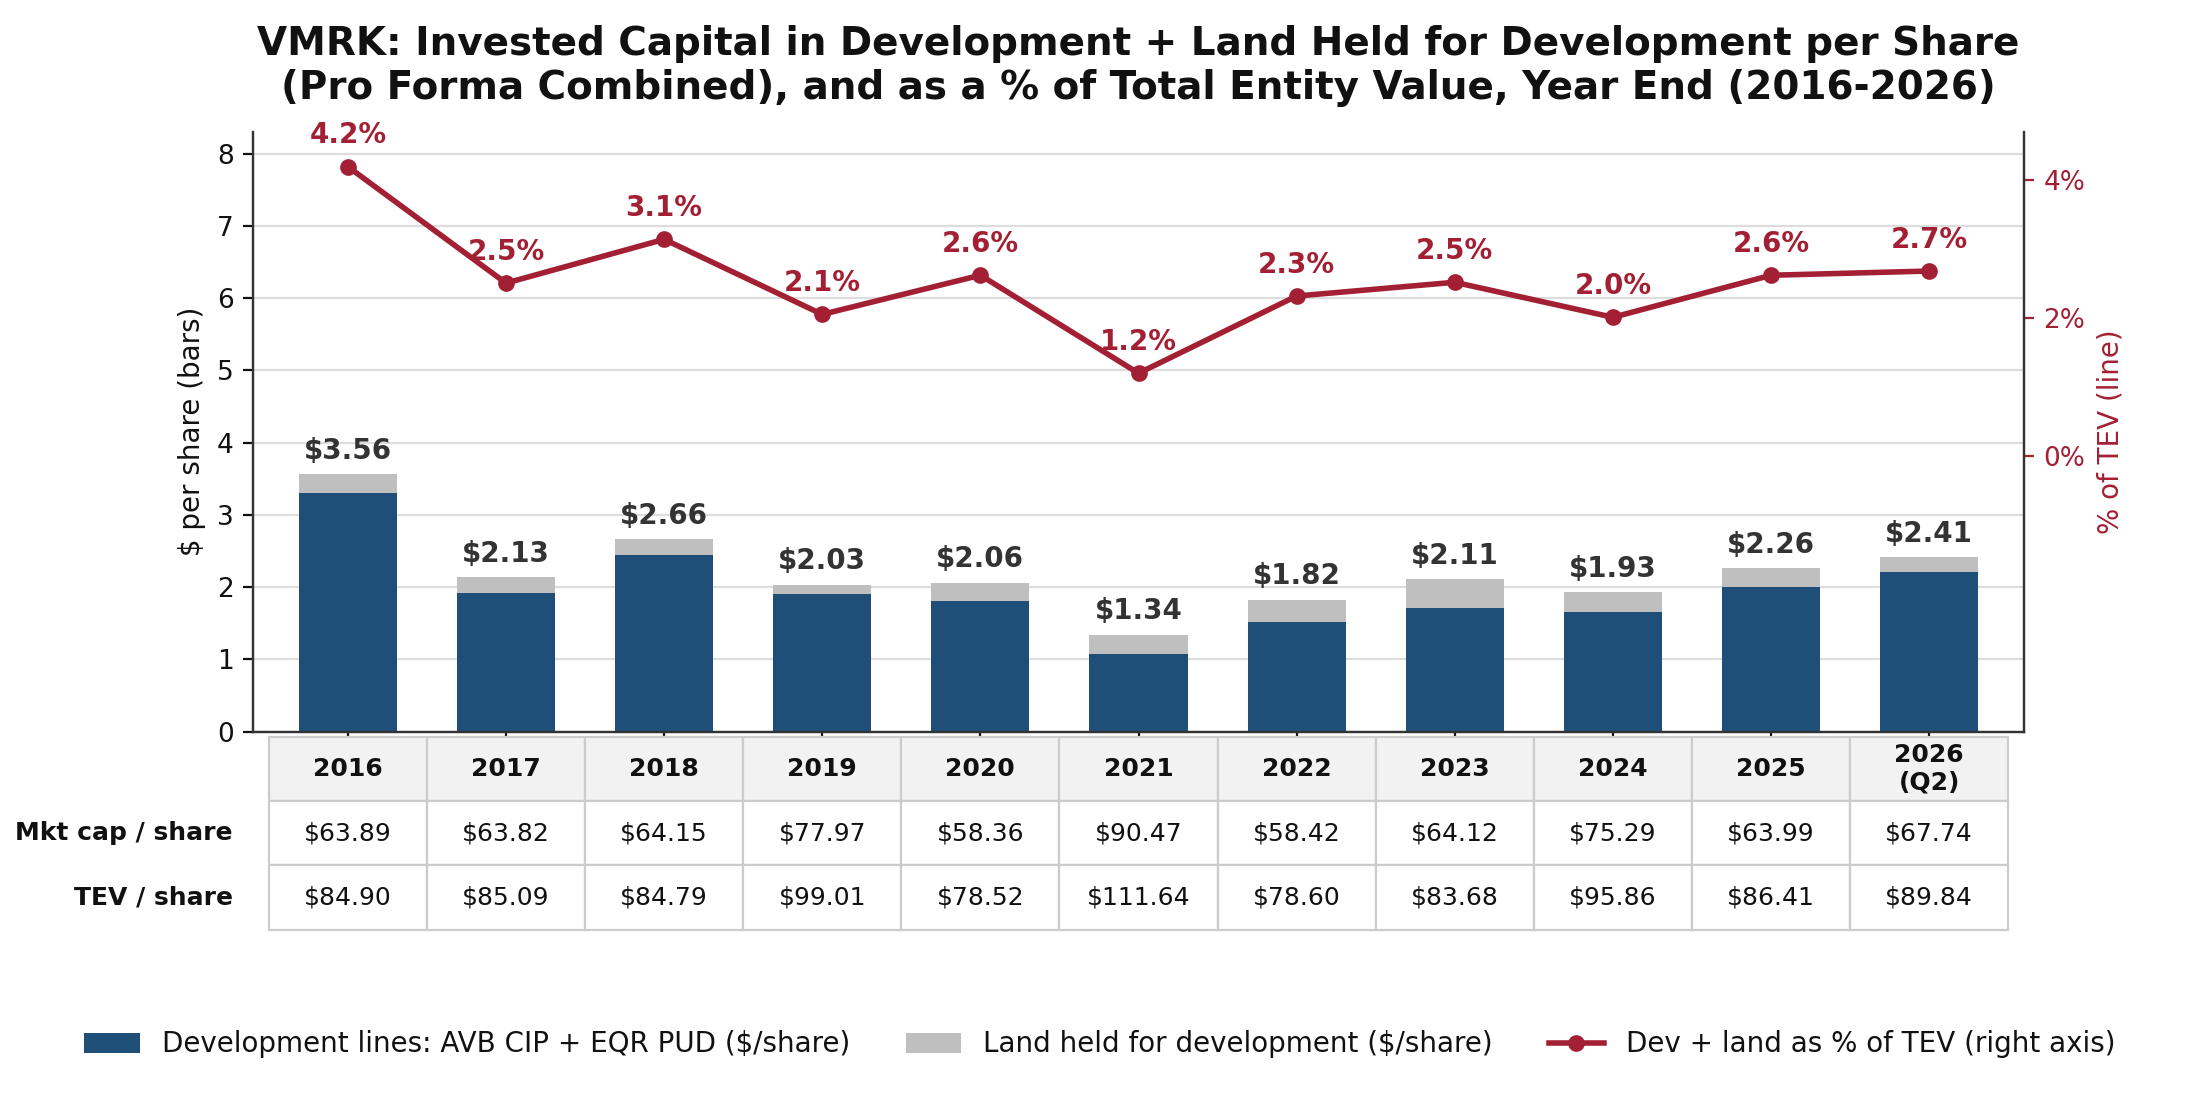
Source: both companies' balance sheets via the canonical workbooks; companion workbook, Quarterly Data development pipeline block (rows 169–180). Bars: AVB "Construction in progress, including land" plus EQR "Projects under development", plus the two land banks, per as-if-converted period-end share and unit; line: the same total as a percentage of TEV. 2026 = quarter end June 2026, not annualized.[3]
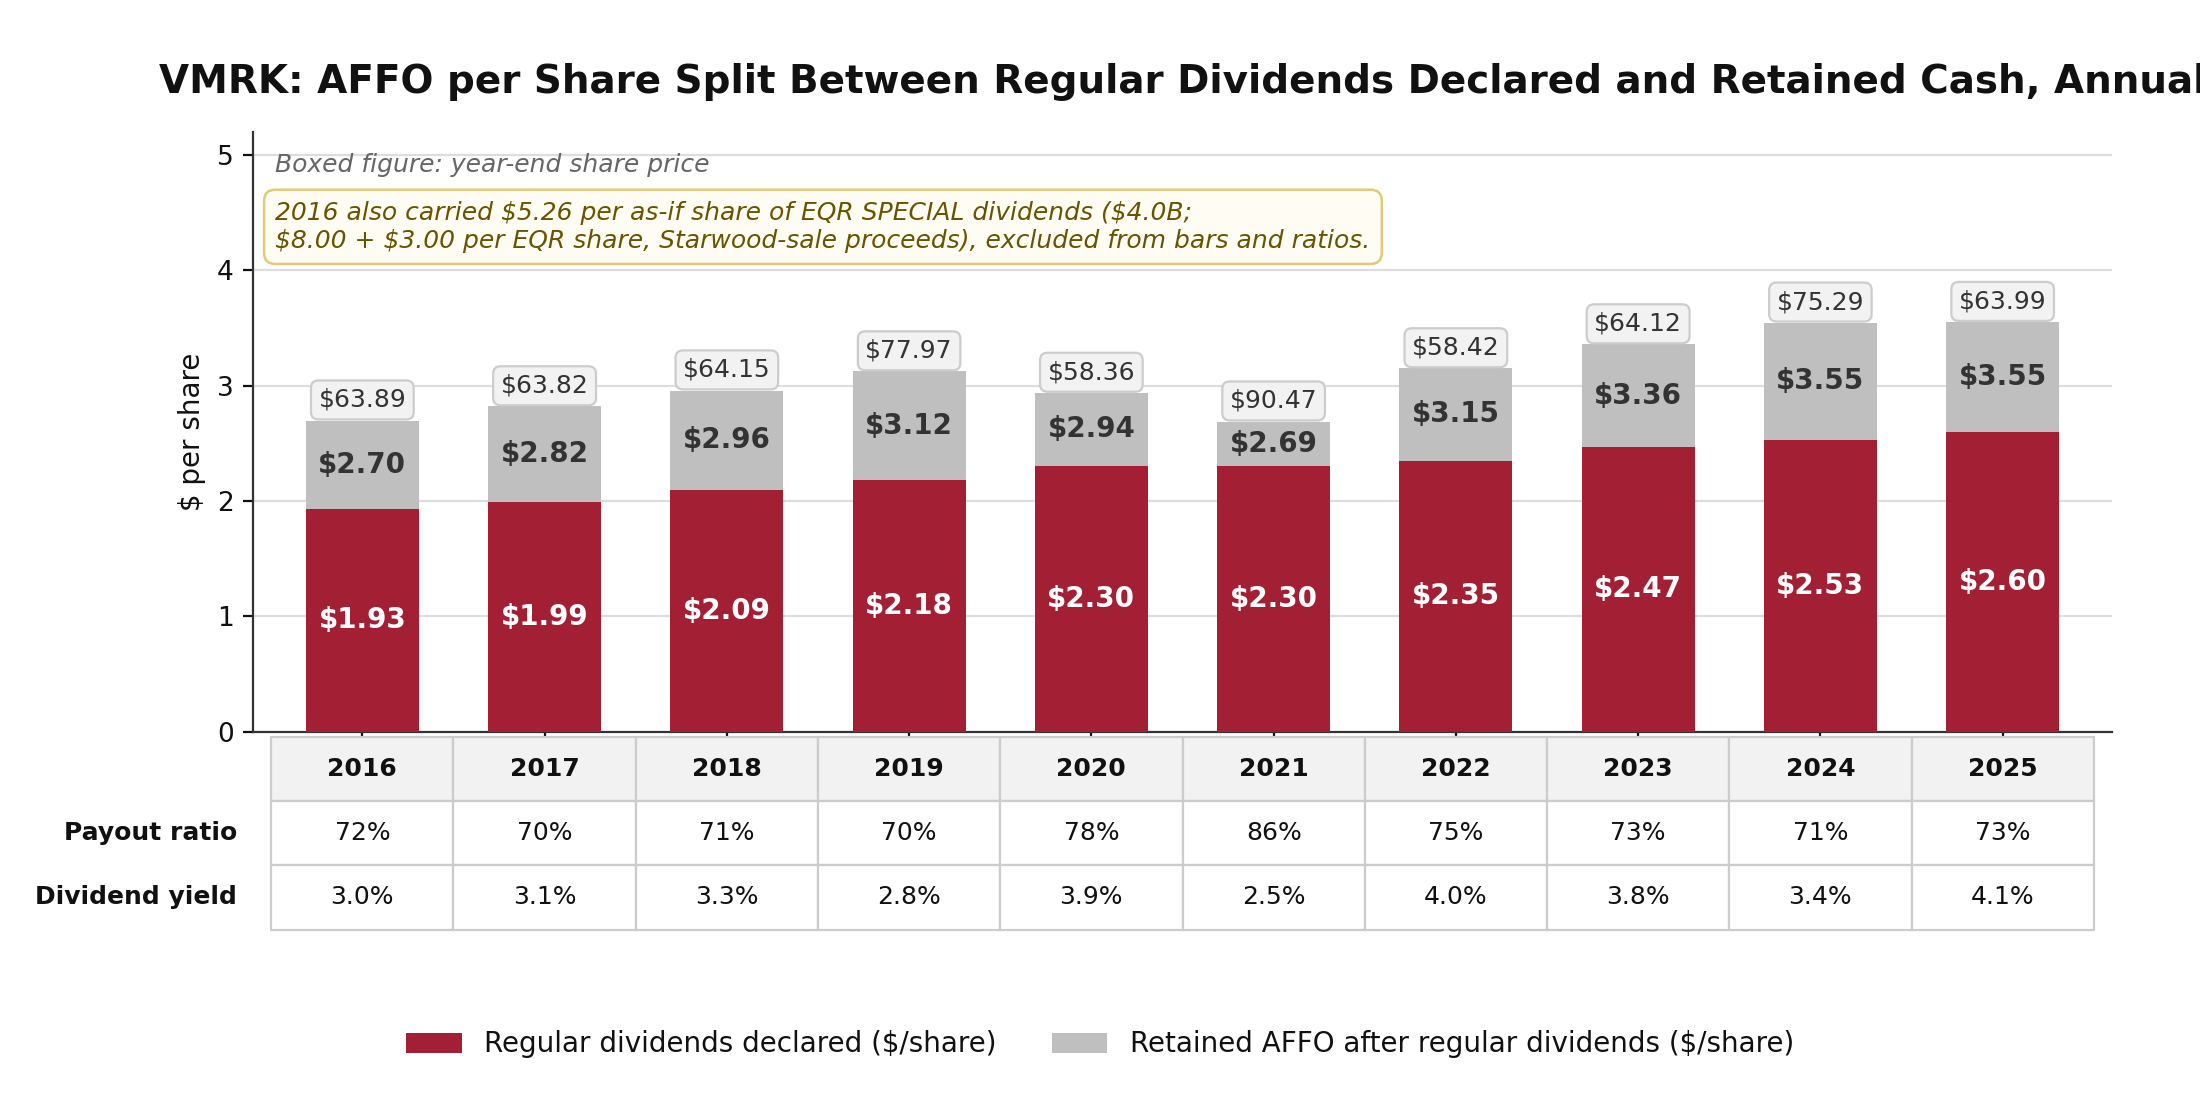
Source: both companies' declared dividends via the canonical workbooks; companion workbook, Quarterly Data dividend rows and annual block. Per-share figures on as-if-converted shares; payout ratio = regular dividends declared / AFFO; dividend yield = regular dividends declared / year-end synthetic price.
The chart above and the three tables below are on an as-reported basis: per-share figures use weighted-average diluted shares and units, and the yields use unadjusted market capitalization and total enterprise value. The tables higher up the page are on the stabilized basis[1], which deducts non-revenue-producing development and land from both capitalization and share counts. FY2025 AFFO reads $3.55 per share here and $3.67 per stabilized share there.
| TTM | Q3 25 | Q4 25 | Q1 26 | Q2 26 | |
|---|---|---|---|---|---|
| AFFO / MKT CAP | 5.2% | 5.2% | 5.5% | 6.1% | 5.1% |
| FFO / MKT CAP | 5.9% | 6.4% | 6.2% | 6.3% | 5.8% |
| EBITDAre / TEV | 5.3% | 5.7% | 5.5% | 5.6% | 5.3% |
| NOI / TEV | 5.9% | 5.9% | 6.2% | 6.5% | 6.0% |
| 2016 | 2017 | 2018 | 2019 | 2020 | 2021 | 2022 | 2023 | 2024 | 2025 | 2026 ann. | |
|---|---|---|---|---|---|---|---|---|---|---|---|
| NOI | $4.07 | $4.20 | $4.38 | $4.54 | $4.26 | $4.04 | $4.66 | $4.88 | $5.08 | $5.22 | $5.34 |
| EBITDAre | $3.84 | $3.89 | $4.05 | $4.18 | $3.92 | $3.66 | $4.23 | $4.43 | $4.58 | $4.78 | $4.66 |
| FFO | $2.95 | $3.09 | $3.15 | $3.34 | $3.12 | $2.94 | $3.49 | $3.72 | $3.85 | $4.01 | $3.84 |
| AFFO | $2.70 | $2.82 | $2.96 | $3.12 | $2.94 | $2.69 | $3.15 | $3.36 | $3.55 | $3.55 | $3.54 |
| CFO | $2.94 | $3.28 | $3.45 | $3.58 | $3.19 | $3.17 | $3.69 | $3.93 | $4.03 | $4.20 | $3.81 |
| 2016 | 2017 | 2018 | 2019 | 2020 | 2021 | 2022 | 2023 | 2024 | 2025 | 2026 ann. | |
|---|---|---|---|---|---|---|---|---|---|---|---|
| NOI | 3.2% | 4.2% | 3.7% | -6.1% | -5.3% | 15.5% | 4.7% | 4.1% | 2.7% | 2.2% | |
| EBITDAre | 1.2% | 4.0% | 3.2% | -6.1% | -6.8% | 15.6% | 4.9% | 3.3% | 4.3% | -2.4% | |
| FFO | 4.7% | 2.0% | 6.1% | -6.7% | -5.7% | 18.9% | 6.5% | 3.4% | 4.2% | -4.4% | |
| AFFO | 4.6% | 4.9% | 5.6% | -5.9% | -8.5% | 17.2% | 6.6% | 5.6% | 0.1% | -0.4% | |
| CFO | 11.5% | 5.2% | 3.7% | -10.8% | -0.9% | 16.4% | 6.7% | 2.6% | 4.2% | -9.3% |
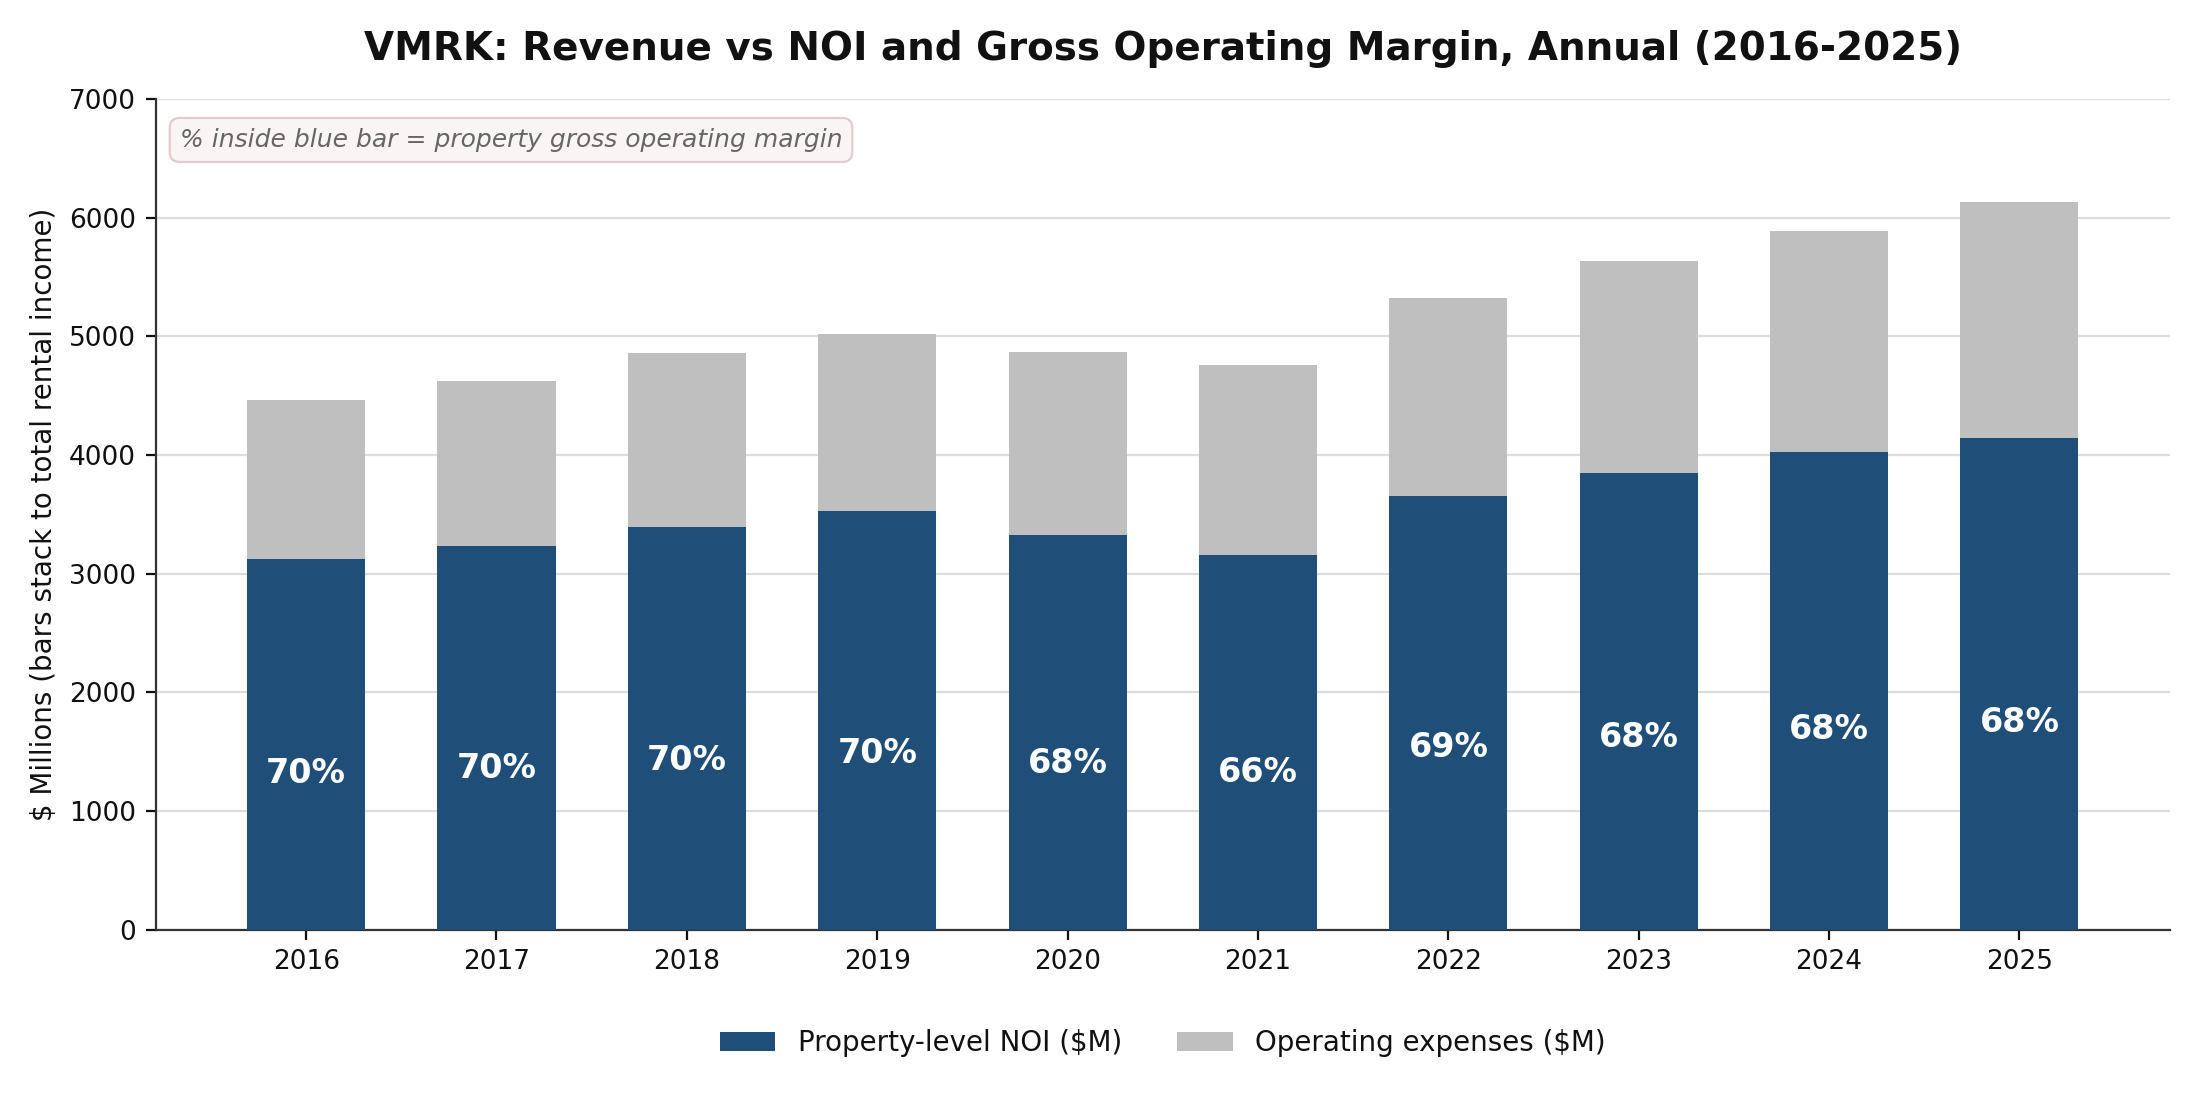
Source: both companies' revenue and operating-expense series via the canonical workbooks (AVB income-statement basis; EQR published-reconciliation basis), own vintage 2016–2025. Margin = (combined revenue less operating expenses) / combined revenue. Companion workbook, Quarterly Data rows 114–118 and 155–161.[4]
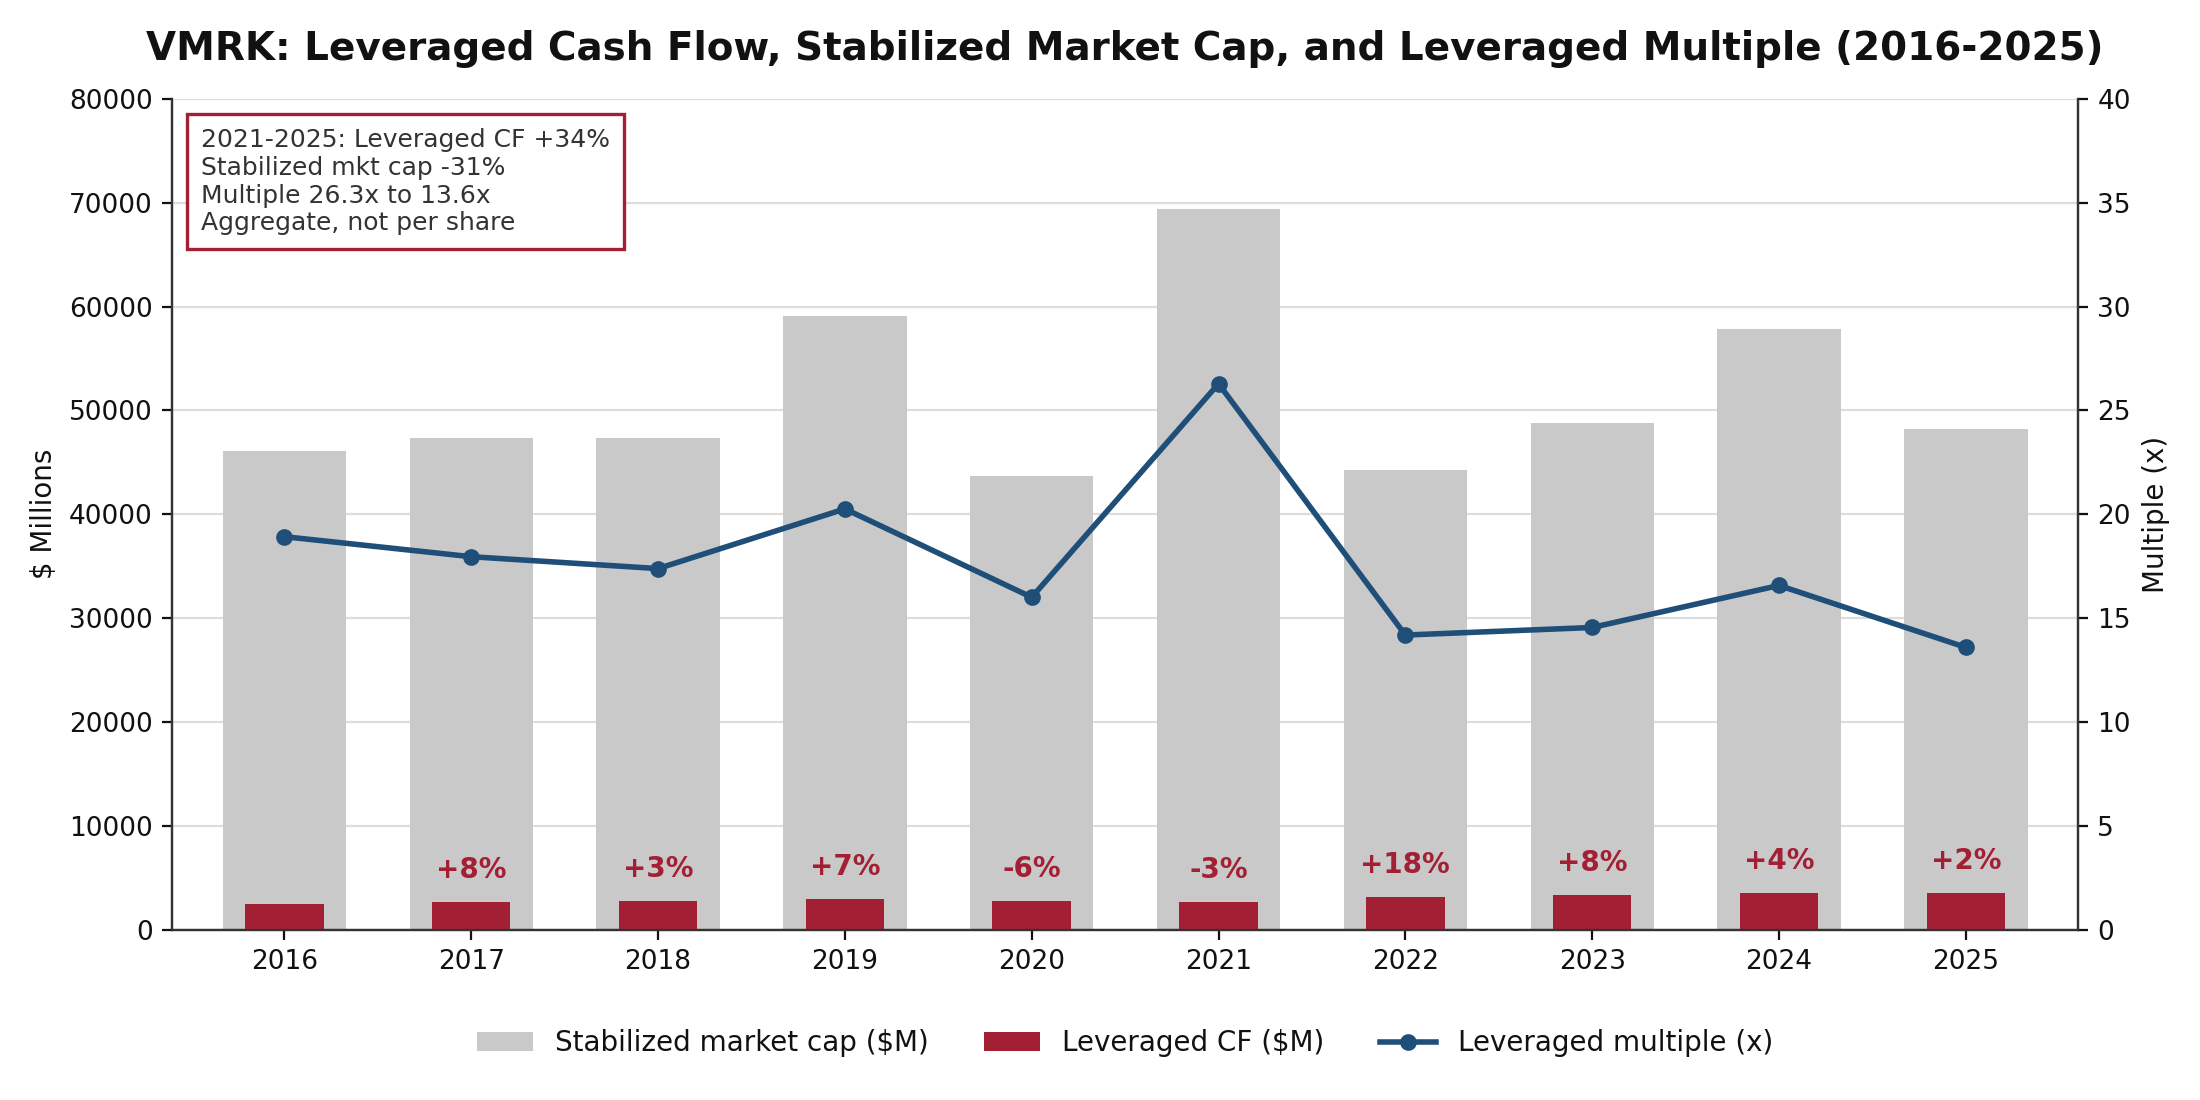
Source: Companion workbook, Quarterly Data annual block; stabilized market cap per the CRE42 method.[1] Leveraged CF = combined NOI less combined interest expense.
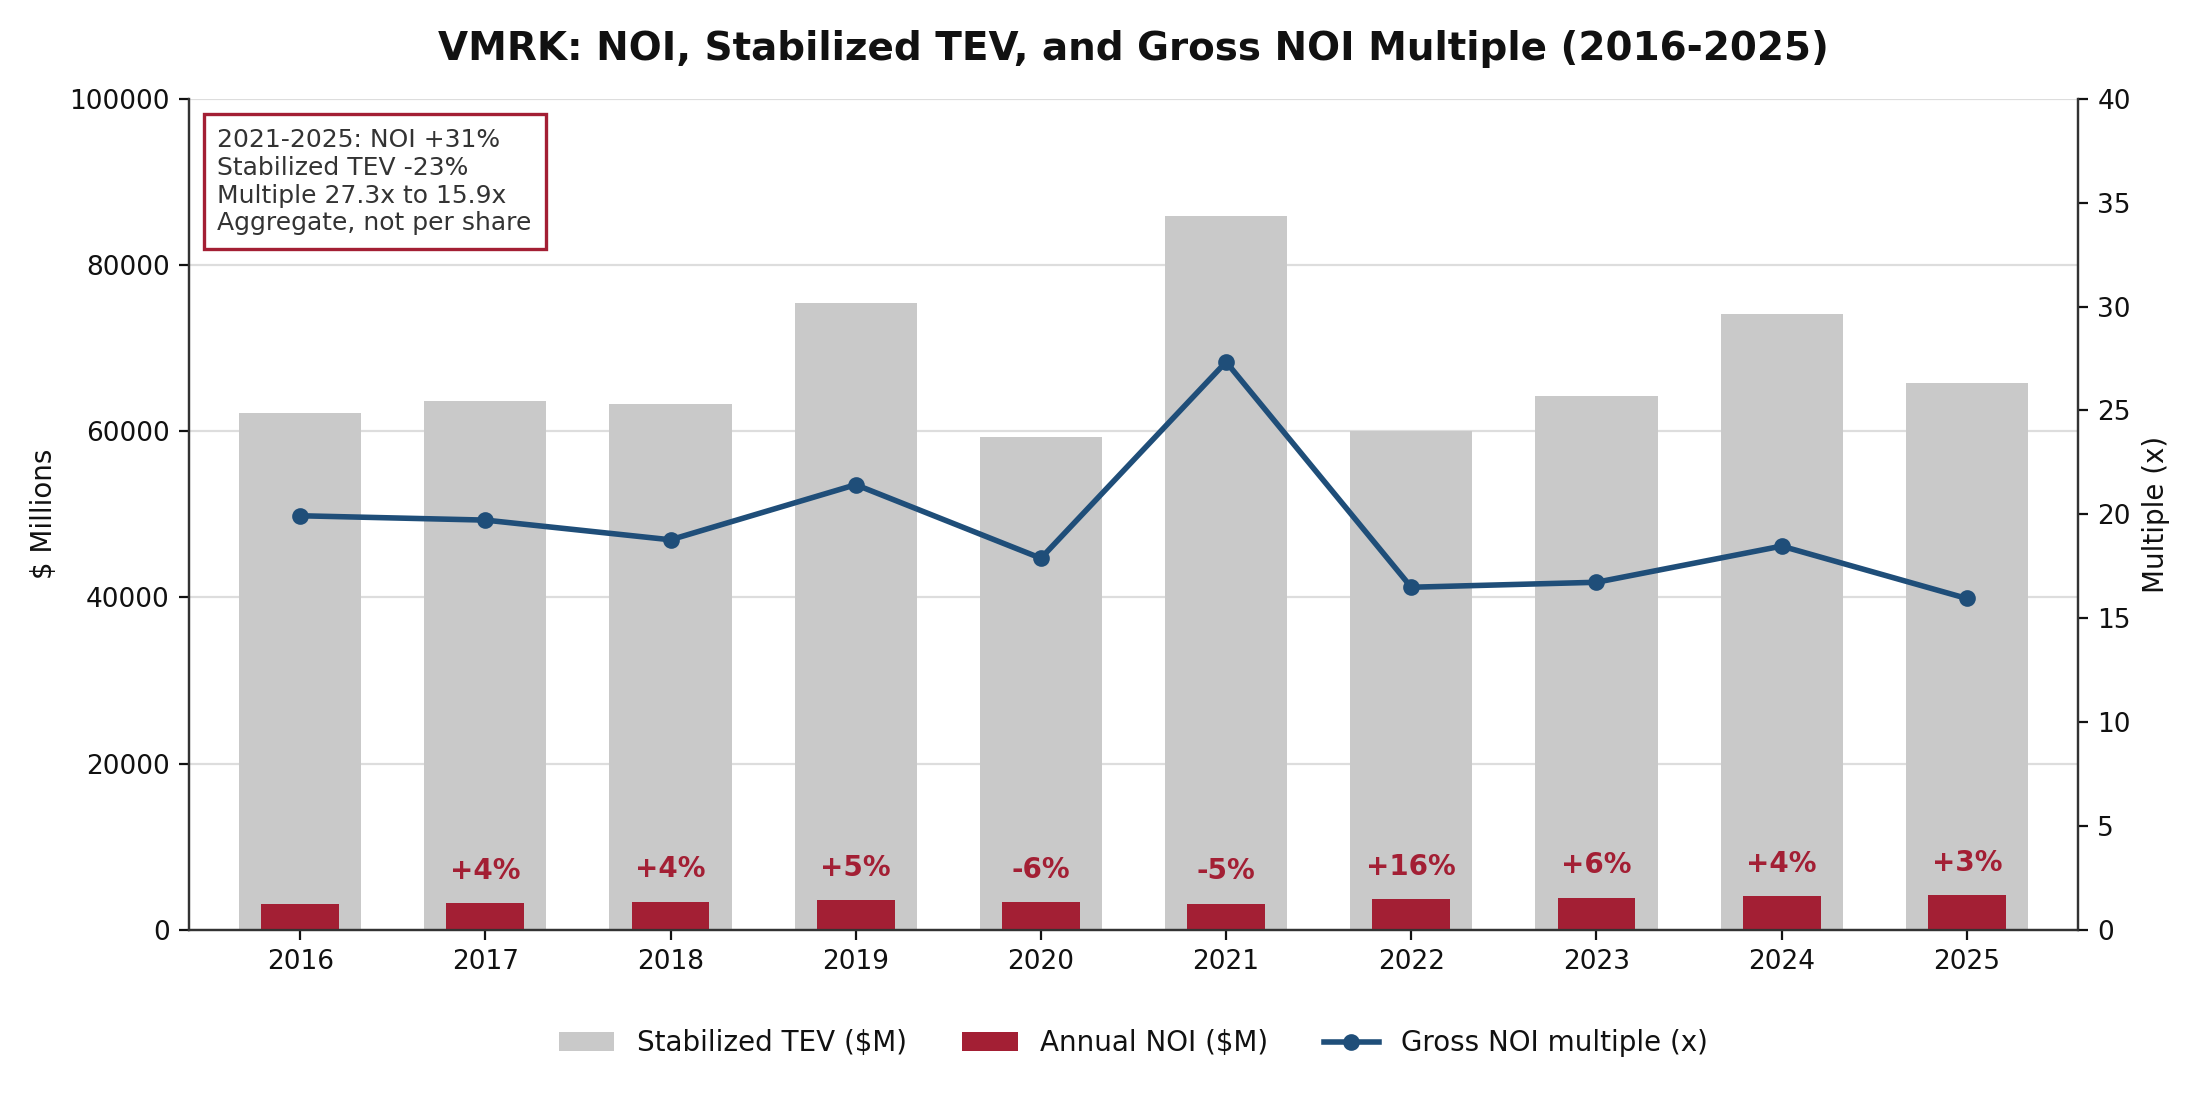
Source: Companion workbook, Quarterly Data annual block; stabilized TEV per the CRE42 method.[1]
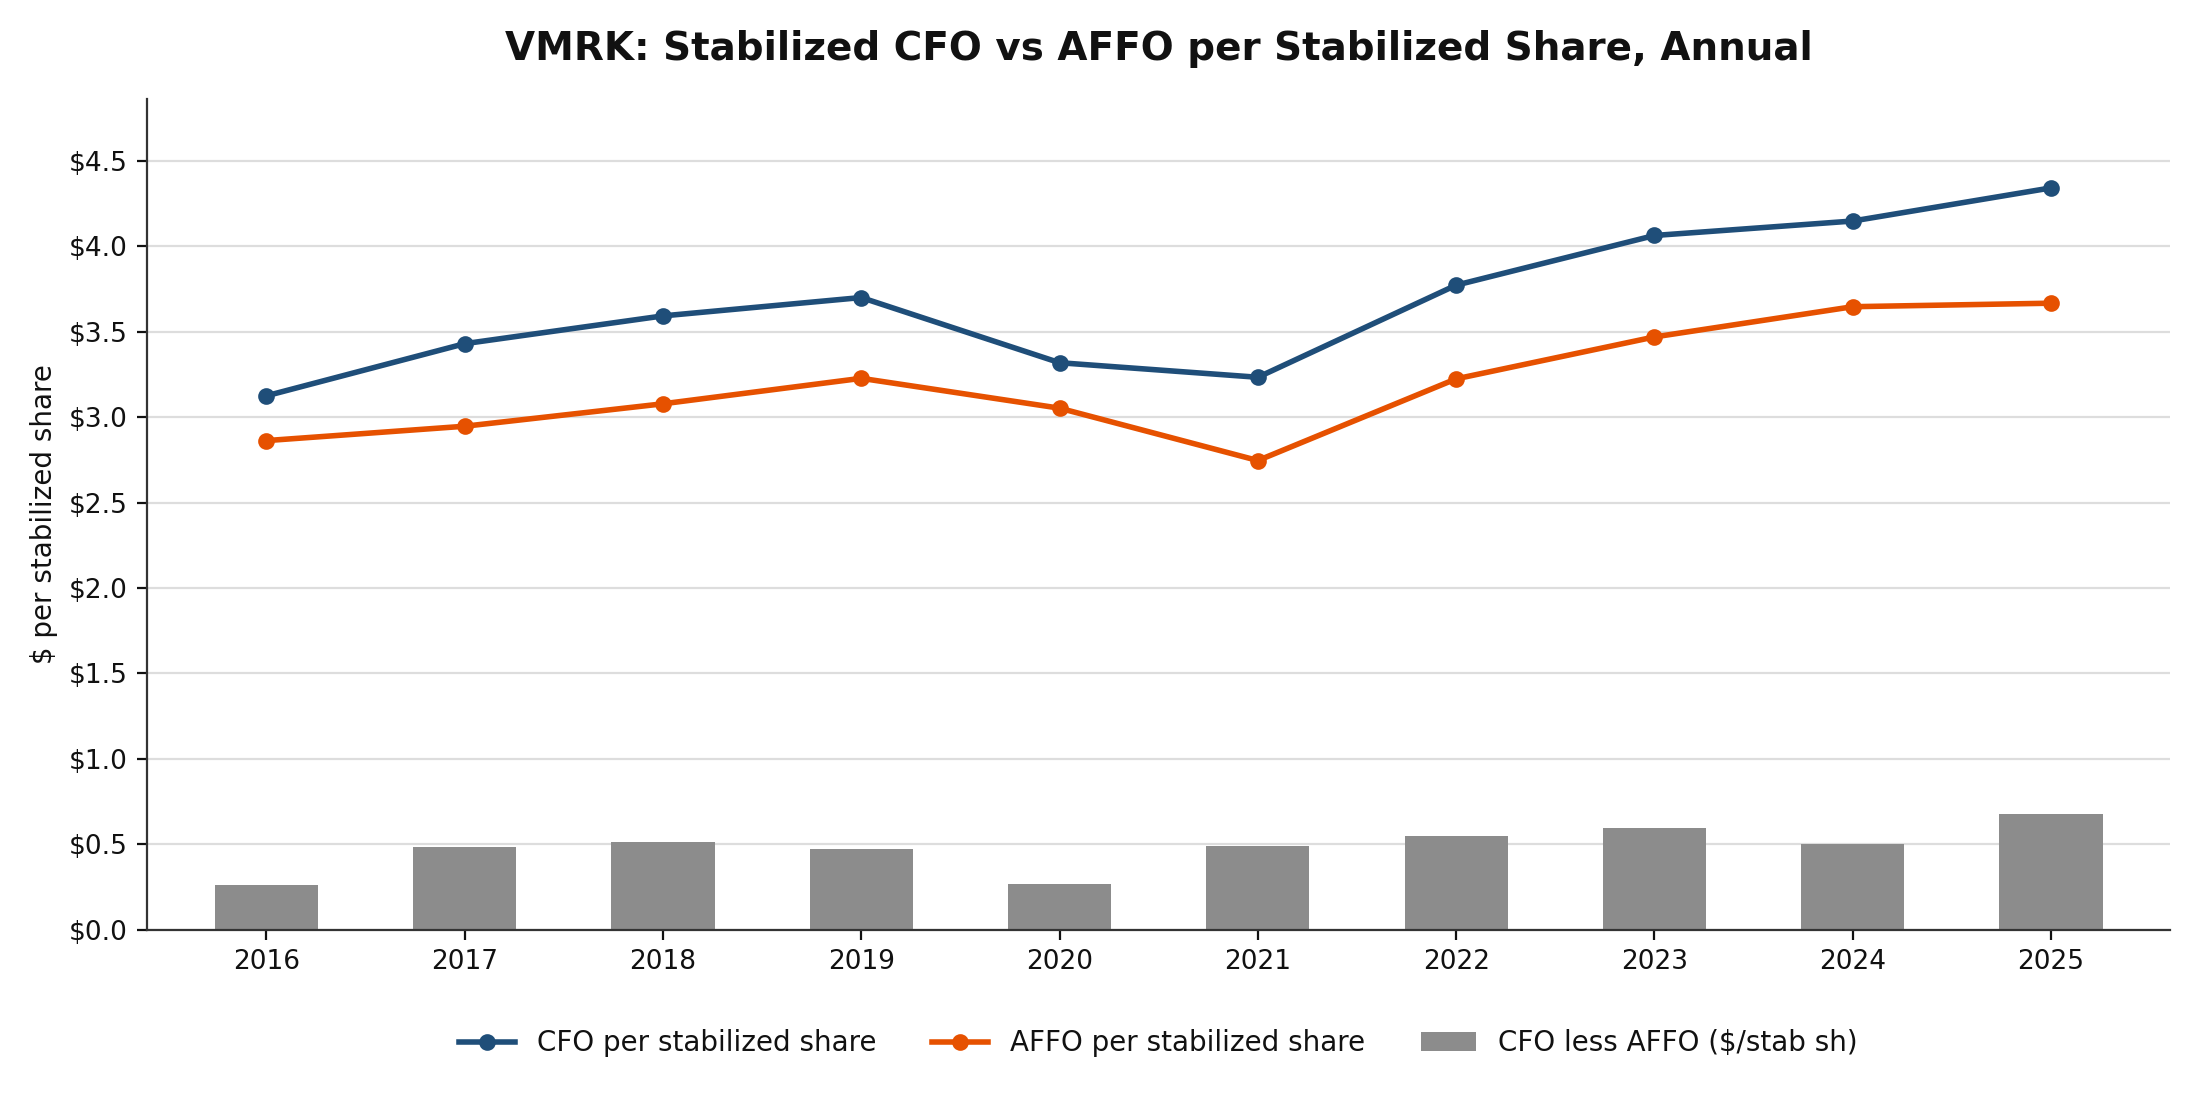
Source: Companion workbook, Quarterly Data annual block. CFO is the sum of both companies' as-reported operating cash flows; AFFO is CRE42-constructed (Core/Normalized FFO less combined recurring capex).
[1] Stabilized basis, accounting mechanics. The stabilized adjustment removes from the combined equity market capitalization and total enterprise value the cumulative invested cost of the two companies' development balance-sheet lines (AVB "Construction in progress, including land" plus EQR "Projects under development") and their separately held development land. Per-share figures deduct the share-equivalent of the same value (dev and land divided by the quarter-end synthetic price) from both weighted-average diluted and period-end as-if-converted share counts. Both companies move assets out of these lines at construction completion rather than stabilization, so the adjustment is, if anything, conservative; neither publishes a figure to cross-check it against. Development in unconsolidated joint ventures (mostly EQR's) is not on these lines and is excluded. Method per the CRE42 REIT-section convention; full decision trail on the companion workbook Sources tab. ↩
[2] Reading the 2026 column. Every 2026 figure is the first half annualized ×2, and the series diverge that year: NOI per stabilized share rises 2.9% and AFFO 0.3%, while EBITDAre falls 1.7%, FFO falls 3.7% and CFO falls 8.7%. The drivers are the same items footnoted on the two standalone pages, now combined: (a) both companies booked merger transaction costs in Q2 2026 (EQR $5.1M plus $2.9M of merger financing costs; AVB's inside its G&A step-up), all inside FFO and EBITDAre but outside the Core/Normalized measures; (b) H1 2026 carries elevated EQR litigation reserves; (c) the 2025 base carries one-time income at both companies (AVB's unrealized proptech gains; EQR's employment-tax refund and securities gains); (d) both companies' operating cash flow is back-half weighted, so H1 ×2 understates CFO. AFFO reads clean because it builds from the Core/Normalized measures. Both companies withdrew earnings guidance on merger pendency.
[3] Development pipeline chart. The two bar segments equal the combined "dev & land value" that note [1] removes from capitalization. The segments mix line semantics: AVB carries land under active projects inside its construction-in-progress line, while EQR splits land out, so the blue segment is AVB CIP (incl. its project land) plus EQR projects under development, and the gray segment is the two separately held land banks. Unconsolidated joint-venture development (the larger share of EQR's current pipeline) is excluded. Per-share figures divide year-end balances by as-if-converted period-end shares plus units, the same count used for the market cap and TEV per share rows beneath the bars. The right axis is offset so the line reads clear of the bars.
[4] Gross operating margin series, mixed basis. The AVB component comes from its consolidated statements of operations (which do not re-base for dispositions, leaving a 0.3% to 1.2% gap to its published NOI, and carrying the FY2023 platform-cost presentation break); the EQR component comes from its published NOI reconciliation and ties exactly. The combined margin ratio is internally consistent, but its numerator will not tie exactly to the combined published NOI in the charts above; the gap equals the AVB gap. Detail on each standalone page.
[5] Pro forma methodology. Whole-dollar figures are the simple sum of the two companies' own-vintage results as compiled in the two canonical workbooks; no eliminations apply (they were separate companies throughout). Per-share figures are as-if-converted: VMRK shares = EQR shares and units plus 2.793 × AVB shares and units, each quarter's actual counts at the fixed merger exchange ratio (merger agreement, per EQR's Q2 2026 Form 10-Q; the ratio does not adjust for price moves). The synthetic share price is combined market capitalization over as-if-converted shares; at Q2 2026 it reads $67.74 against EQR's actual $67.93 and ratio-adjusted AVB at $67.56, and in earlier years it is a value-weighted blend of the two stocks. Combined Core/Normalized FFO sums AVB Core FFO and EQR Normalized FFO; combined recurring capex sums each company's own measure (definitions converge only when VMRK publishes its own disclosure). When VMRK begins reporting (expected Q3 2026), actual combined figures and actual share counts take over; expect one-time merger costs at close and purchase-accounting depreciation step-up, which barely touches this metric set since NOI, EBITDAre, FFO and AFFO sit above or exclude real estate depreciation. The combined company name and ticker are carried per Chip's direction pending their appearance in filings.
[6] FFO endpoint CAGR. The stabilized CAGR table uses single-quarter endpoints (Q1 2016 to Q2 2026). Q1 2016 combined FFO carries the debt-extinguishment and prepayment costs of EQR's post-Starwood deleveraging, so the FFO row's CAGR is inflated by a depressed base quarter; the Core/Normalized FFO and AFFO constructions exclude those costs.
Data. This page is derived entirely from the two canonical CRE42 workbooks (AVB-individual-metrics.xlsx and EQR-individual-metrics.xlsx), carried as value-input tabs inside the companion workbook; no new extraction was performed. Every underlying figure is cited on those workbooks' Sources tabs and in their per-figure citation archives. AFFO is a CRE42 construct with no published figure to tie to at either company. Trailing yields and multiples use trailing-twelve-month combined results against quarter-end June 2026 stabilized combined capitalization. On May 21, 2026 AvalonBay and Equity Residential announced an all-stock merger of equals expected to close in H2 2026; this page is the pro forma combined record and will switch to Vmark's reported figures when combined reporting begins.
Companion workbook. VMRK-individual-metrics.xlsx – pro forma combined 42-quarter grid (as reported and stabilized) over value copies of the two source workbooks, the fixed-ratio share construction, annual aggregations, and native chart tabs (CHARTS, CHARTS STAB).