Overview
This page uses CoStar MSA-level subtype data for two markets: Chicago (mature) and Dallas–Fort Worth (growth). The data covers six of CoStar’s 18 retail subtypes* — super regional mall, regional mall, power center, lifestyle center, strip center, and neighborhood center — representing the majority of institutional retail inventory by square footage.
Three metrics are presented for each subtype: total vacancy rate (direct plus sublet, SF-weighted), net absorption, and new deliveries.[1]
* CoStar classifies retail properties into 18 subtypes: Airport Retail, Community Center, District, Leisure Park, Lifestyle Center, Major Urban Centre, Neighborhood Center, Outlet Center, Power Center, Regional Mall, Regional Prime, Retail Park, Shopping Park, Solus Unit, Strip Center, Super Regional Mall, Theme/Festival Center, and Urban Centre. The six subtypes analyzed here were selected for institutional relevance and mapping to the format categories in Retail Format Divergence. Single-tenant/NNN and urban/high street retail, discussed on that page, are not CoStar subtypes and cannot be isolated in this dataset.
Key Observations
All Subtypes Combined (SF-Weighted)
The composite charts below weight vacancy by square footage across all six subtypes, so larger-inventory formats (neighborhood centers, strip centers, power centers) dominate the blended rate. Net absorption and deliveries are summed across all six subtypes. This is the aggregate picture that subtype-level data is designed to decompose.
Chicago: All Retail Subtypes, 2006–2025
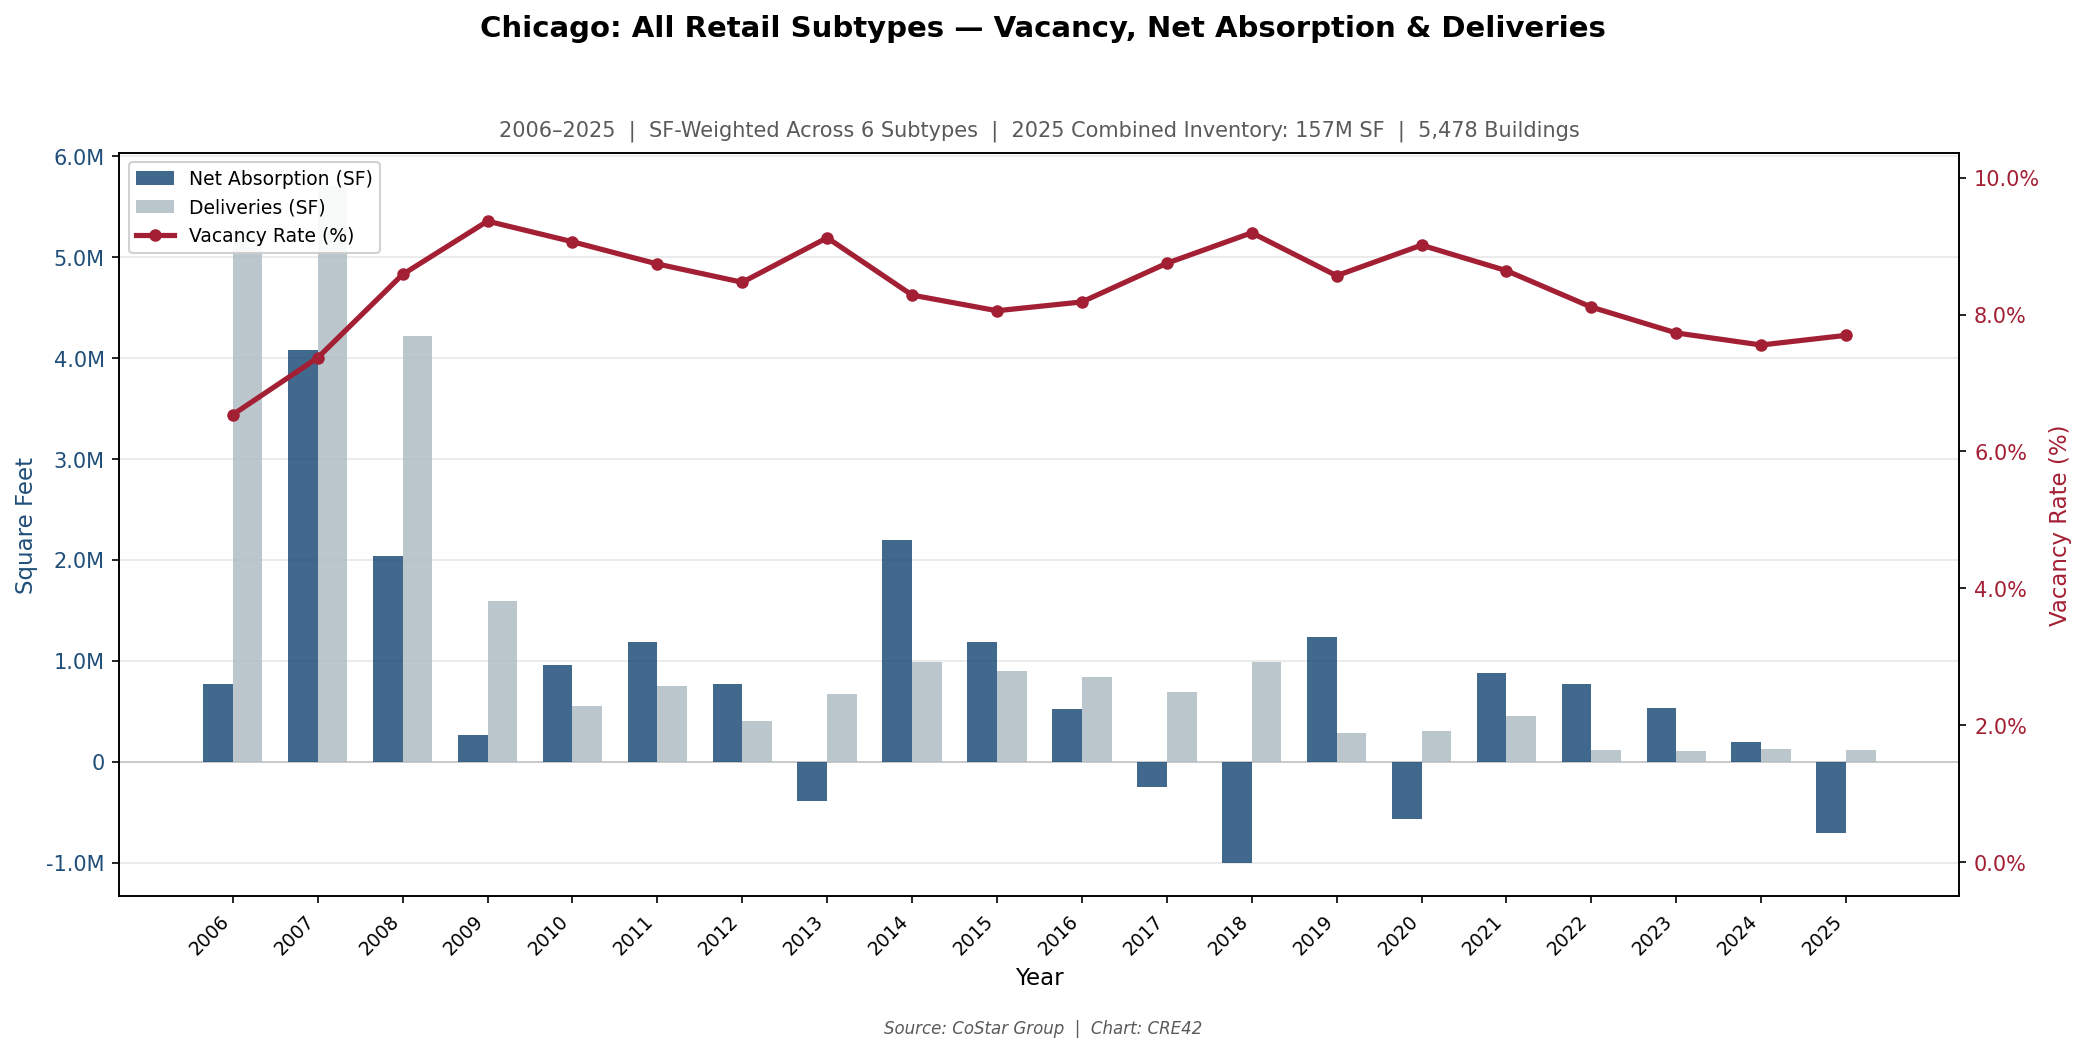
Chicago MSA: SF-Weighted Vacancy Rate, Net Absorption & Deliveries — 6 Retail Subtypes Combined, 2006–2025 | 157M SF, 5,478 Buildings | Source: CoStar Group | Chart: CRE42
DFW: All Retail Subtypes, 2006–2025
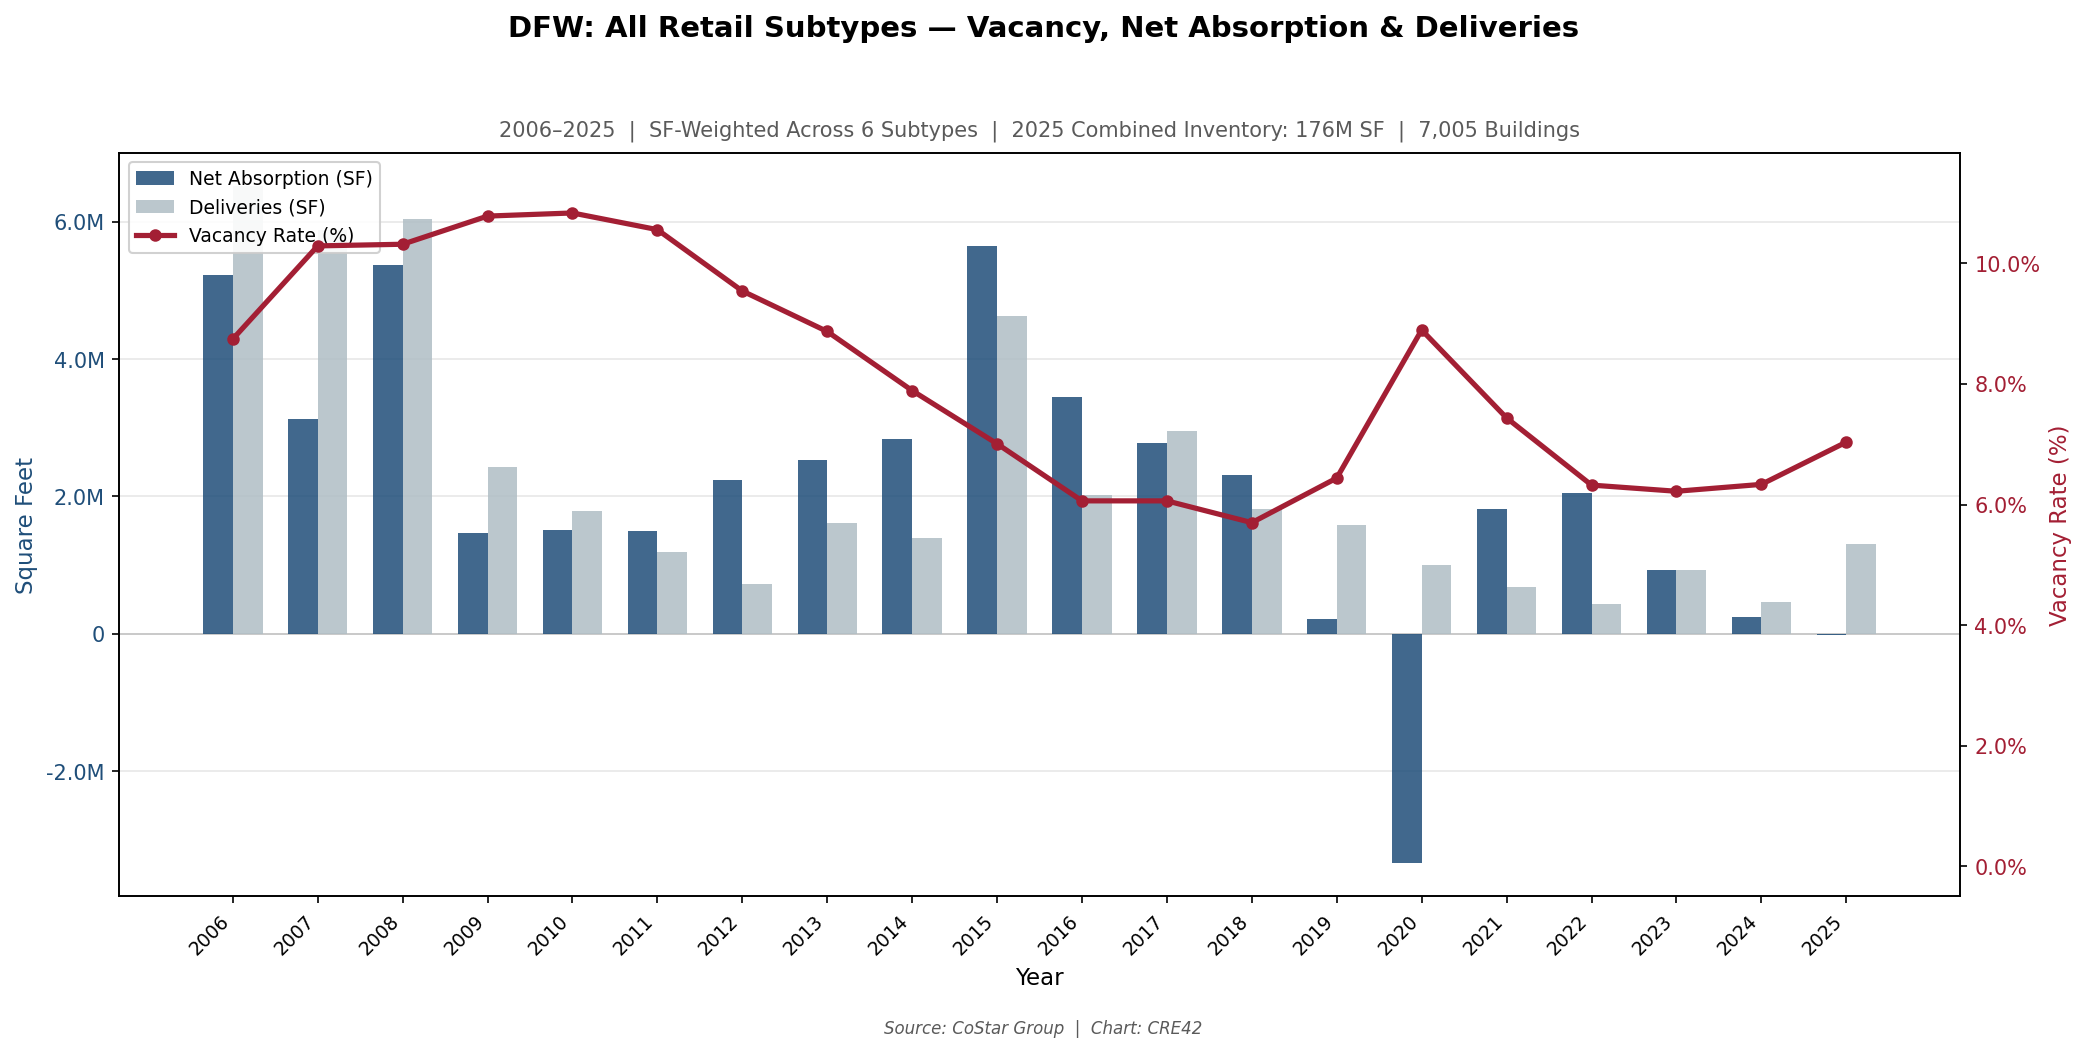
DFW MSA: SF-Weighted Vacancy Rate, Net Absorption & Deliveries — 6 Retail Subtypes Combined, 2006–2025 | 176M SF, 7,005 Buildings | Source: CoStar Group | Chart: CRE42
At the aggregate level, both markets followed similar post-GFC recovery patterns: vacancy peaked in 2009–2010, then compressed as deliveries slowed. DFW’s compression was absorption-led — net absorption exceeded deliveries in 14 of 20 years (2006–2025). Chicago’s vacancy improvement was more dependent on reduced new supply, with deliveries falling from 5.7 million SF (2007) to under 130,000 SF annually by 2023–2025. DFW’s COVID vacancy spike (8.9% in 2020, driven by –3.3 million SF of net absorption) was sharper than Chicago’s (9.0%), but the recovery was faster: DFW returned to 6.2% by 2023 while Chicago only reached 7.6% by 2024.
Super Regional Mall
Super regional malls — typically 800,000+ SF, anchored by three or more department stores — are the subtype most associated with the “retail apocalypse” narrative. The data below tracks the full trajectory from peak occupancy through anchor departure and rising structural vacancy.
Chicago: Super Regional Mall, 2006–2025
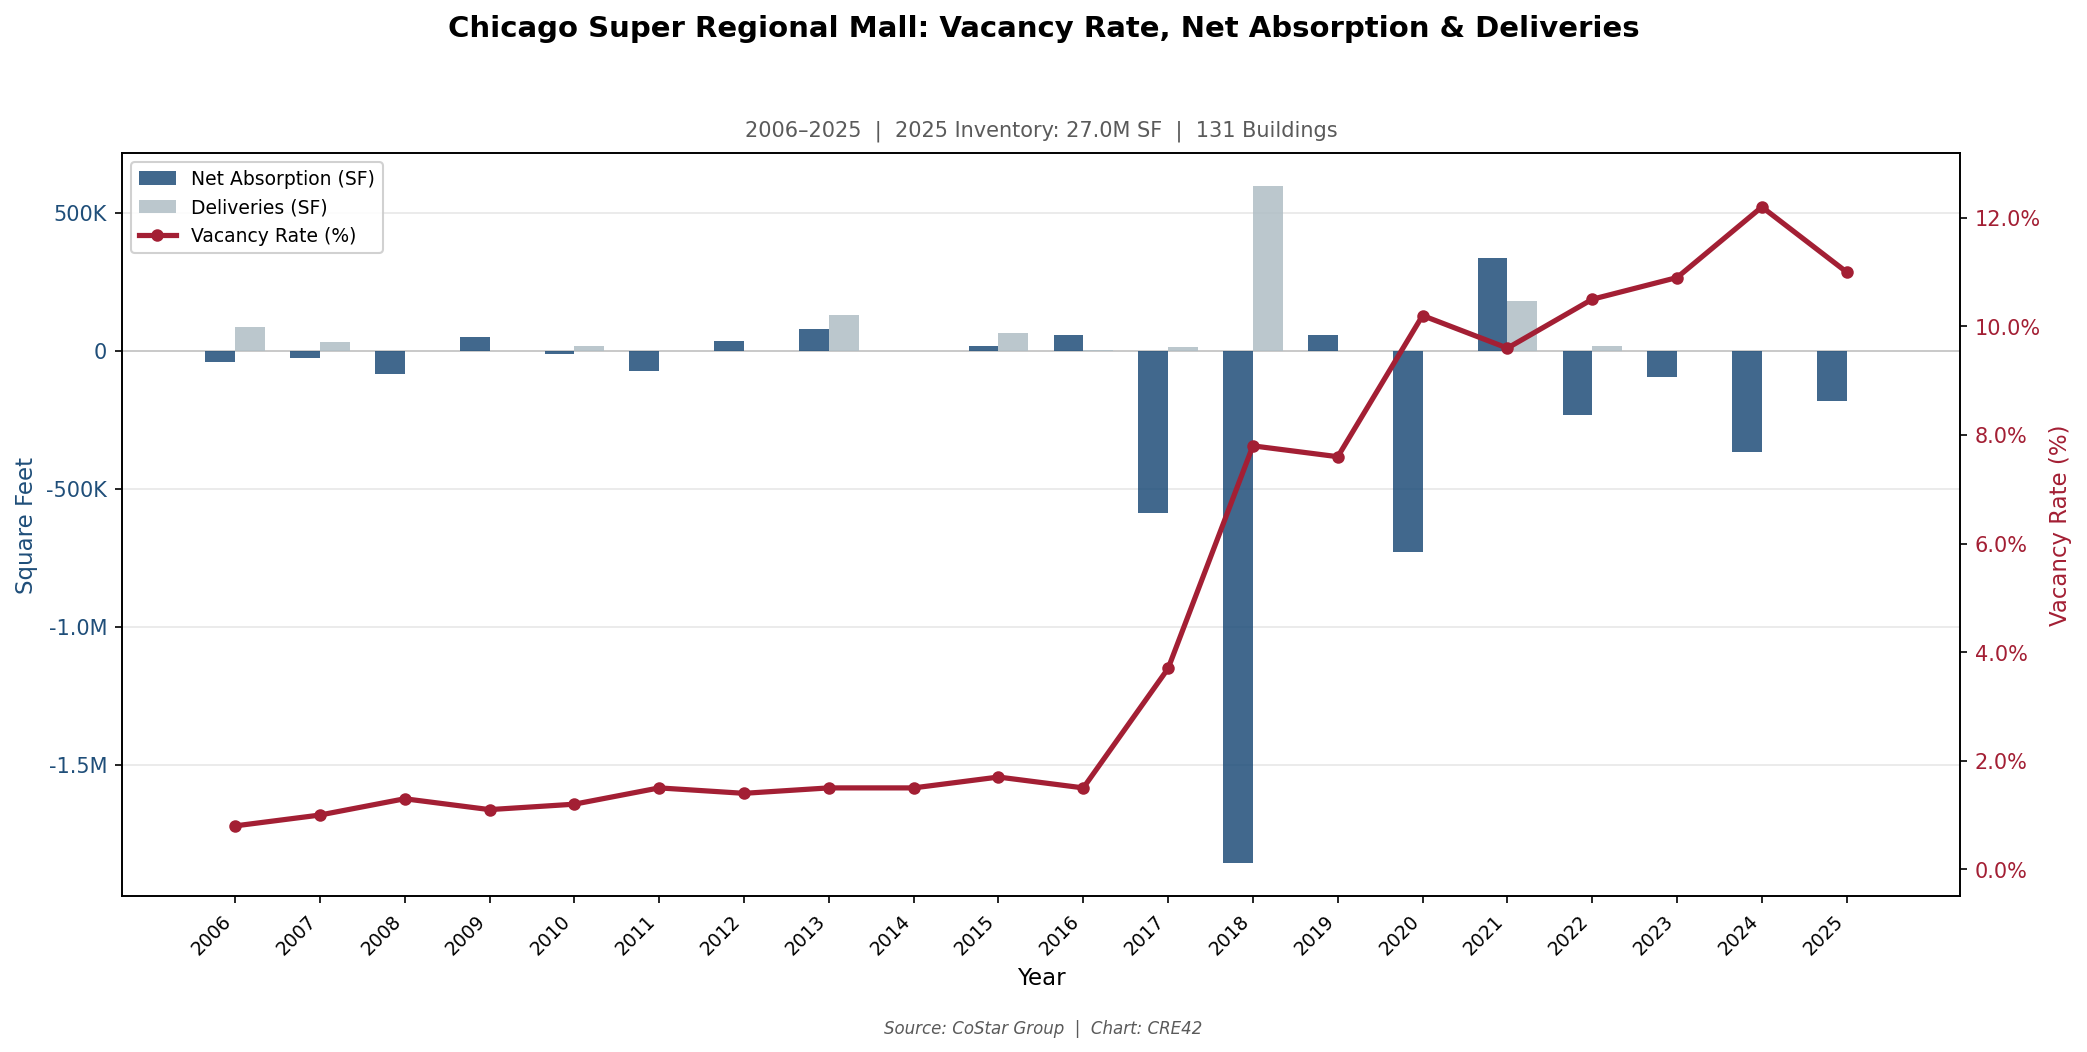
Chicago MSA: Super Regional Mall — Vacancy Rate, Net Absorption & Deliveries, 2006–2025 | 27.0M SF, 131 Buildings | Source: CoStar Group | Chart: CRE42
DFW: Super Regional Mall, 2006–2025
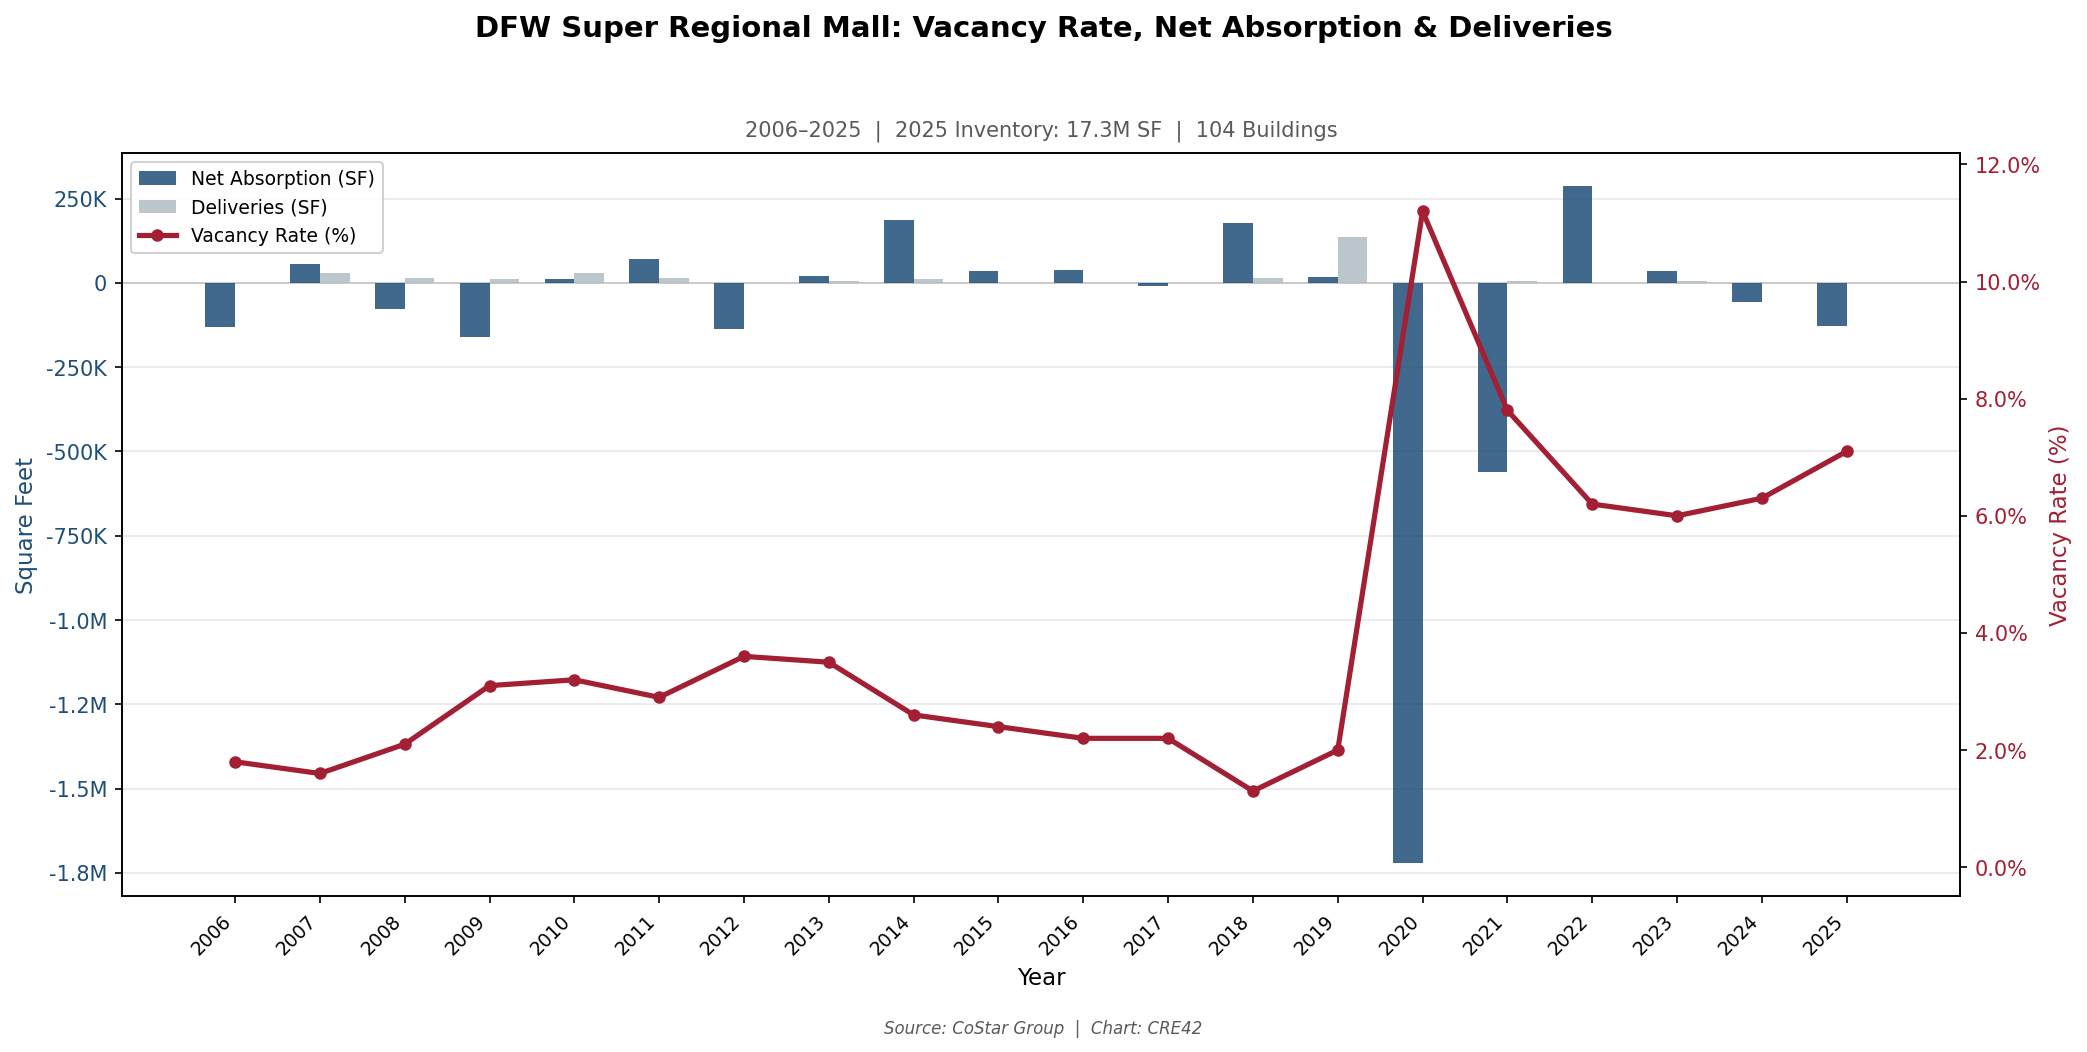
DFW MSA: Super Regional Mall — Vacancy Rate, Net Absorption & Deliveries, 2006–2025 | 17.3M SF, 104 Buildings | Source: CoStar Group | Chart: CRE42
Chicago’s super regional mall trajectory is the most dramatic in the dataset. Vacancy was below 2% through 2016, then surged to 7.8% in 2018 on –1.85 million SF of net absorption — likely representing one or two major anchor departures. The inventory actually shrank from 28.1 million SF (2016) to 27.0 million SF (2025), meaning the vacancy increase is entirely demand destruction, not oversupply. DFW’s super regional malls followed a more gradual deterioration, with vacancy rising from 3.3% to 7.1% over the full period but without a single catastrophic year. DFW’s larger inventory reduction (from 19.3M to 17.3M SF, –10%) suggests more active demolition and redevelopment of distressed assets, which would mechanically remove some of the worst-performing properties from the subtype average.
Regional Mall
Regional malls are smaller enclosed centers, typically 400,000–800,000 SF with one or two anchors. Both markets have very small regional mall inventories, and the data should be interpreted with particular caution.[3]
Chicago: Regional Mall, 2006–2025
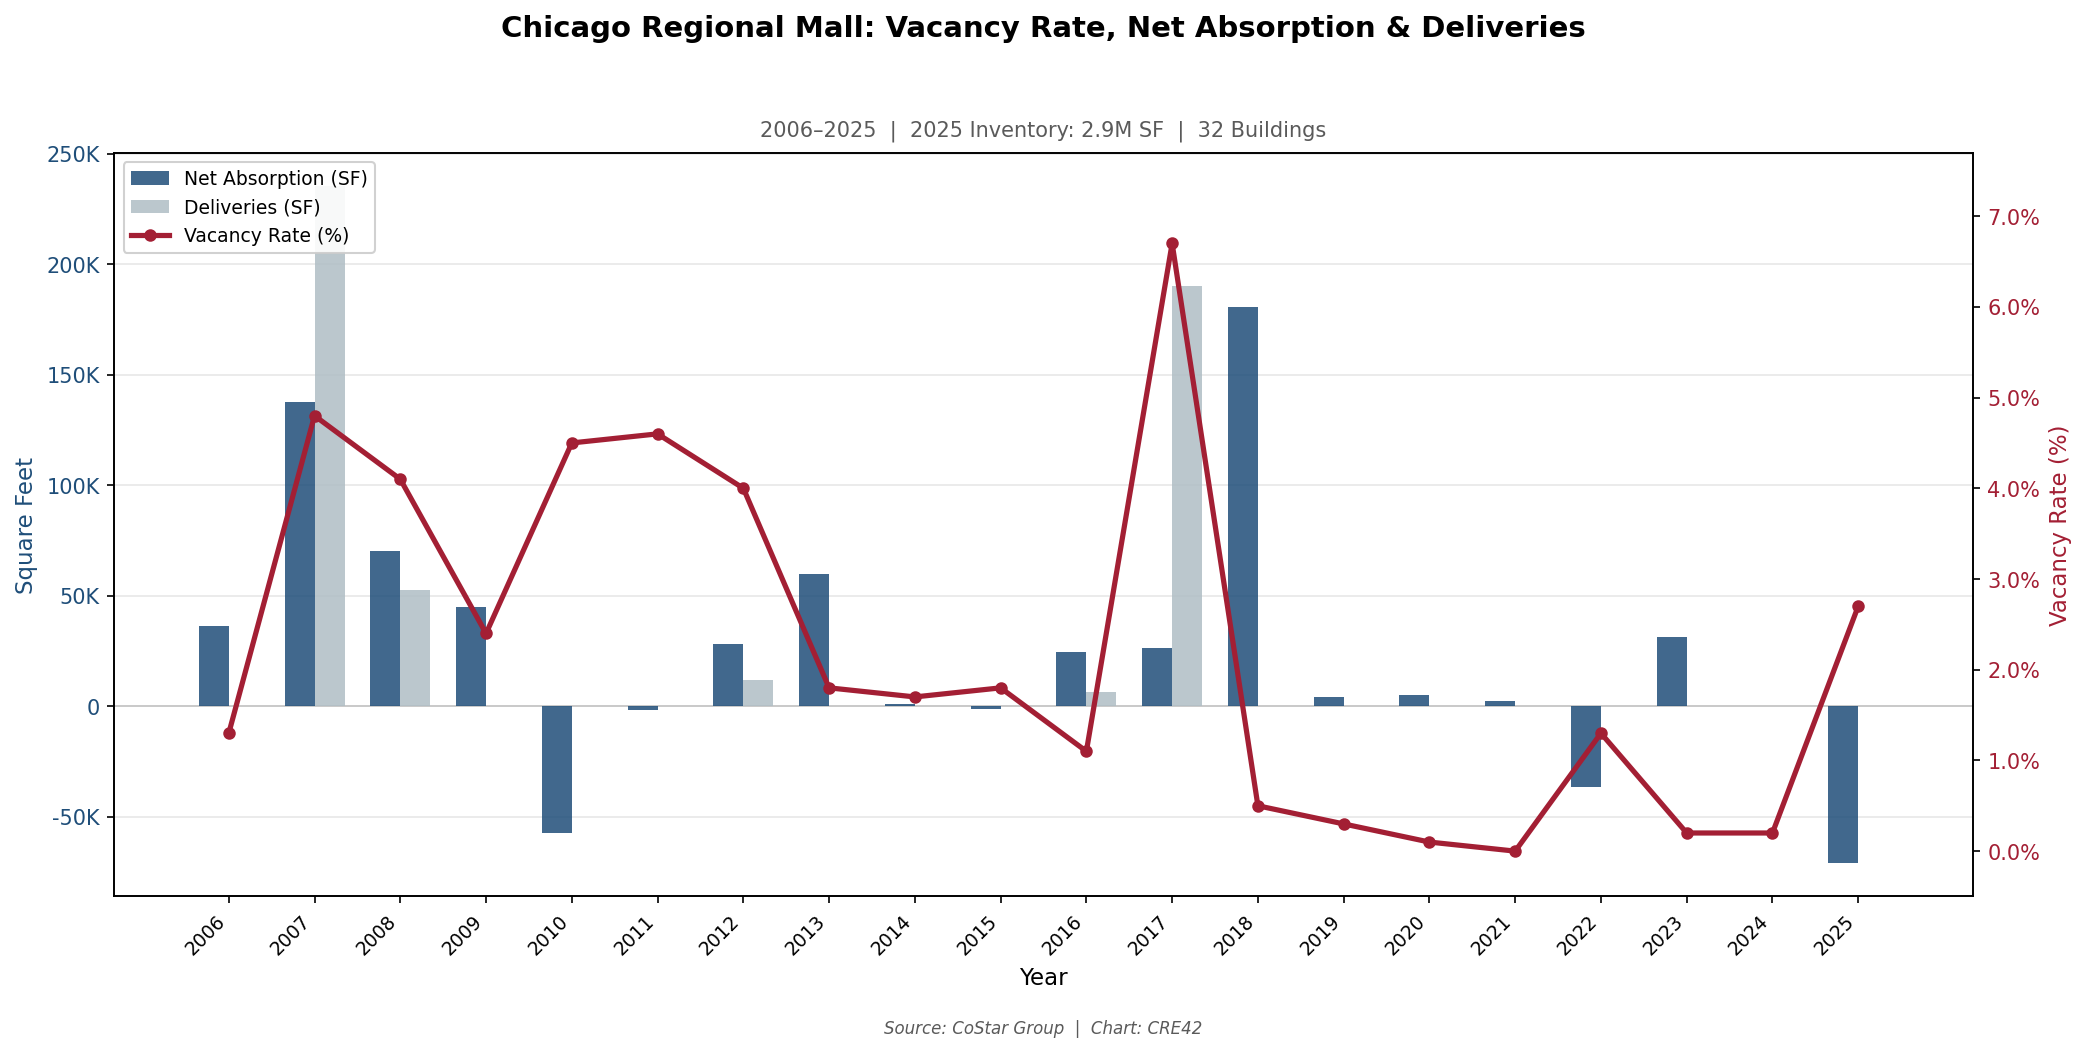
Chicago MSA: Regional Mall — Vacancy Rate, Net Absorption & Deliveries, 2006–2025 | 2.9M SF, 32 Buildings | Source: CoStar Group | Chart: CRE42
DFW: Regional Mall, 2006–2025
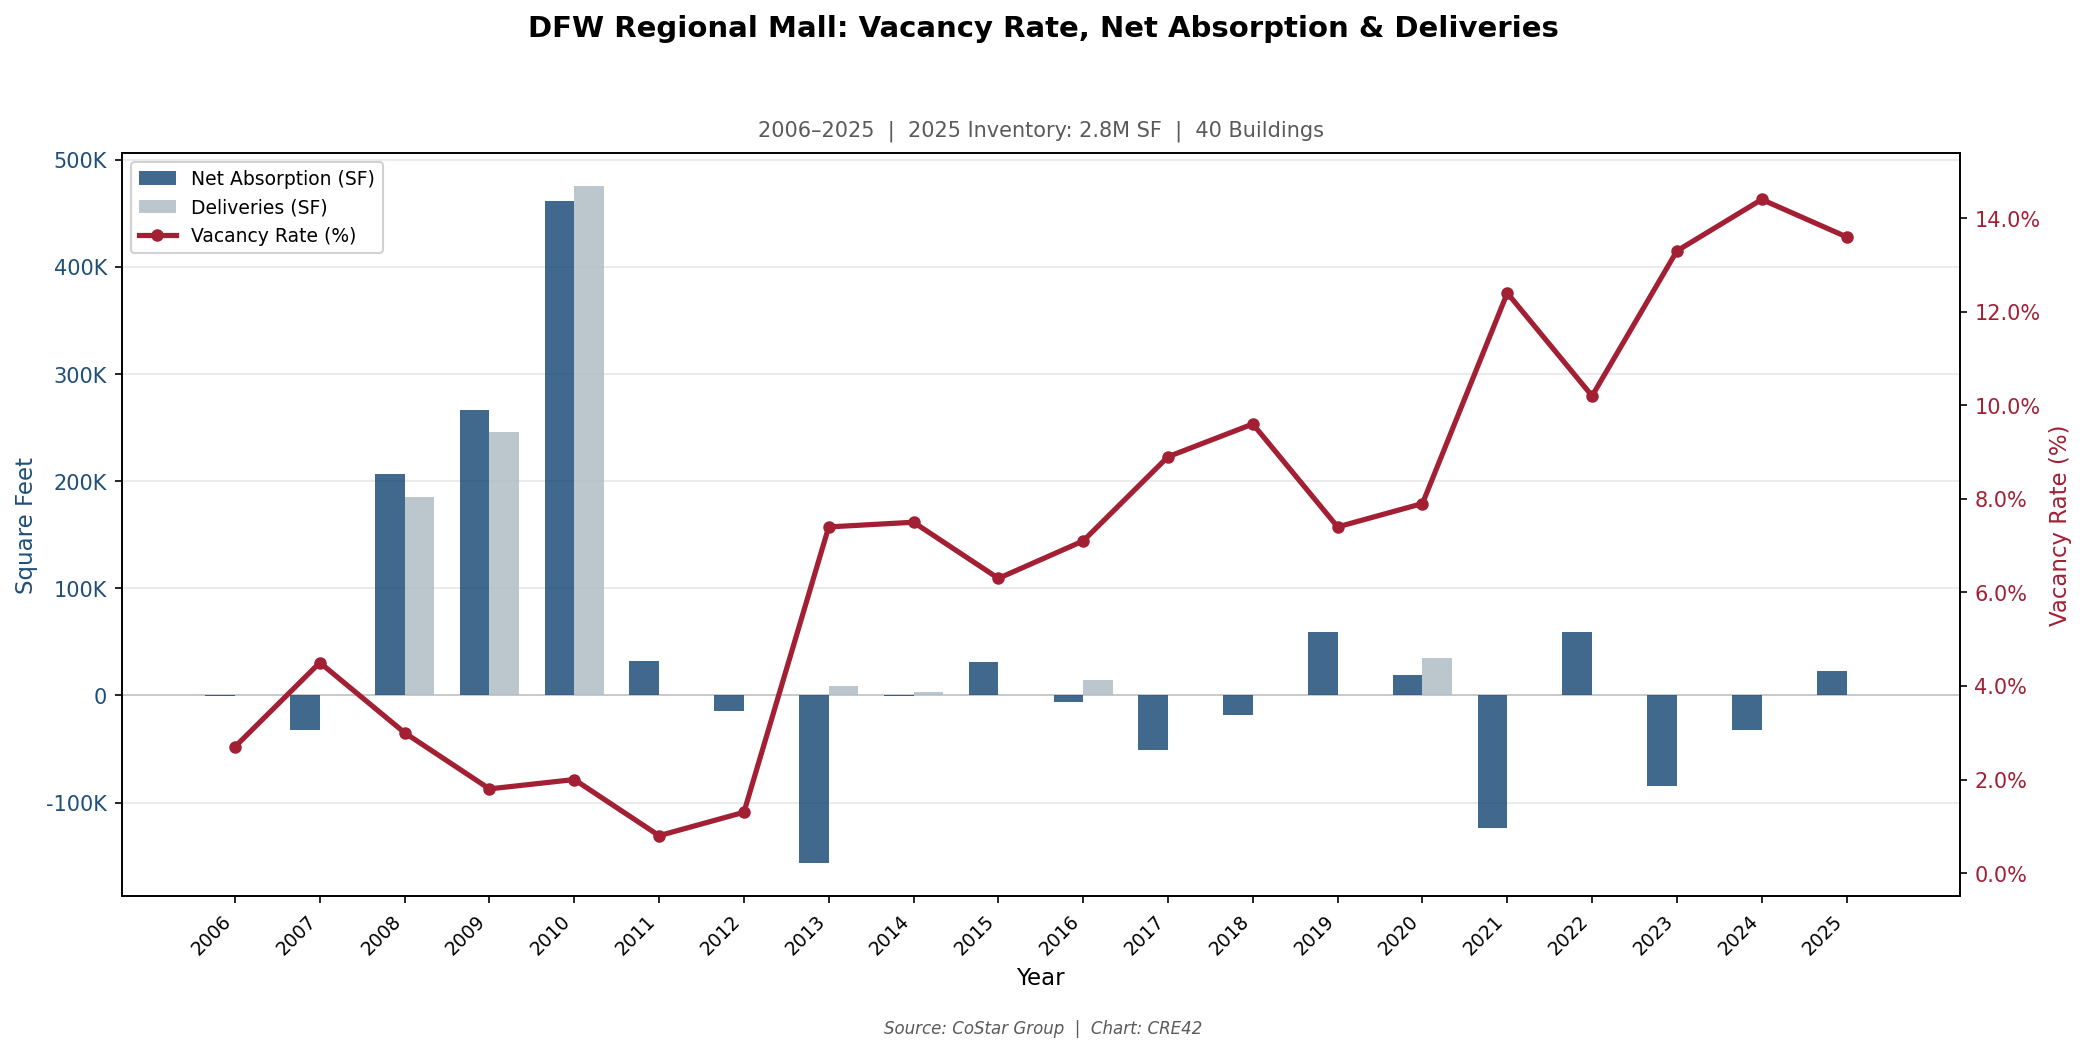
DFW MSA: Regional Mall — Vacancy Rate, Net Absorption & Deliveries, 2006–2025 | 2.8M SF, 40 Buildings | Source: CoStar Group | Chart: CRE42
Regional mall data in both markets is dominated by individual property events rather than subtype-wide trends. Chicago’s regional mall vacancy hit 0.0% in 2021 and DFW’s rose to 13.6% in 2025 — both figures that would be implausible in a larger dataset. Chicago’s 2017 vacancy spike from 1.1% to 6.7% coincides with a single 190,000 SF delivery that temporarily outpaced absorption. DFW’s 2025 spike reflects significant negative absorption (–188,000 SF) in a 2.8 million SF inventory — likely one or two properties. These charts illustrate the small-sample-size limitation described in the data note above rather than offering reliable conclusions about the regional mall format nationally.
Power Center
Power centers — open-air centers anchored by large-format retailers (Home Depot, Costco, TJX, Best Buy) — are the subtype where anchor tenant quality most directly determines vacancy trajectory. Both markets have substantial power center inventories (~33M SF each), providing a more statistically reliable sample than the mall subtypes.
Chicago: Power Center, 2006–2025
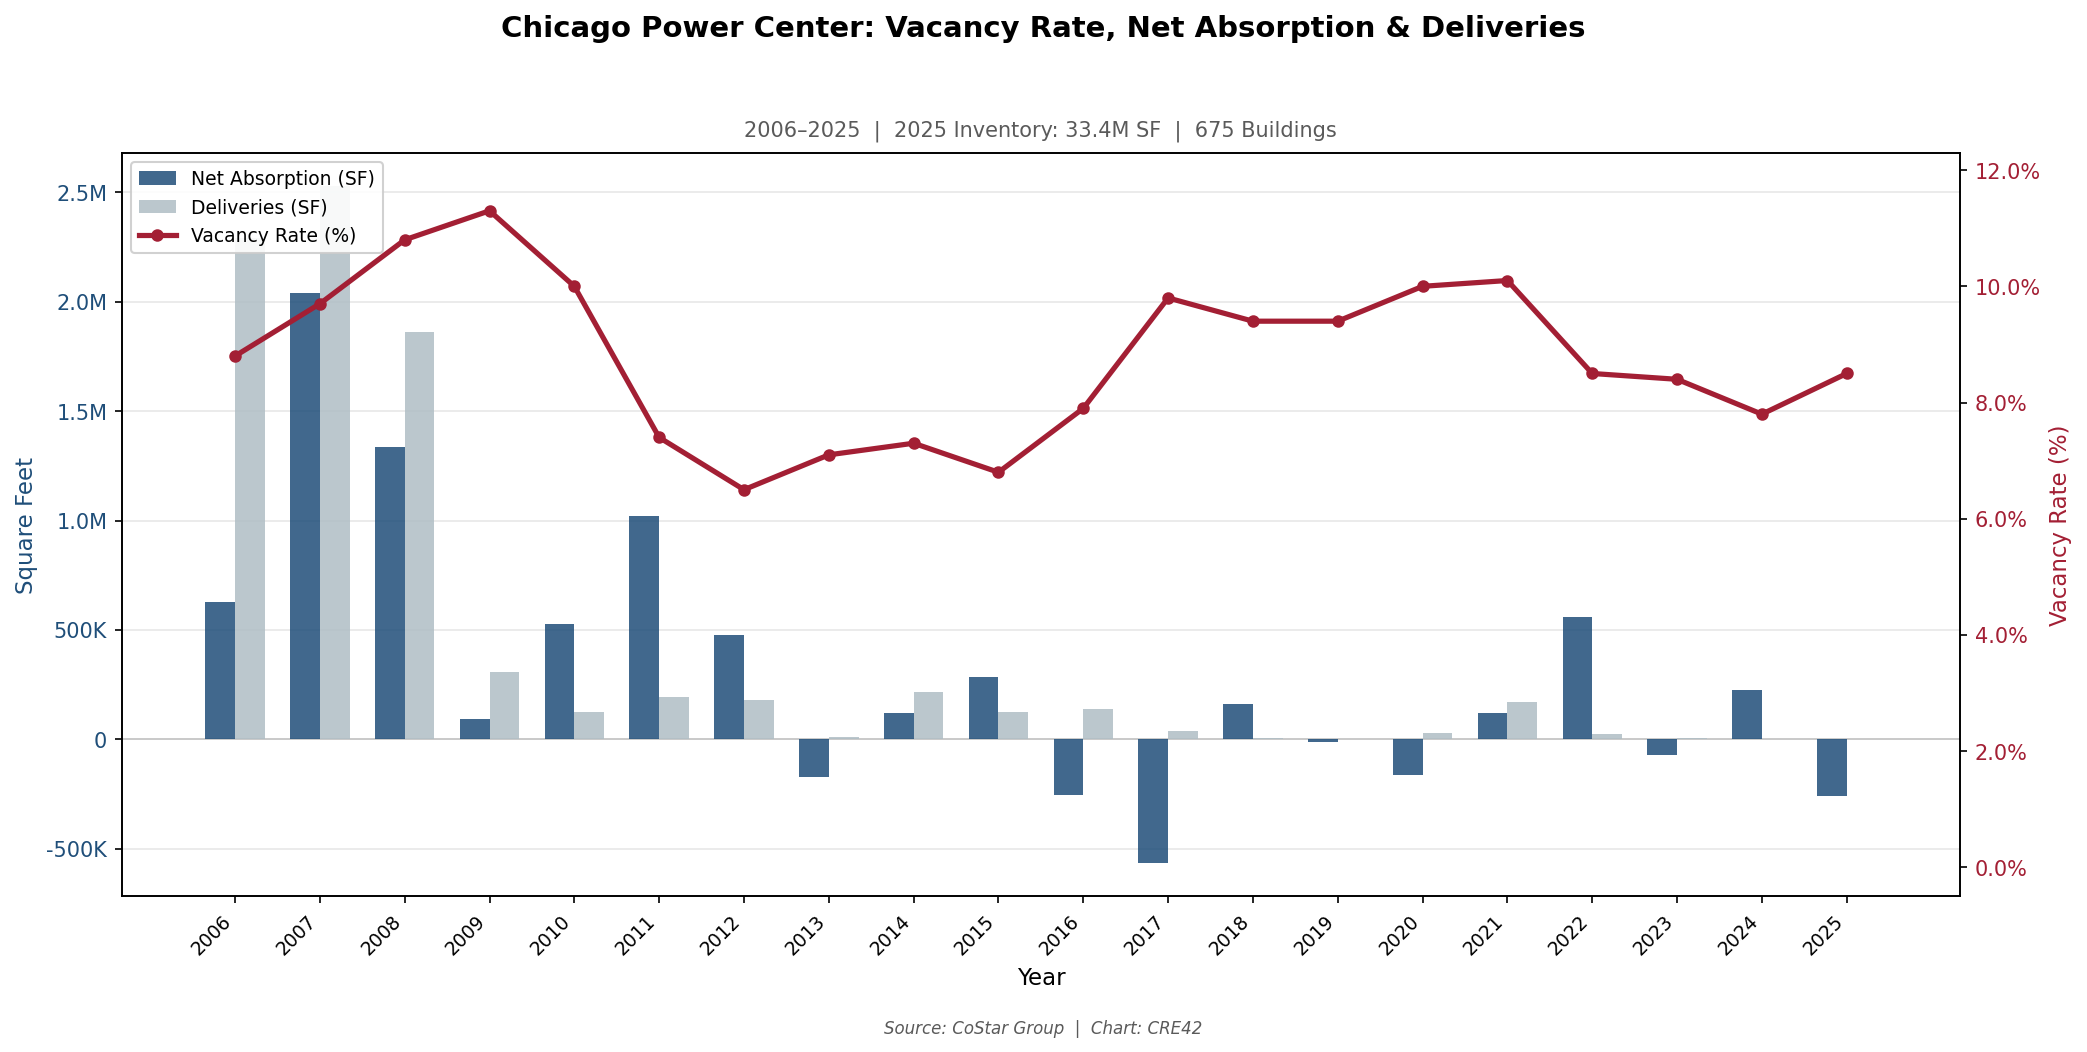
Chicago MSA: Power Center — Vacancy Rate, Net Absorption & Deliveries, 2006–2025 | 33.4M SF, 675 Buildings | Source: CoStar Group | Chart: CRE42
DFW: Power Center, 2006–2025
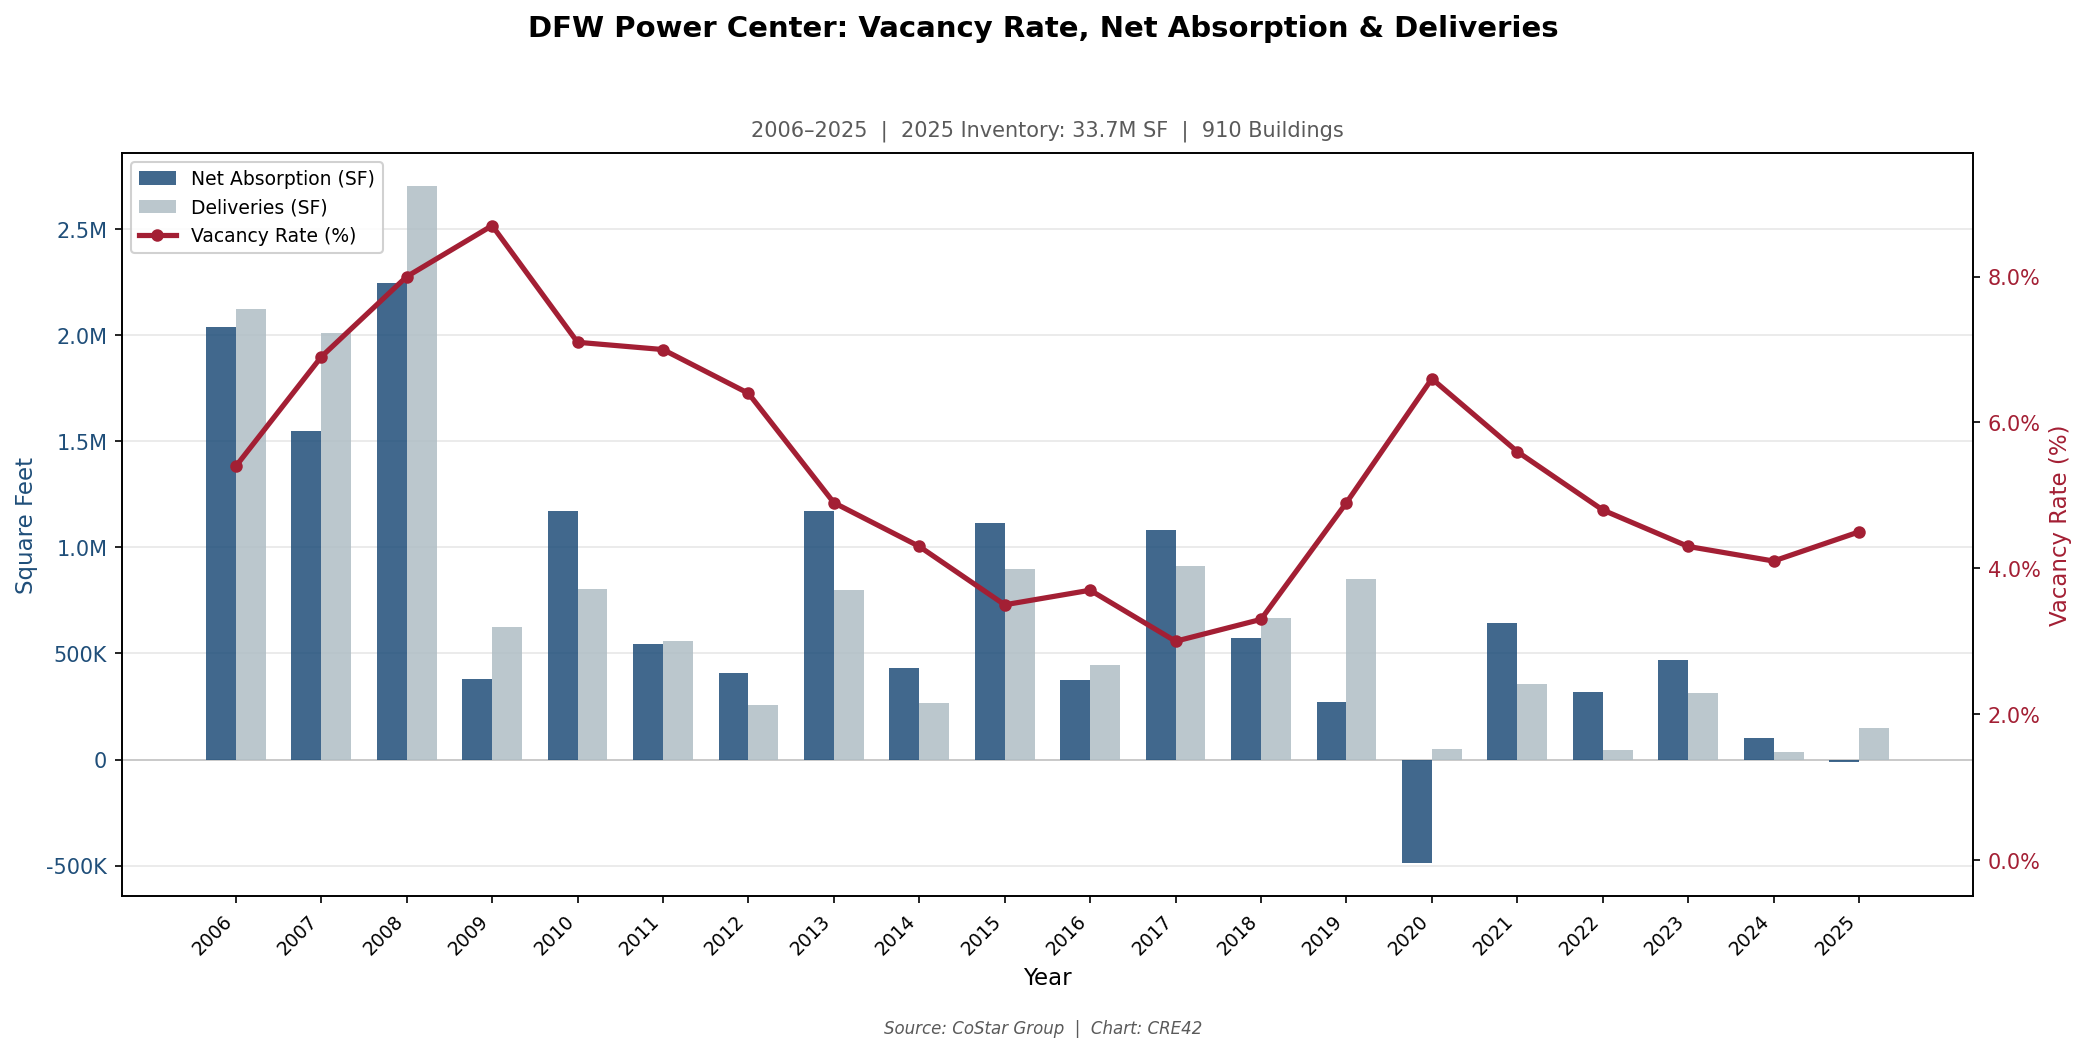
DFW MSA: Power Center — Vacancy Rate, Net Absorption & Deliveries, 2006–2025 | 33.7M SF, 910 Buildings | Source: CoStar Group | Chart: CRE42
Power centers present the clearest growth-versus-mature divergence of any subtype with a statistically meaningful sample size. DFW compressed from 9.1% vacancy (2009) to 4.5% (2025) on sustained positive absorption and minimal new supply. Chicago’s power center vacancy oscillated in a range between 6.5% and 10.1% over the full 20-year period, never achieving the sustained compression DFW experienced. The gap likely reflects anchor tenant turnover: the same national big-box closures (Sears, Kmart, Sports Authority, Bed Bath & Beyond) affected both markets, but DFW’s population growth generated replacement tenant demand that Chicago’s flat demographics could not. Chicago’s large 2006–2008 delivery cycle (2.3M, 2.5M, 1.9M SF) added supply just ahead of the recession, a timing mismatch the market spent years absorbing.
Lifestyle Center
Lifestyle centers — open-air, walkable centers oriented toward discretionary and experiential tenants — were a high-growth development format from the mid-1990s through approximately 2010. The two markets diverge sharply on current performance despite both experiencing significant inventory growth during the period.
Chicago: Lifestyle Center, 2006–2025
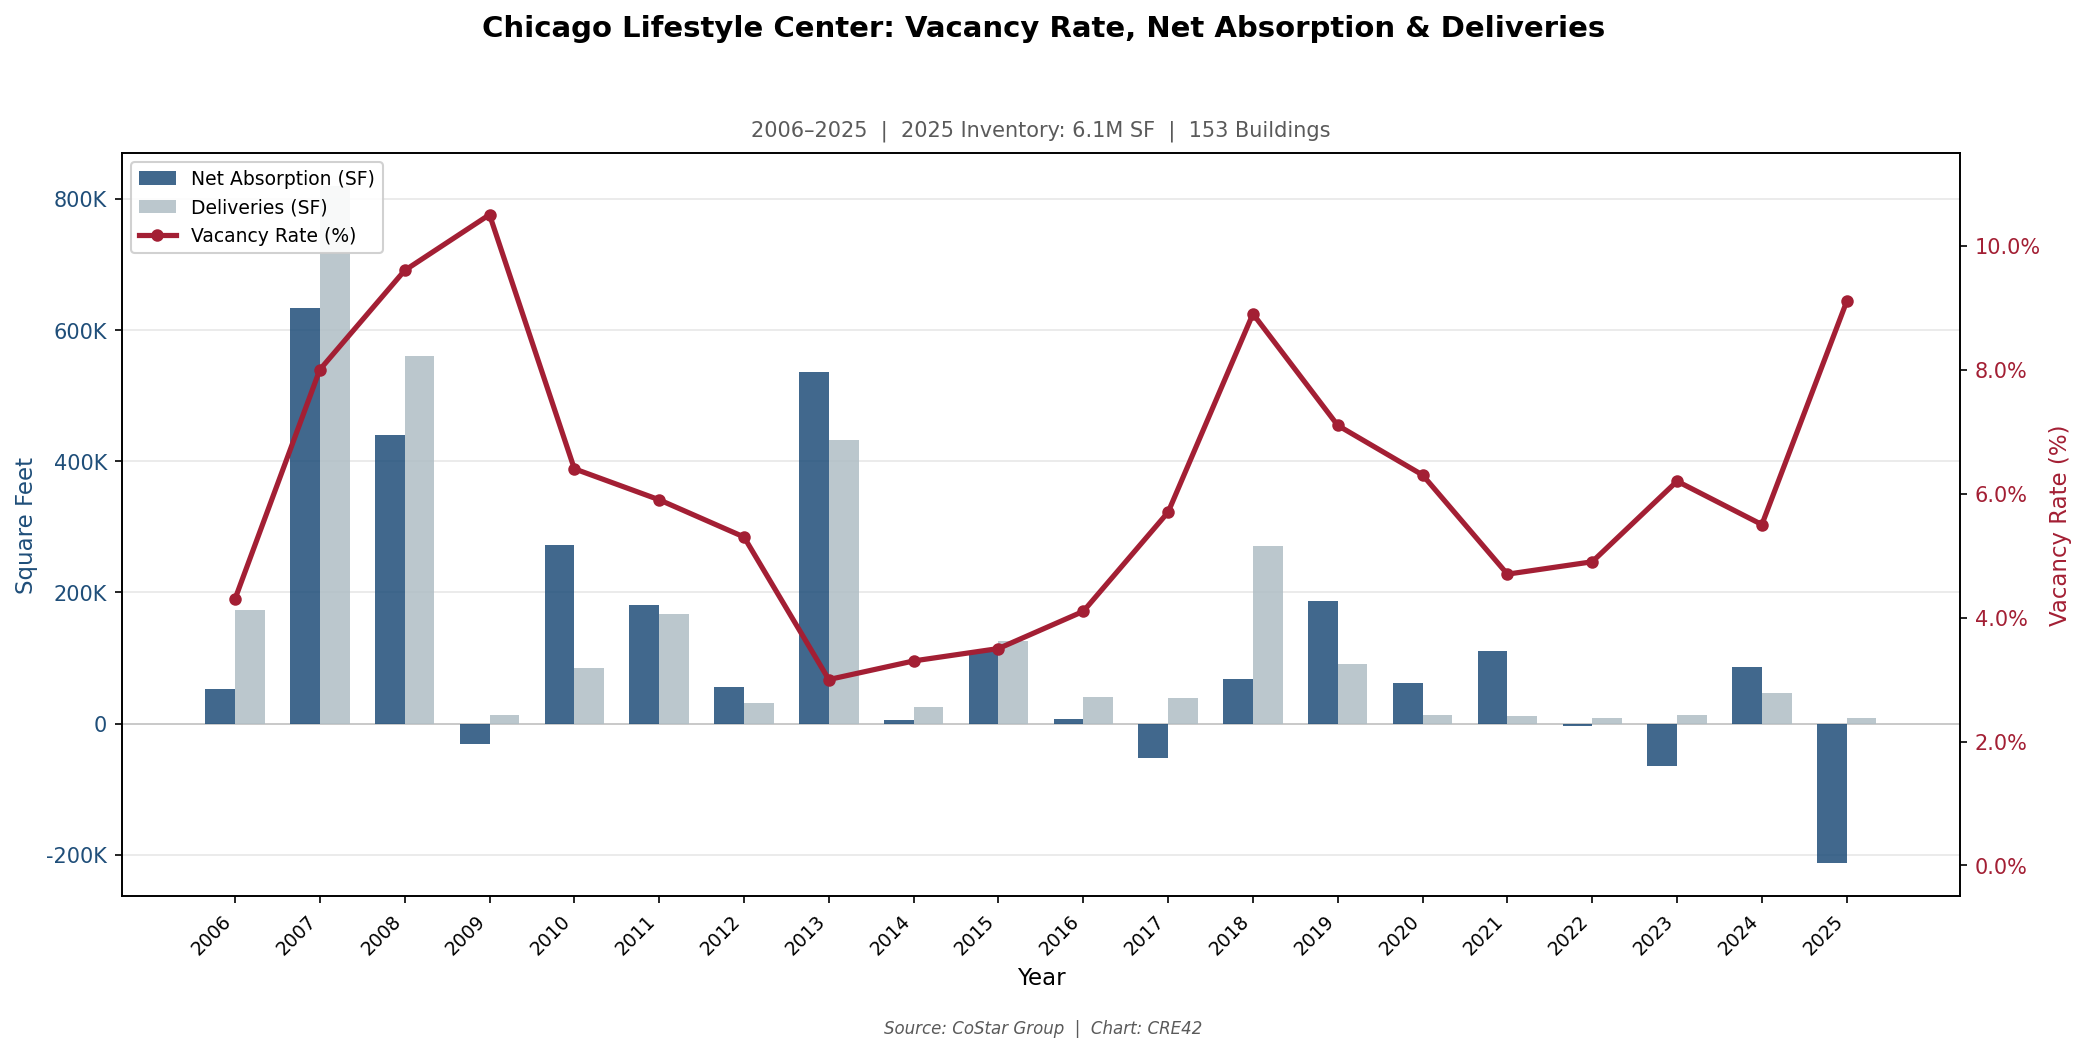
Chicago MSA: Lifestyle Center — Vacancy Rate, Net Absorption & Deliveries, 2006–2025 | 6.1M SF, 153 Buildings | Source: CoStar Group | Chart: CRE42
DFW: Lifestyle Center, 2006–2025
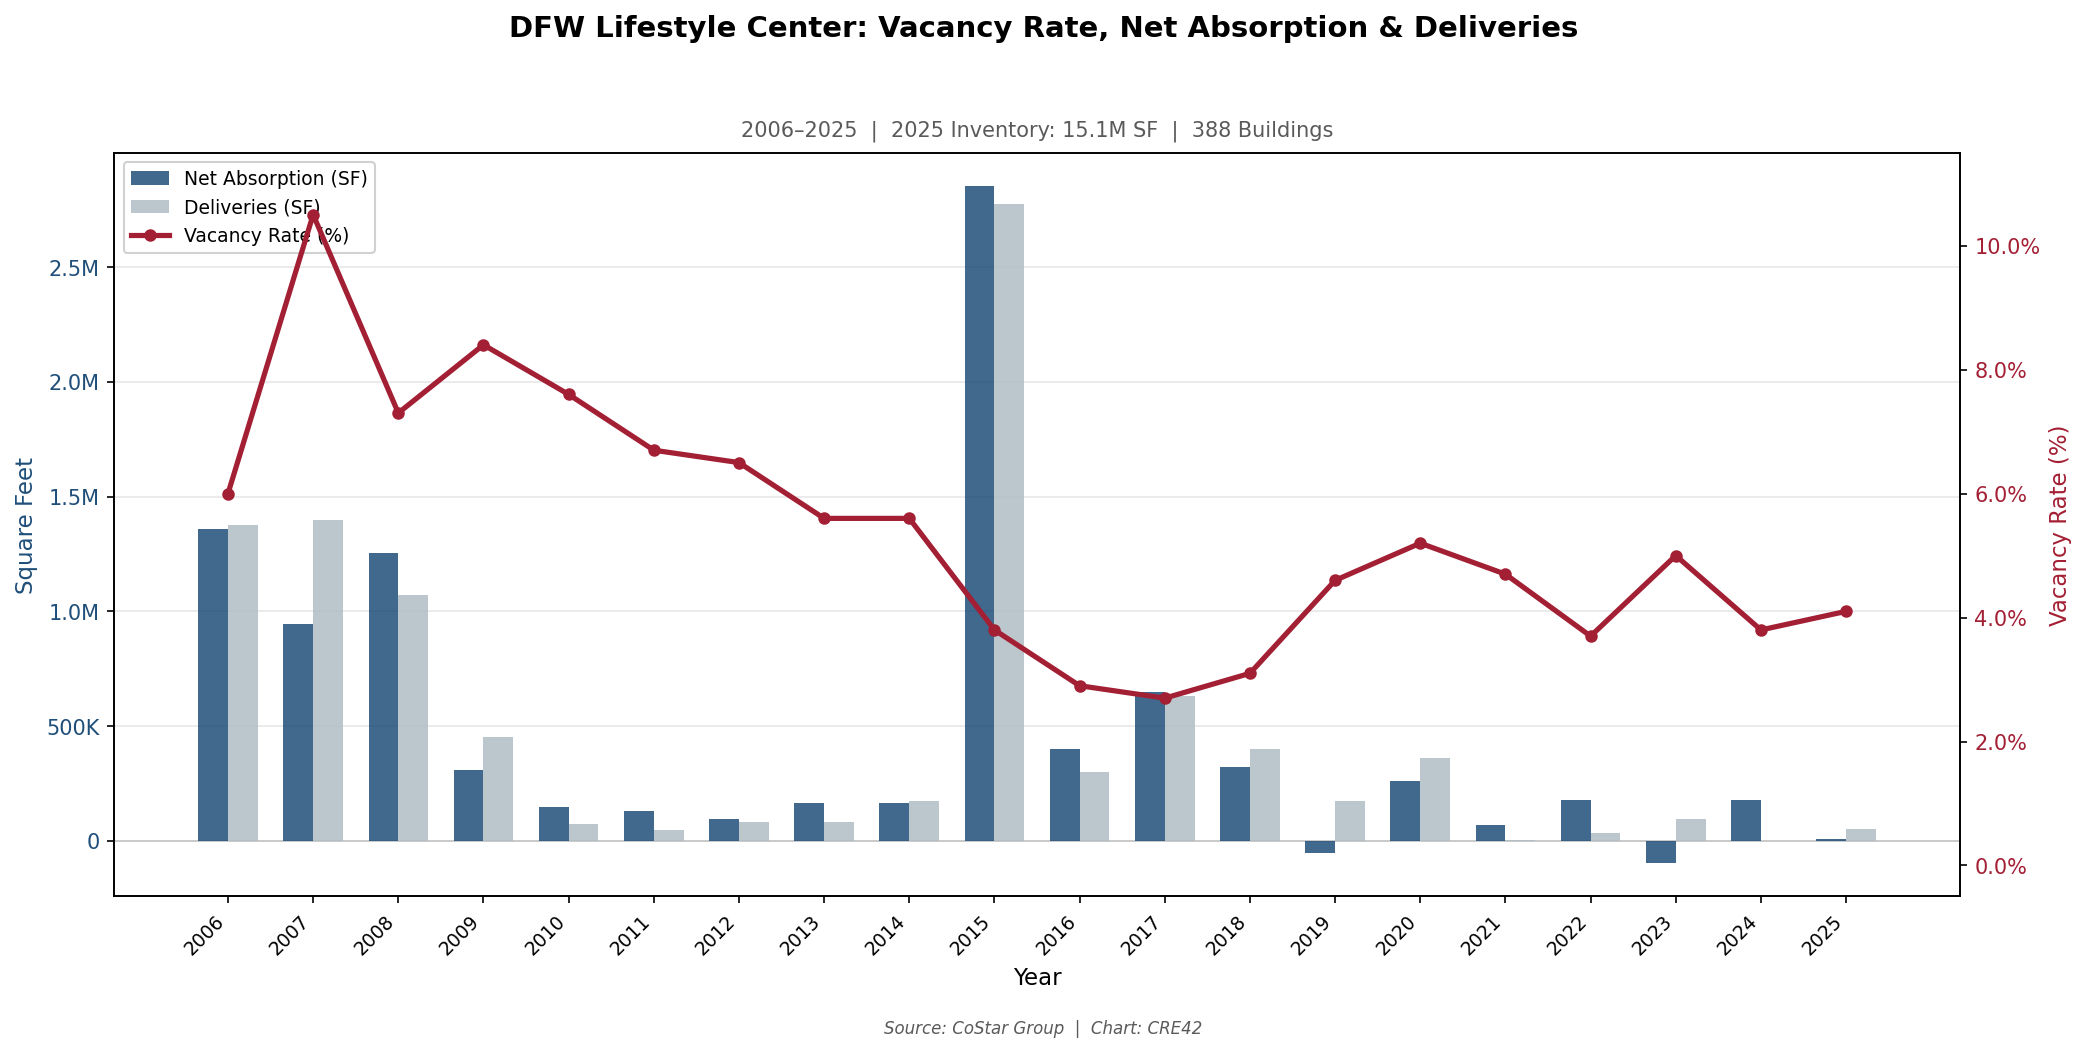
DFW MSA: Lifestyle Center — Vacancy Rate, Net Absorption & Deliveries, 2006–2025 | 15.1M SF, 388 Buildings | Source: CoStar Group | Chart: CRE42
Chicago’s lifestyle center inventory nearly doubled from 3.3 million SF (2006) to 6.1 million SF (2025), with the heaviest construction concentrated between 2007 and 2013 (approximately 2.1 million SF delivered). Vacancy was low through that expansion — reaching a trough of 3.0% in 2013 — as absorption kept pace with supply. The subsequent deterioration to 9.1% (2025) came with negligible new deliveries; the –212,000 SF net absorption in 2025 and –64,000 SF in 2023 represent tenant departures from existing inventory, not an oversupply condition. DFW, by contrast, built 2.5 times more lifestyle center inventory (from 5.0M to 15.1M SF) and achieved a tighter vacancy rate (4.1%). The difference may reflect trade area household income dynamics, tenant mix resilience, or MSA-specific factors that cannot be isolated in this dataset.
Strip Center
Strip centers — small open-air centers, typically unanchored or with minor anchors — are the most numerous retail subtype by building count in both markets. CoStar’s strip center classification includes both anchored and unanchored product, so it is an imperfect proxy for the “unanchored strips” category discussed on the Format Divergence page.[4]
Chicago: Strip Center, 2006–2025
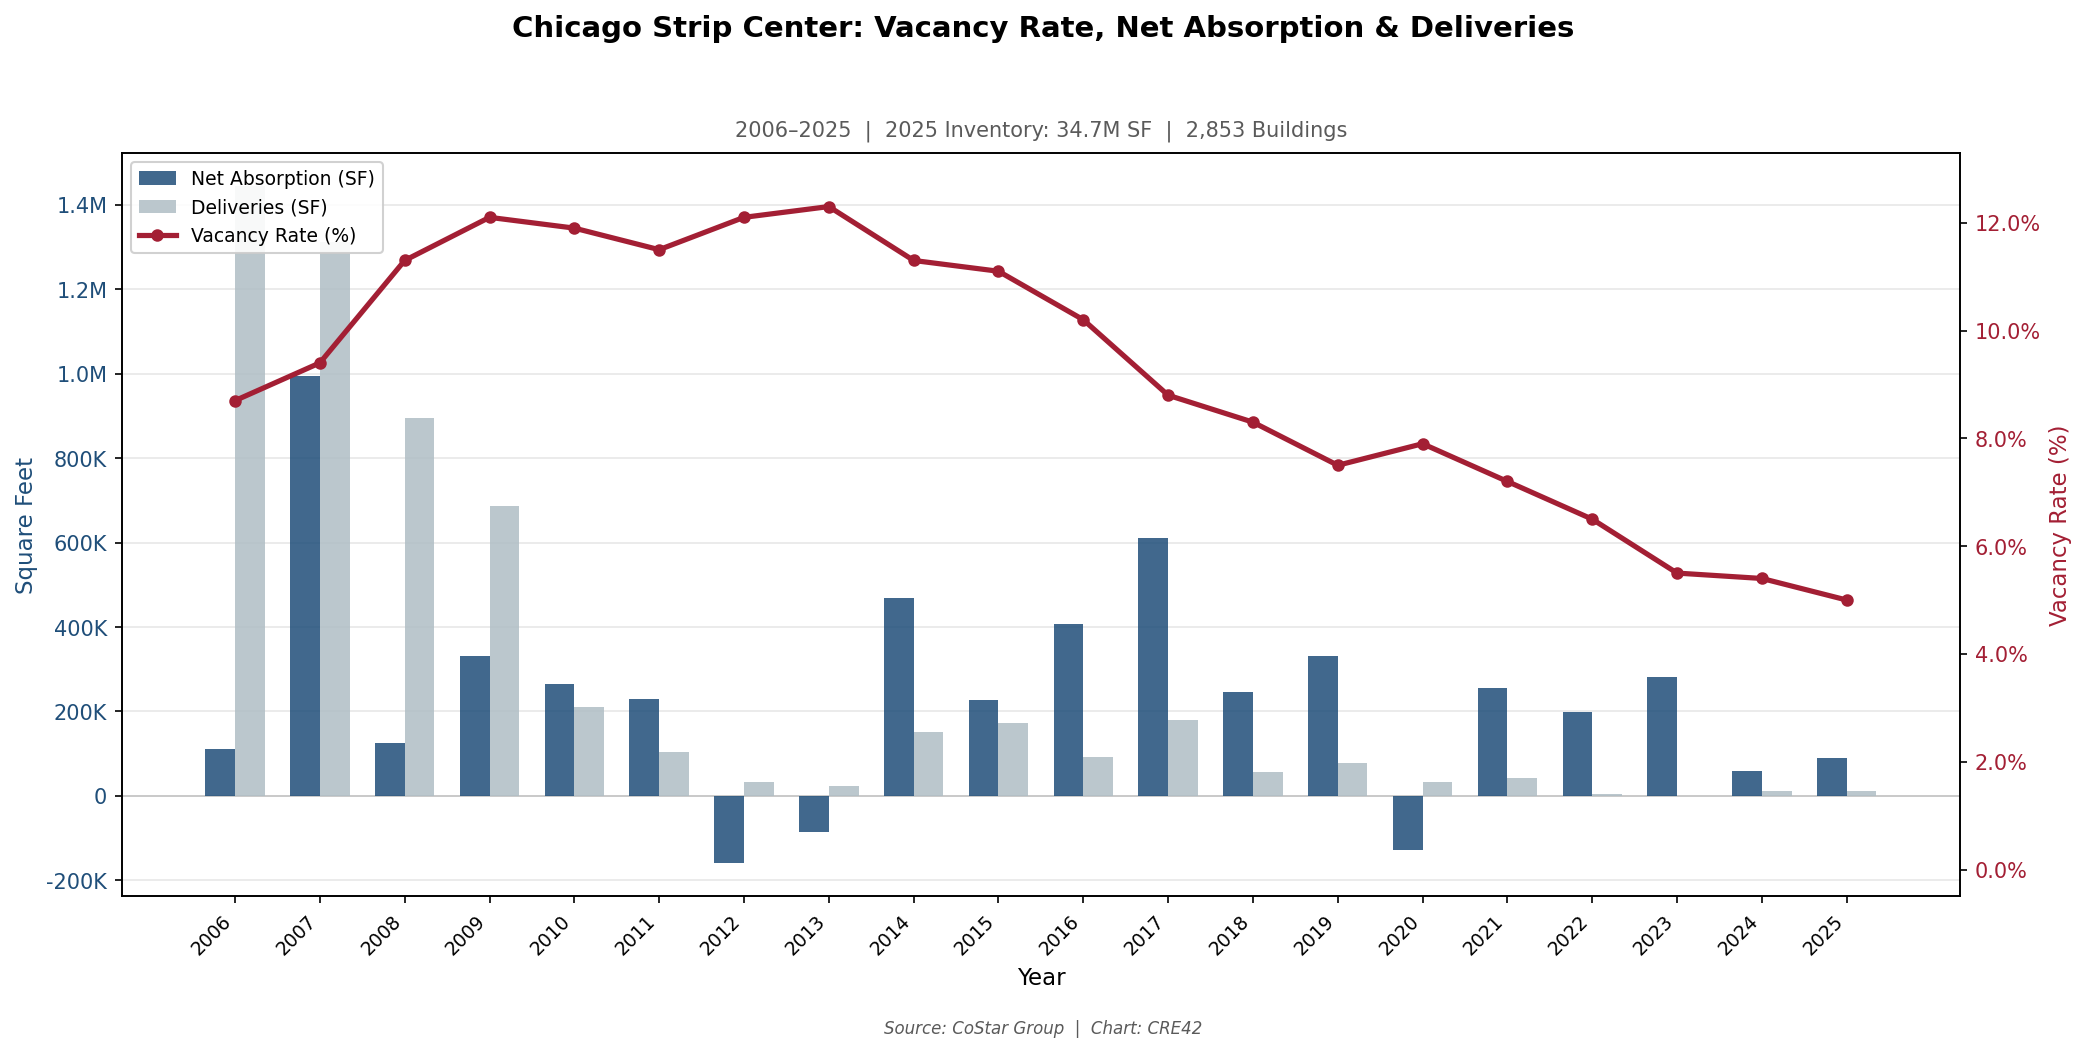
Chicago MSA: Strip Center — Vacancy Rate, Net Absorption & Deliveries, 2006–2025 | 34.7M SF, 2,853 Buildings | Source: CoStar Group | Chart: CRE42
DFW: Strip Center, 2006–2025
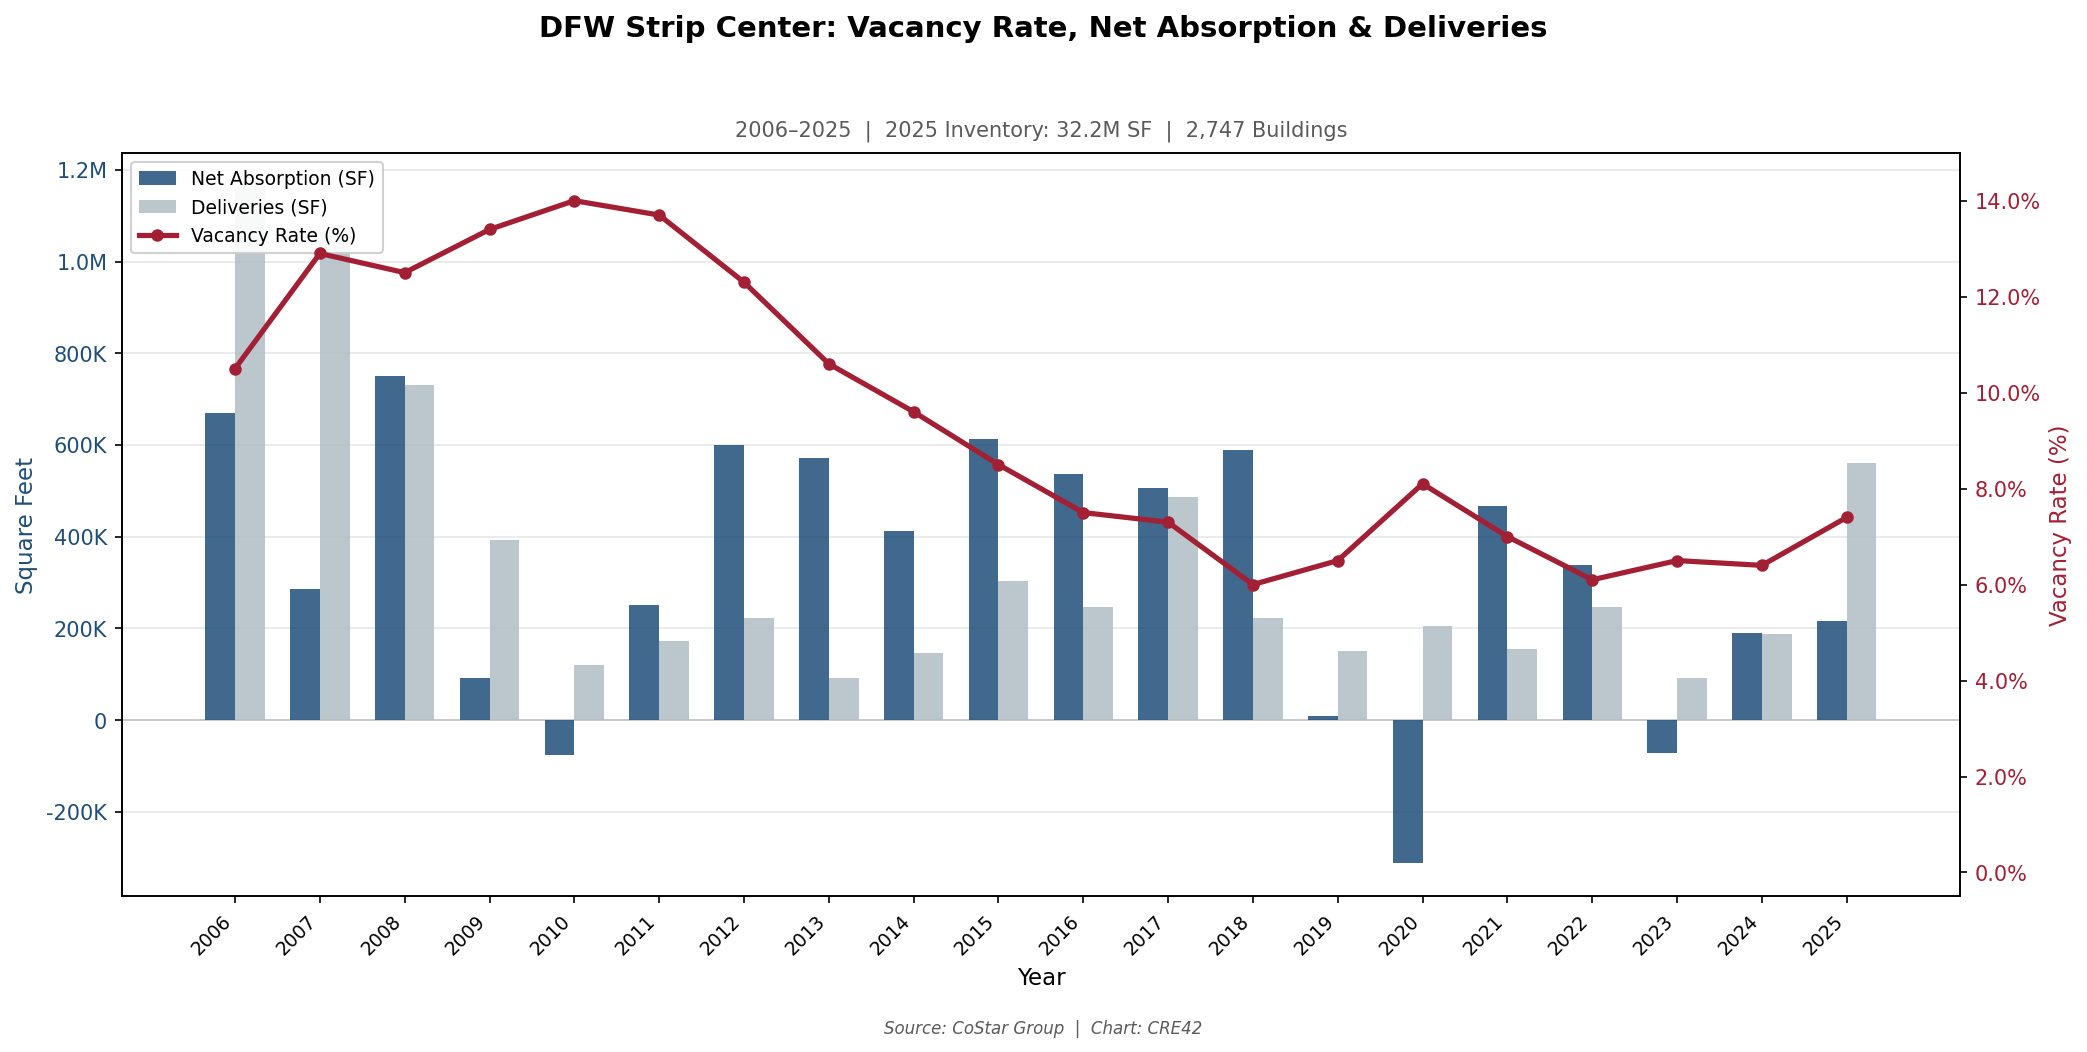
DFW MSA: Strip Center — Vacancy Rate, Net Absorption & Deliveries, 2006–2025 | 32.2M SF, 2,747 Buildings | Source: CoStar Group | Chart: CRE42
Strip centers show the most consistent vacancy compression of any subtype in both markets, and the trajectories are remarkably parallel despite different growth dynamics. Both markets experienced a massive mid-2000s construction cycle (Chicago delivered 1.4M SF in 2006 alone; DFW delivered 1.6M SF) that pushed vacancy above 11% by 2009–2013. As deliveries dropped to near zero in Chicago and to low levels in DFW, steady positive absorption compressed vacancy over a decade. Chicago’s 5.0% endpoint is 2.4 points tighter than DFW’s 7.4%, a reversal of the pattern in most other subtypes where DFW outperforms. This may reflect the near-complete absence of new strip center construction in Chicago — delivering just 11,300 SF in 2025 versus DFW’s 199,000 SF — giving the mature market’s existing inventory pricing power that the growth market’s ongoing supply tempers.
Neighborhood Center
Neighborhood centers — multi-tenant centers typically anchored by a supermarket or drugstore — are the largest retail subtype by square footage in both markets. CoStar’s neighborhood center classification is the closest available proxy for the “grocery-anchored” format discussed on the Format Divergence page, though the category includes non-grocery-anchored centers and therefore overstates vacancy relative to a pure grocery-anchored filter.[5]
Chicago: Neighborhood Center, 2006–2025
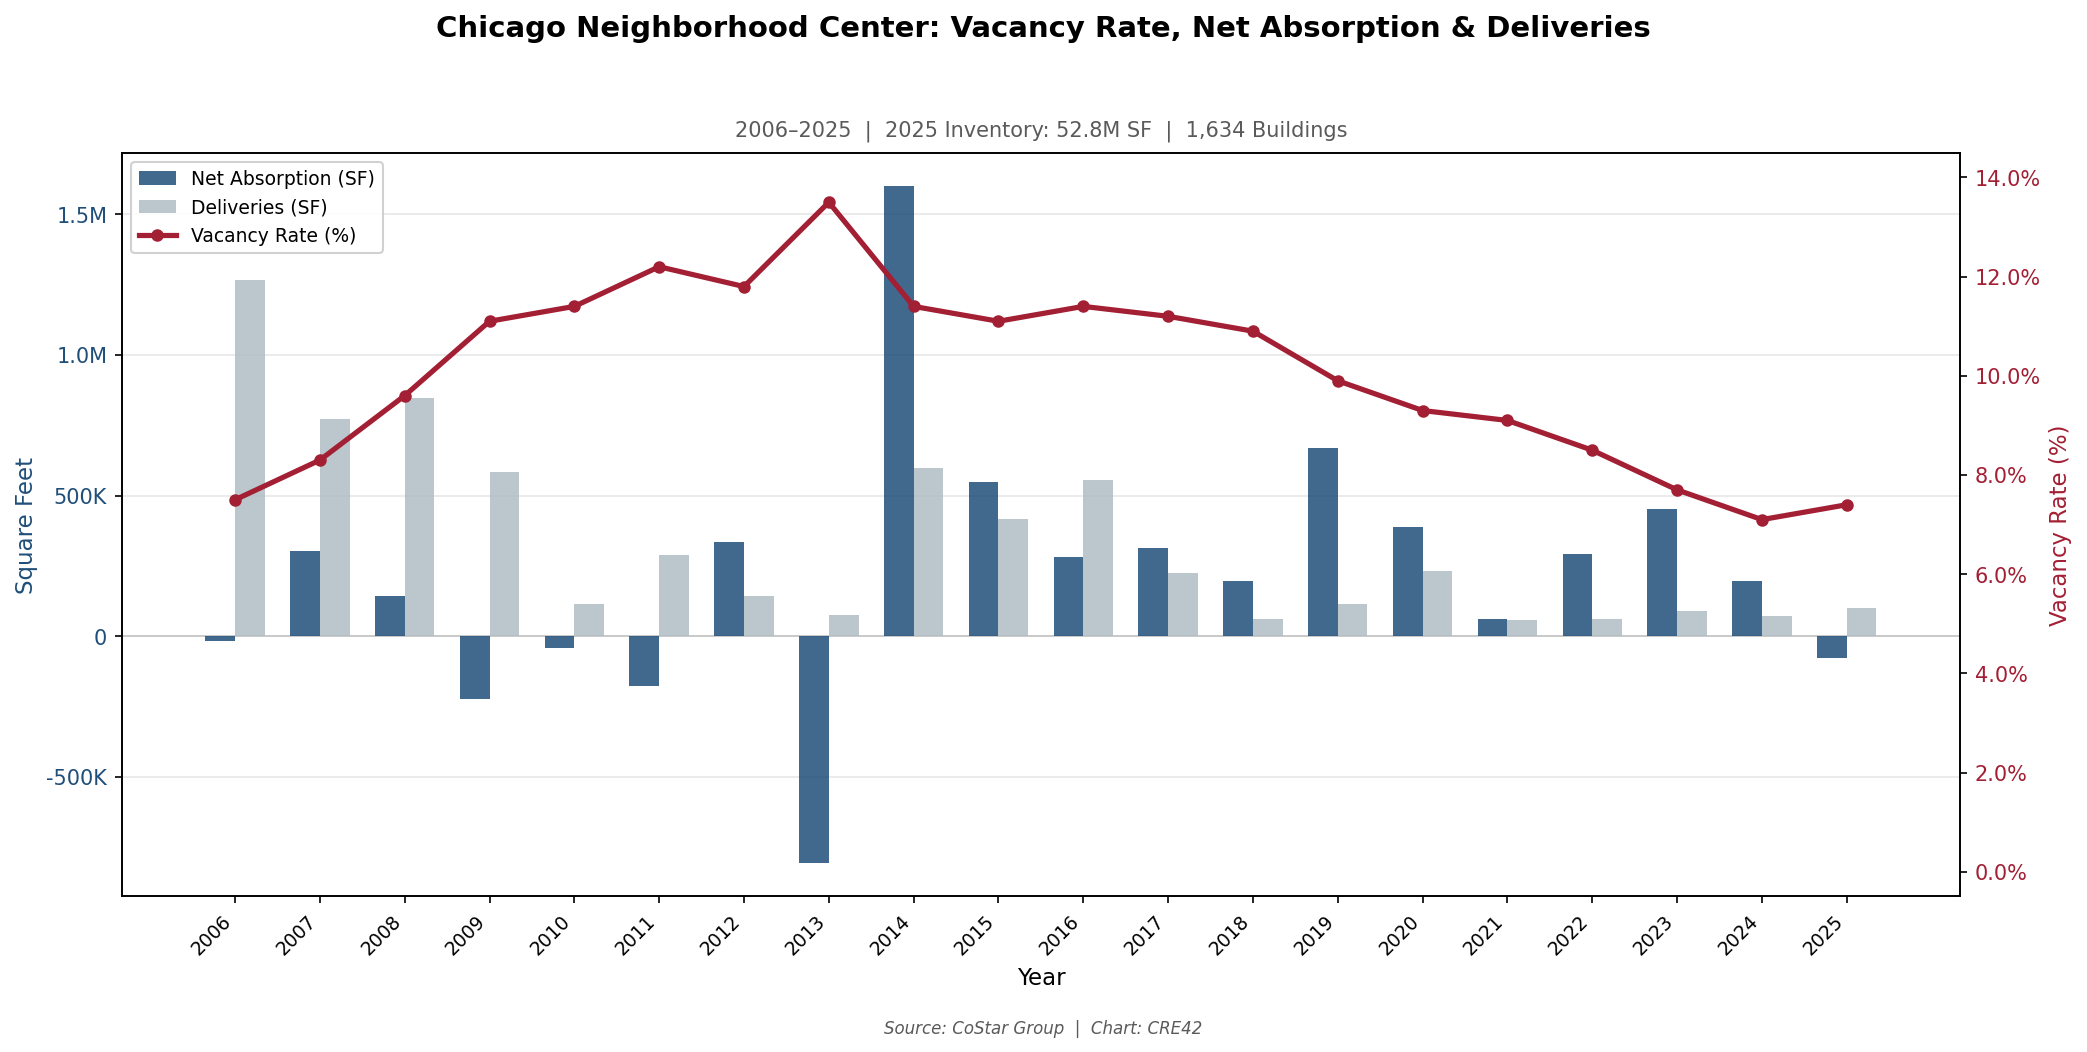
Chicago MSA: Neighborhood Center — Vacancy Rate, Net Absorption & Deliveries, 2006–2025 | 52.8M SF, 1,634 Buildings | Source: CoStar Group | Chart: CRE42
DFW: Neighborhood Center, 2006–2025
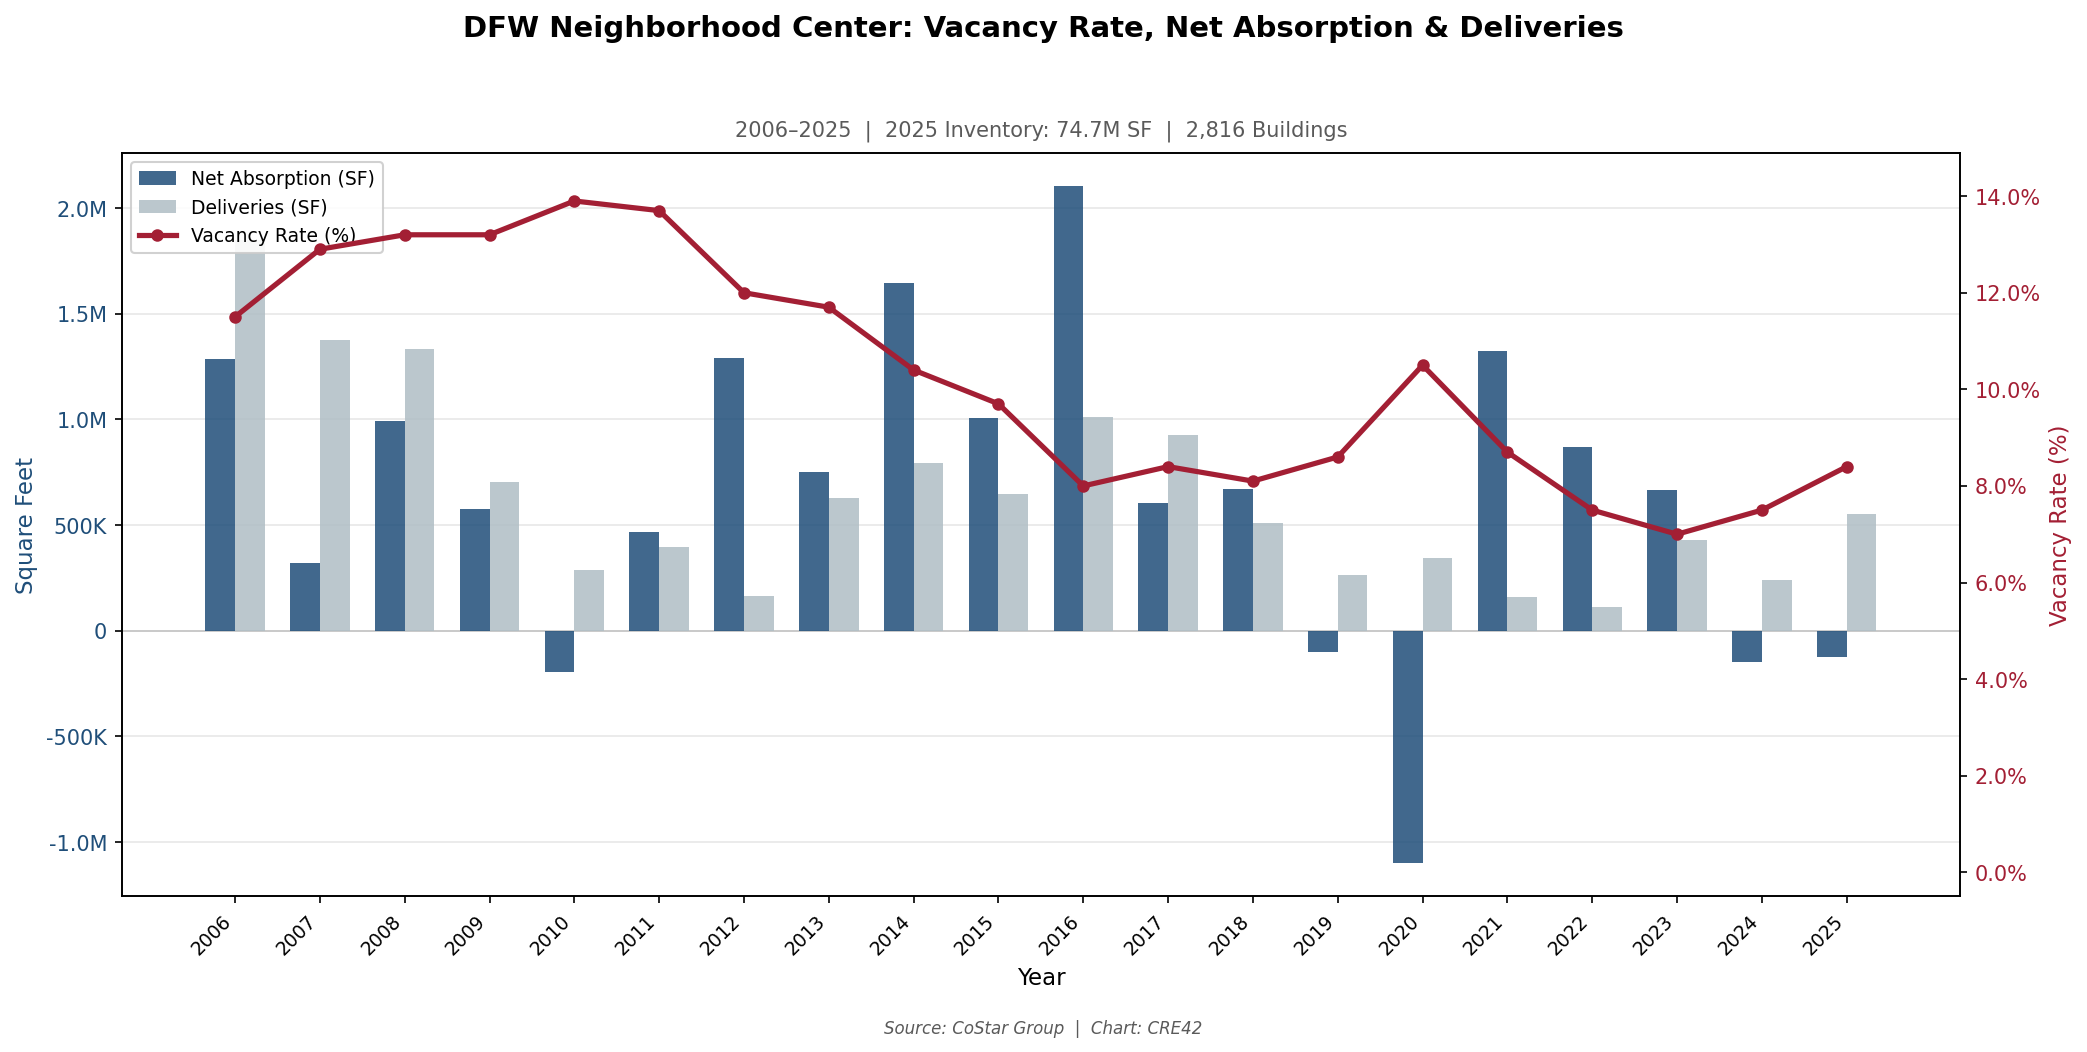
DFW MSA: Neighborhood Center — Vacancy Rate, Net Absorption & Deliveries, 2006–2025 | 74.7M SF, 2,816 Buildings | Source: CoStar Group | Chart: CRE42
Neighborhood centers present the same pattern as strip centers: Chicago ends tighter (7.4%) than DFW (8.4%) despite lower population growth, likely because DFW continued delivering substantial new supply throughout the period. DFW’s neighborhood center inventory grew from 49.8 million SF to 74.7 million SF (+50%), the largest absolute and percentage inventory increase of any subtype in either market. Chicago’s inventory grew more modestly (48.1M to 52.8M SF, +10%), and the 1.6 million SF of net absorption in 2014 — the single largest absorption year for any subtype in either market — drove a rapid vacancy drop from 13.5% (2013) to 11.4% (2014). Whether that 2014 spike represents a grocery chain expansion, a reclassification event, or a data revision is not determinable from the aggregate data.
Context & Discussion
What the Data Shows and What It Does Not
This page presents two MSA-level case studies, not a national analysis. Chicago and DFW were selected because they represent opposite ends of the U.S. metro growth spectrum and because both have deep, liquid retail markets with sufficient inventory to generate meaningful subtype-level data. Conclusions drawn from these two markets may or may not generalize to other metros with similar growth profiles. A mature Northeast metro (e.g., Philadelphia, Boston) may not resemble Chicago’s retail subtype mix. A Sun Belt growth market (e.g., Phoenix, Austin) may have different timing, tenant mix, and land cost dynamics than DFW. The reader should compare and contrast using the research tools available — including CoStar, brokerage reports, and Census population data — to form conclusions about specific markets, submarkets, and micromarkets.[6]
Growth vs. Mature: The Supply-Absorption Dynamic
The most consistent finding across subtypes is that population growth is the primary determinant of whether a market achieves vacancy compression through demand (absorption exceeding supply) or through supply discipline (deliveries falling to near zero). DFW built 37 million SF of new retail inventory from 2006 to 2025 and compressed vacancy from 10.8% to 7.0%; Chicago built 17 million SF and compressed from 9.4% to 7.7%. The growth market ended tighter despite adding more than twice the supply. In individual subtypes, this pattern holds for power centers, lifestyle centers, and the all-subtypes composite, but reverses for strip centers and neighborhood centers, where Chicago’s near-cessation of construction produced tighter vacancy than DFW’s ongoing development. Format-level conclusions depend on both MSA growth dynamics and subtype-specific supply cycles.[1]
What to Watch in 2026
Both markets showed signs of softening in 2025: Chicago posted –709,000 SF of combined net absorption and DFW posted –15,000 SF, the weakest absorption figures since COVID. Whether this reflects a cyclical pause, the lagged effect of elevated interest rates on tenant expansion, or an early signal of structural demand shifts will become clearer as 2026 data emerges.
Sources to Track Retail Subtype Performance in 2026:
| Source | Next Release | Date | Notes |
|---|---|---|---|
| CoStar Group | Q1 2026 MSA subtype data | Expected April 2026 | First full-quarter read on whether 2025 absorption weakness extends into 2026; filter by subtype at MSA level. |
| U.S. Census Bureau MRTS | February 2026 Advance Retail Sales | March 2026 (released) | Tenant-category sales data; tracks department stores, grocery, restaurants by NAICS code. |
| CBRE / JLL / C&W | Q1 2026 U.S. Retail Market Reports | Expected April–May 2026 | National and MSA-level vacancy, absorption, and rent trends by format; useful for benchmarking CoStar data. |
| NCREIF Property Index (NPI) | Q4 2025 Retail Returns by Subtype | Expected March 2026 | Shopping center vs. regional mall vs. freestanding total returns; tracks investor-level format divergence. |
Notes
[1] CoStar Group. Chicago MSA and Dallas–Fort Worth MSA retail subtype data: Super Regional Mall, Regional Mall, Power Center, Lifestyle Center, Strip Center, Neighborhood Center. Annual data, 2006–2025. Accessed March 2026. costar.com ↩
[2] CoStar Group. Property Type Definitions & Subtype Classification Methodology. CoStar categorizes retail properties into 18 subtypes by building form. Subtype reclassification occurs when a property undergoes physical redevelopment or change of use; properties in functional decline but not yet redeveloped remain in their original subtype classification. ↩
[3] Sample size note: Chicago Regional Mall comprises 32 buildings totaling 2.9M SF; DFW Regional Mall comprises 40 buildings totaling 2.8M SF. Individual property events (single anchor departures, lease-ups, or redevelopments) can move subtype-level vacancy by several percentage points in a single year. ↩
[4] CoStar’s “Strip Center” subtype includes both anchored and unanchored small open-air centers. It is an imperfect proxy for the “unanchored strips” category discussed on the Retail Format Divergence page. ↩
[5] CoStar’s “Neighborhood Center” subtype includes centers with various anchor types, not exclusively grocery. It is an imperfect proxy for the “grocery-anchored neighborhood center” category. Vacancy for pure grocery-anchored centers would likely be lower than the neighborhood center average shown here. ↩
[6] CoStar MSA-level subtype data is available to subscribers. Brokerage firms (CBRE, JLL, Cushman & Wakefield, Colliers) publish quarterly retail market reports with subtype-level data for major MSAs. Census Bureau population estimates by MSA are available at census.gov. ↩
Methodology & Data Notes
Data Source & Period
All data is sourced from CoStar Group, accessed March 2026. The analysis period is 2006–2025 (annual). The DFW dataset extends to 2000 in the source file; years prior to 2006 are excluded to maintain consistency with the Chicago dataset, which begins in 2006.
Vacancy Metric
Vacancy is reported as “Vacant Percent % Total,” which combines direct vacancy and sublease vacancy. This is consistent with the total vacancy metric used throughout CRE42.
SF-Weighted Composite Calculation
The “All Subtypes Combined” vacancy rate is calculated as total vacant square feet divided by total inventory square feet across all six subtypes in each year. This SF-weighted approach means larger-inventory subtypes (neighborhood centers, strip centers) dominate the composite rate. Net absorption and deliveries in the composite are simple sums across all six subtypes.
Rent Data Exclusion
CoStar provides both NNN Rent and All Service Type Rent fields. These are excluded from the analysis because mall subtypes (Regional Mall, Super Regional Mall) contain significant gaps and zero values, particularly from 2020 to 2023, making cross-subtype and cross-market trend comparisons unreliable. Open-air subtypes (Strip Center, Neighborhood Center, Power Center) have more complete rent data; readers with CoStar access may find subtype-level rent trends informative for those formats individually.
CoStar Subtype Classification
CoStar classifies retail properties into 18 subtypes based on building form and scale, not on tenant mix, lease structure, or anchor type. A neighborhood center is classified by its physical characteristics regardless of whether it has a grocery anchor. A dying mall remains classified as a super regional mall until it is physically demolished or redeveloped. This means subtype-level data may include properties whose current economic function differs from the subtype label, particularly at the distressed end of the spectrum.
CoStar Subtype to Format Divergence Category Mapping
| Format Divergence Category | CoStar Subtype Proxy | Proxy Quality |
|---|---|---|
| Enclosed Malls | Super Regional Mall; Regional Mall (shown separately) | Good — direct match by building form |
| Power Centers | Power Center | Good — direct match |
| Lifestyle Centers | Lifestyle Center | Good — direct match |
| Grocery-Anchored | Neighborhood Center | Approximate — includes non-grocery anchors |
| Unanchored Strips | Strip Center | Approximate — includes some anchored product |
| Single-Tenant / NNN | No CoStar subtype equivalent | Not available |
| Urban / High Street | No CoStar subtype equivalent | Not available |
Limitations
CoStar MSA boundaries may differ from Census Bureau MSA definitions. Building counts and inventory totals are point-in-time snapshots and can change as properties are added, removed, or reclassified. Small-inventory subtypes (Regional Mall in both markets) are subject to extreme volatility from individual property events. This analysis covers two MSAs and six of 18 CoStar subtypes; results should not be extrapolated to national conclusions or to the 12 subtypes not analyzed.