▸ THIS SECTION INCLUDES PROPRIETARY DATA AND IS NOT AVAILABLE FOR PUBLIC USE
Overview
Retail construction followed a different post-pandemic path than other asset types like multifamily and industrial. While those sectors experienced national supply booms, retail construction remained muted—constrained by capital allocation to other sectors, the retail apocalypse narrative hangover, elevated construction costs, high interest rates, and an increasing relative scarcity of prime sites. Vacancy and availability fell and remained low (both currently under 5%) due to resilient demand and reduced new supply as customers remain generally more committed to in-person shopping than many had predicted.
The three charts below illustrate the general trends seen in growth markets vs. mature markets over the last 20 years, using groups of five MSAs for each group, selected to be representative of the larger group of growing metros, mostly in the south and mature cities located on the coasts plus Chicago.
Growth MSAs: Austin, Dallas-Fort Worth, Phoenix, Tampa, Nashville
Mature MSAs: New York City, Boston, Chicago, Los Angeles, San Francisco
The supply growth spurt of the mid-to-late 2000’s was a national dynamic but was more prominent in the growth metros, reaching an average five-city blend of almost 4% of then-current inventory in 2007. Rapid supply delivery led to a rise to almost 9% vacancy by 2010 followed by a period of reduced supply, consistent absorption and falling vacancy through the current day (with a few blips and bumps along the way including the pandemic).
Document Links
retail-growth-vs-mature.xlsx — CoStar historical annual data (2006–2025), growth vs. mature city comparison, national retail cross-asset analysis
Retail Vacancy & Construction Rate — Growth vs. Mature Markets
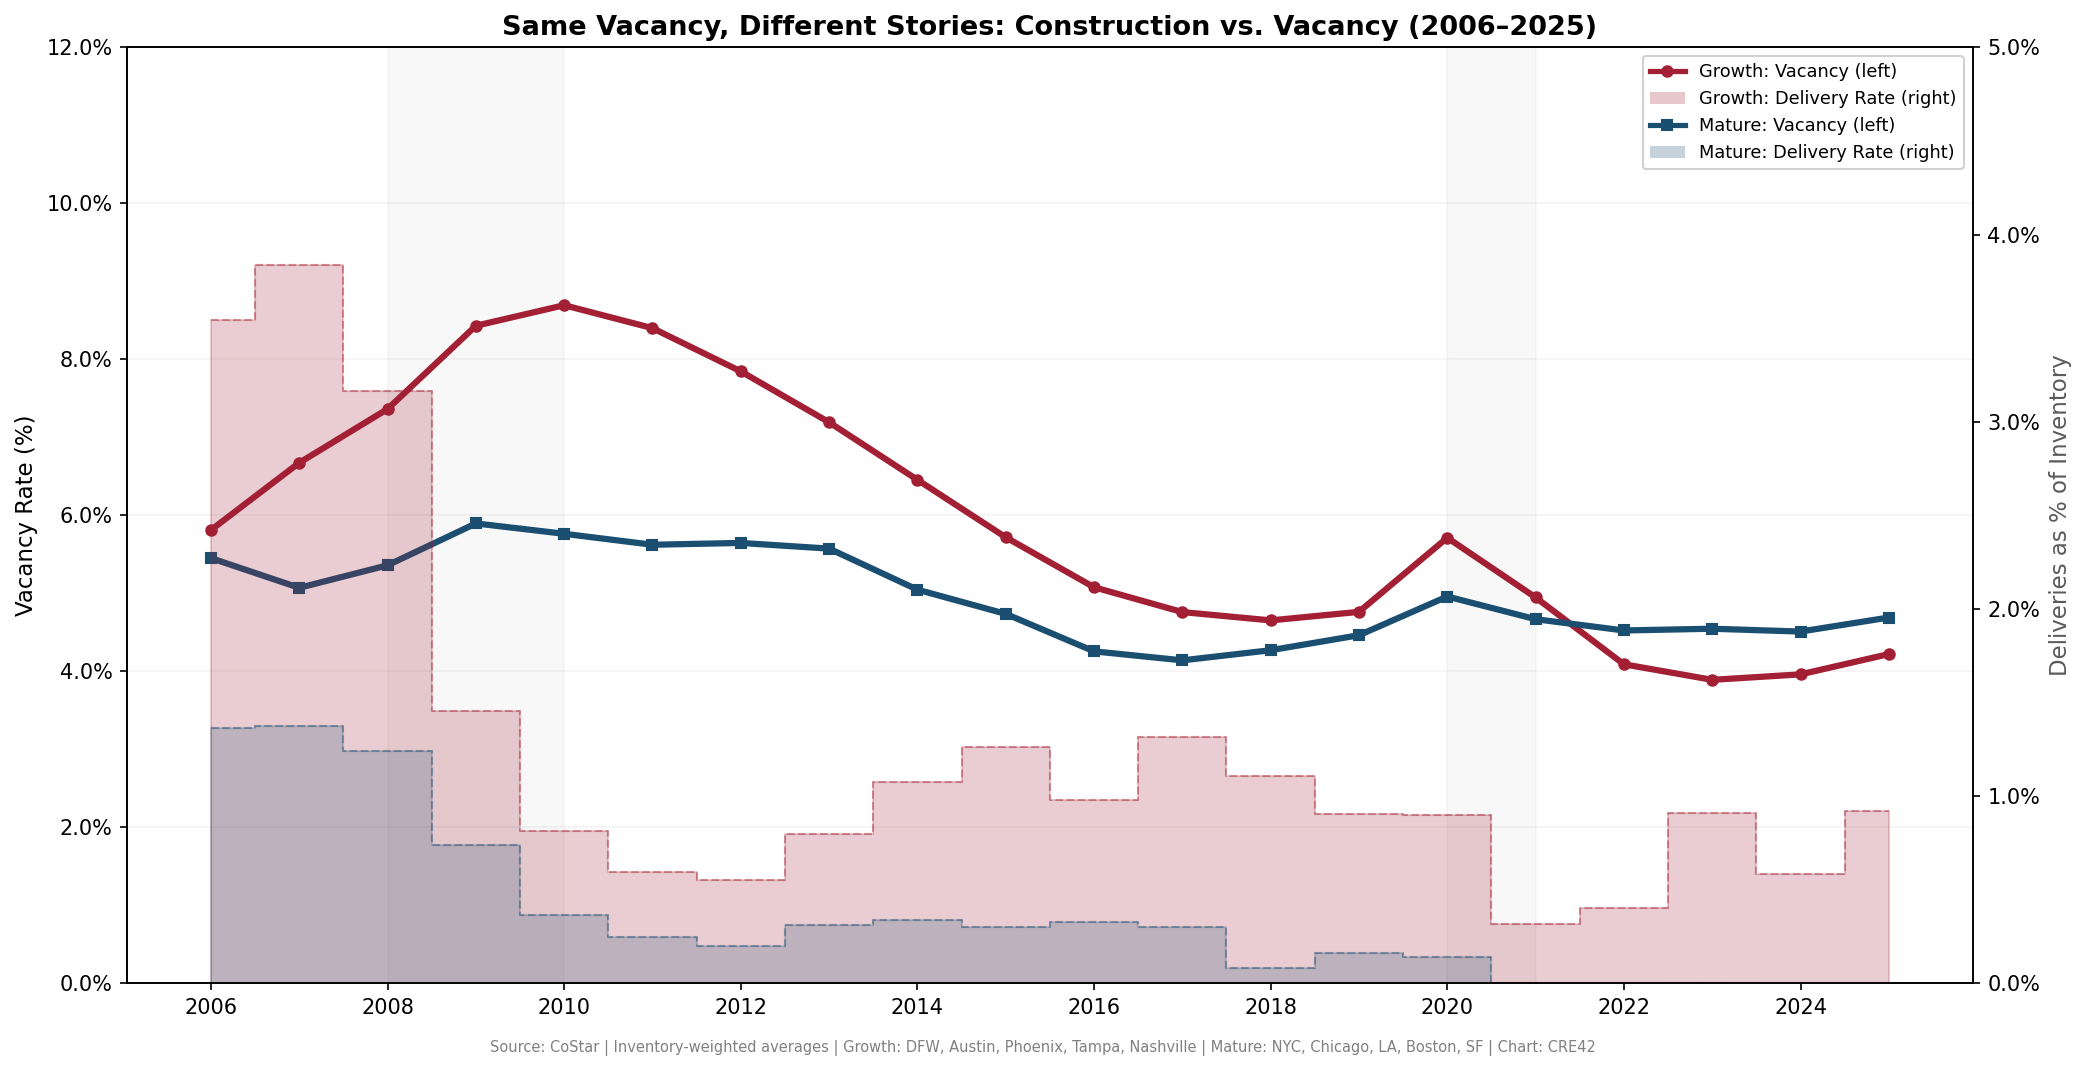
Vacancy Rate (lines, left axis) and Deliveries as % of Inventory (fill, right axis) | Growth: DFW, Austin, Phoenix, Tampa, Nashville | Mature: NYC, Chicago, LA, Boston, SF | Source: CoStar | Chart: CRE42
Retail Construction Rate — Growth vs. Mature Markets
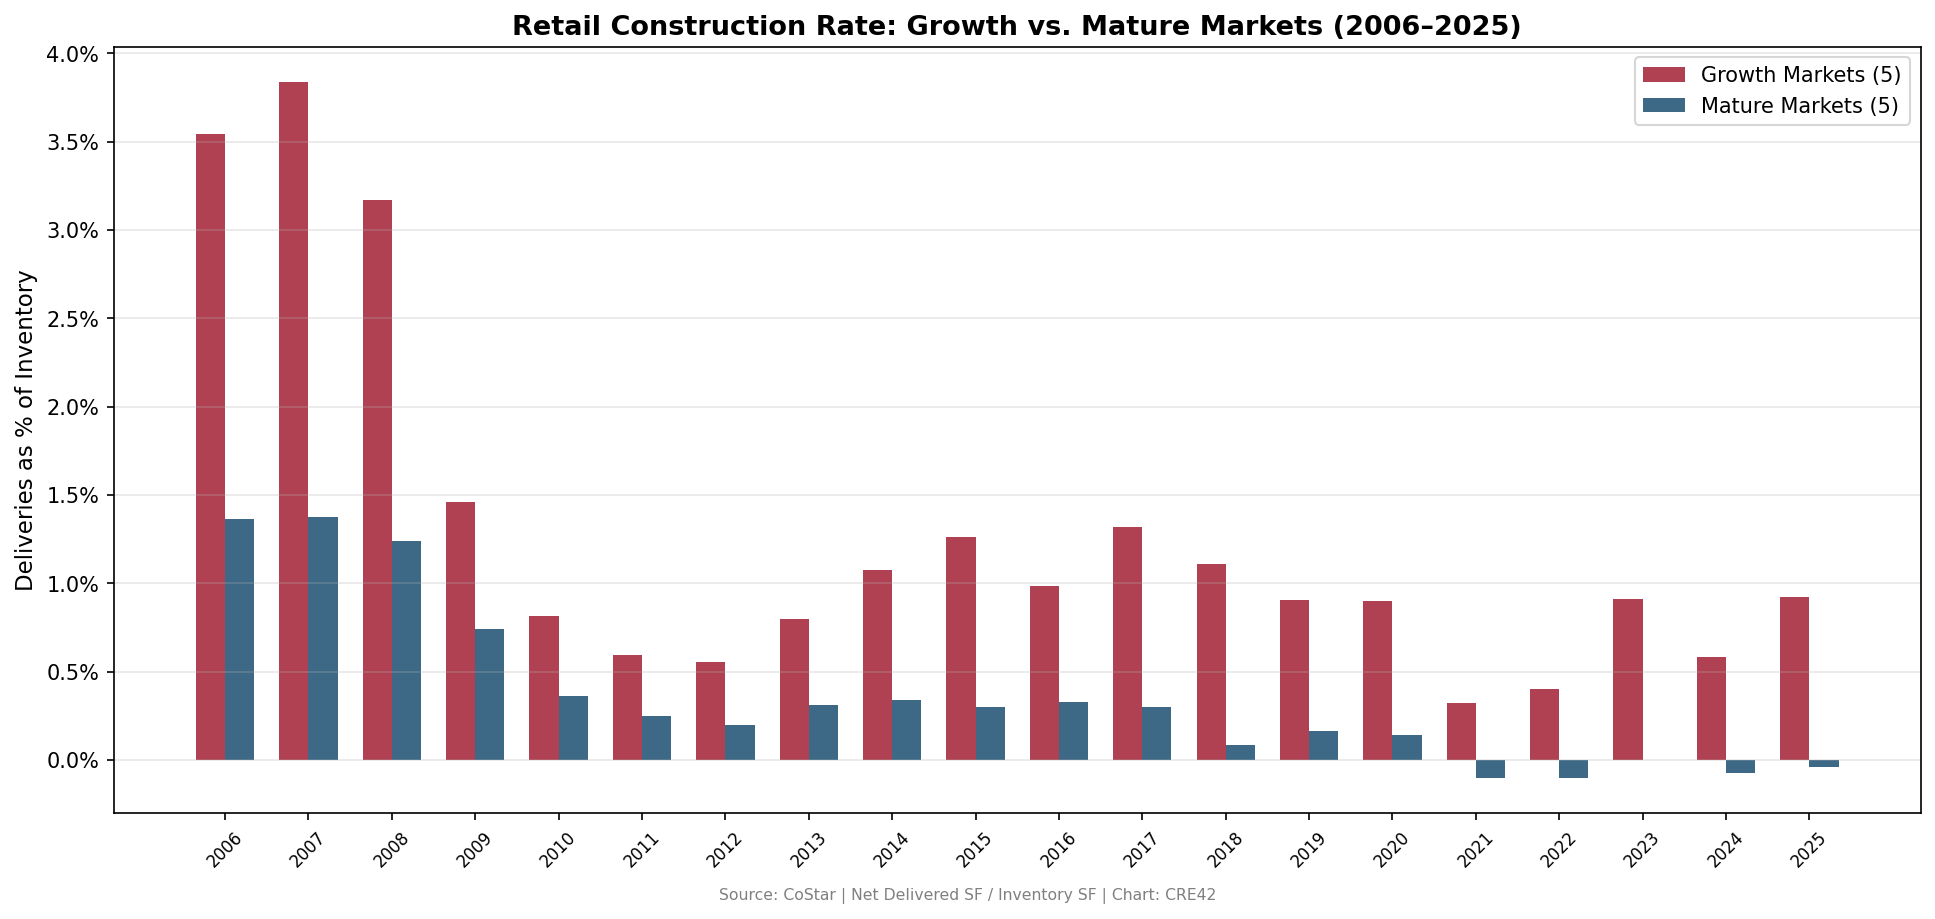
Net Delivered SF as Percentage of Inventory | Source: CoStar | Chart: CRE42
Retail Net Absorption — Growth vs. Mature Markets
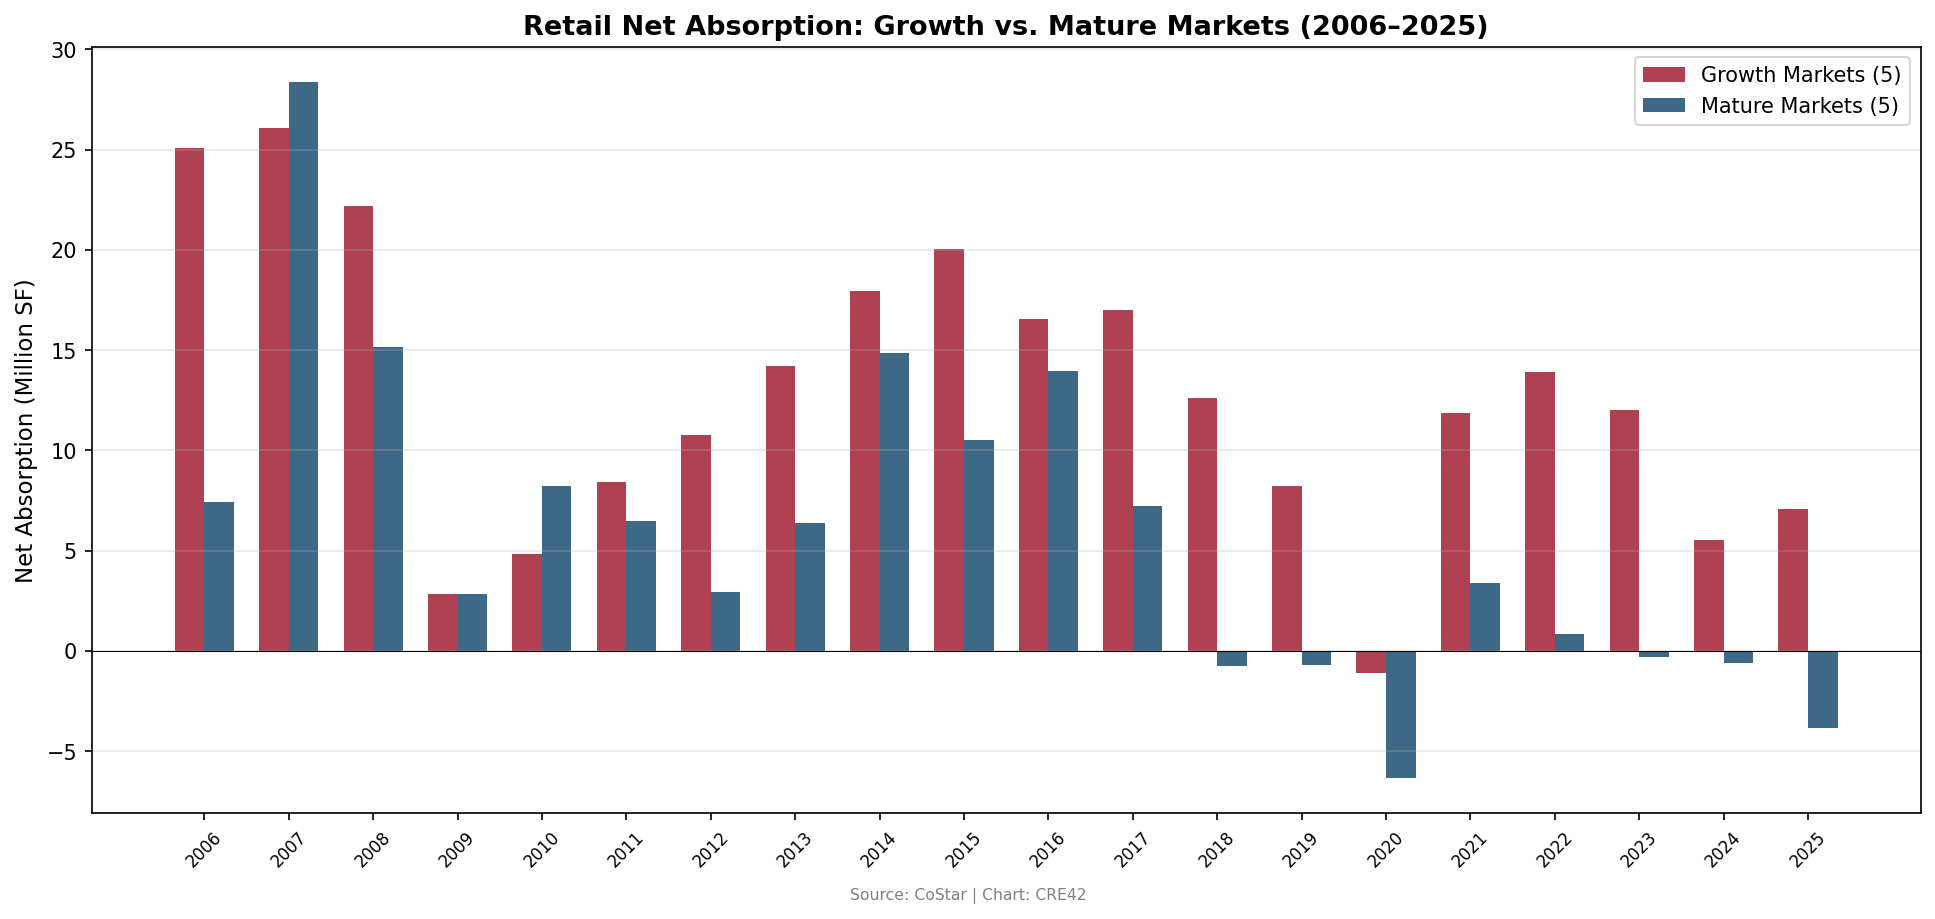
12-Month Net Absorption in Million SF | Source: CoStar | Chart: CRE42
A few individual metros have dominated the national retail supply numbers, especially over the last few years. Overall, our select growth markets began to diverge from national averages and mature markets around 2021, both in aggregate SF and as a percentage of existing inventory.
Retail Inventory Growth by Market
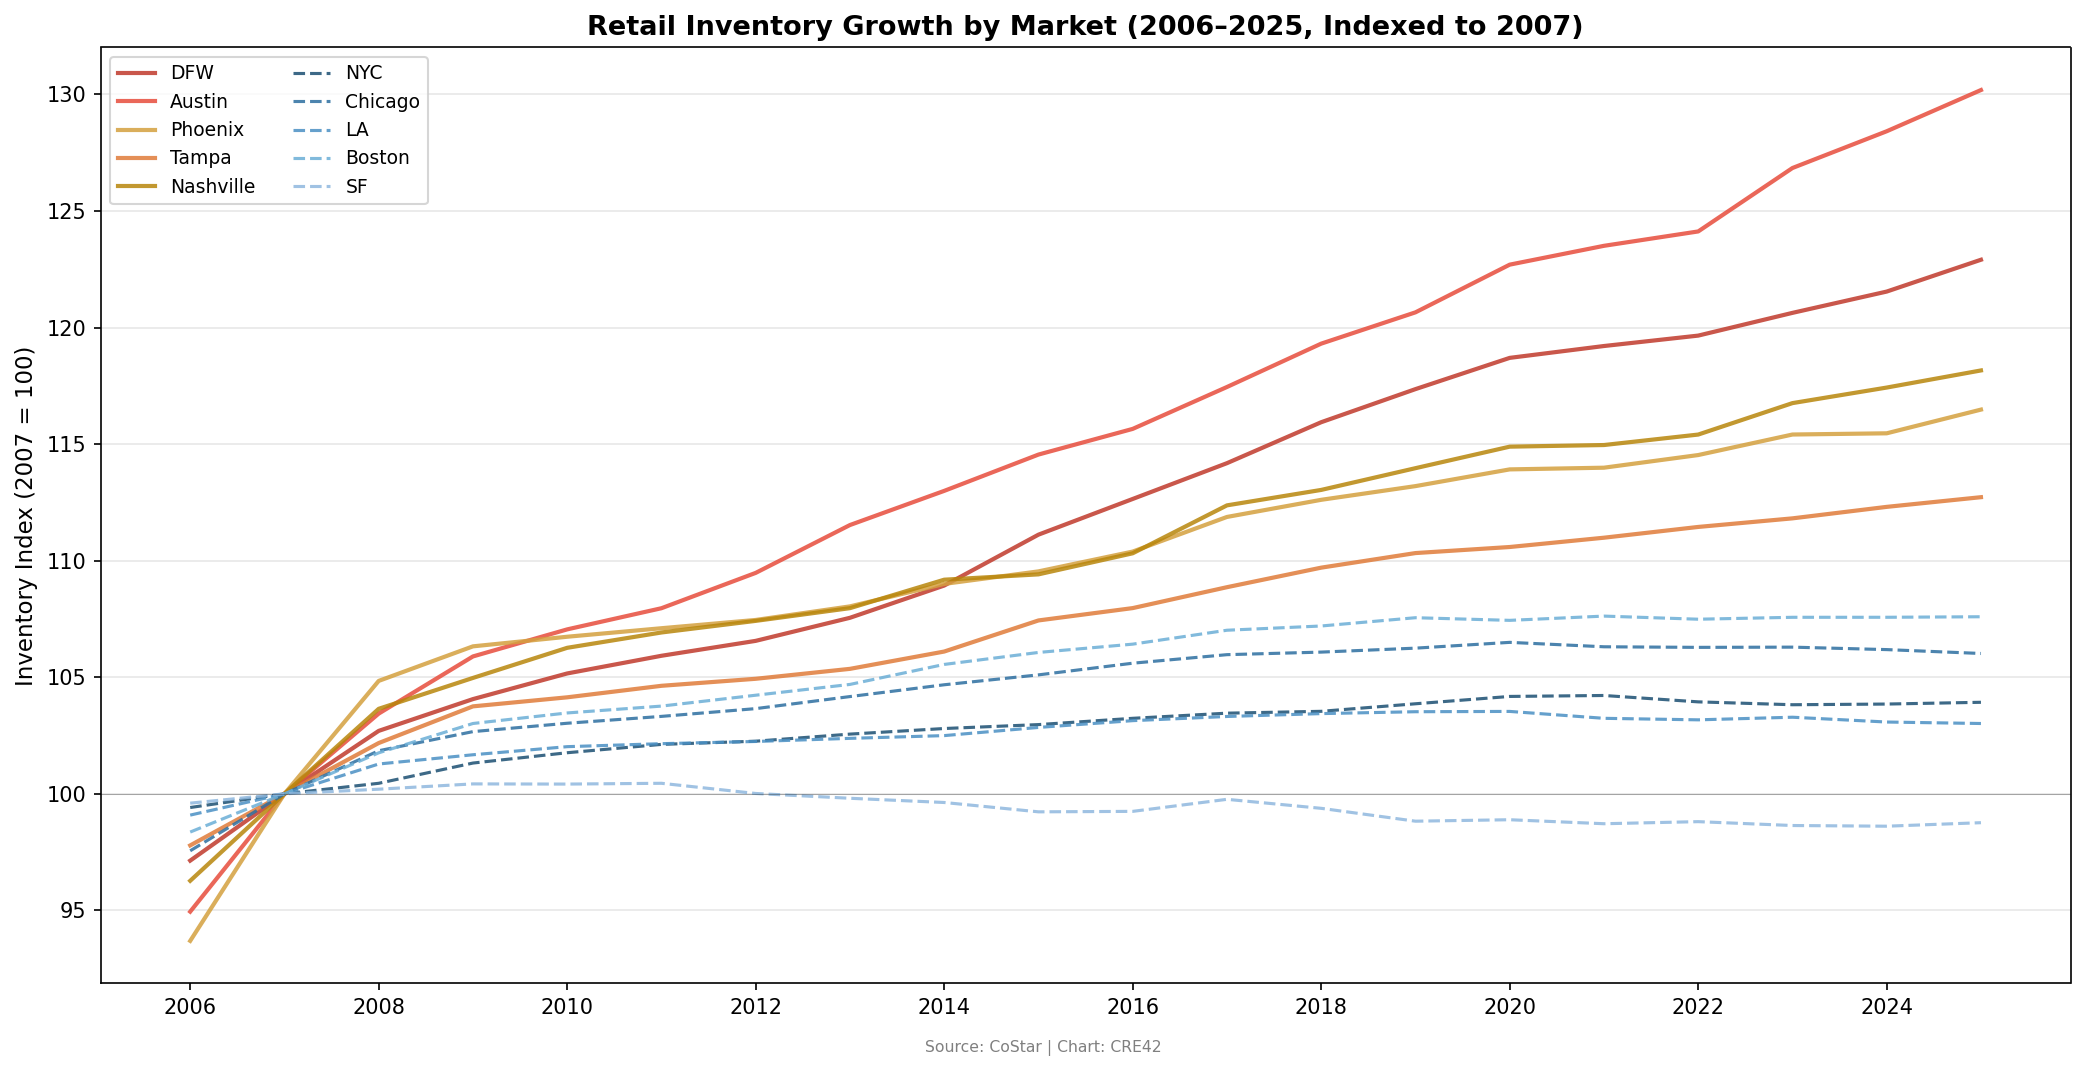
Inventory Index (2007 = 100) | Solid lines = growth markets; dashed = mature markets | Source: CoStar | Chart: CRE42
Retail Construction Pipeline
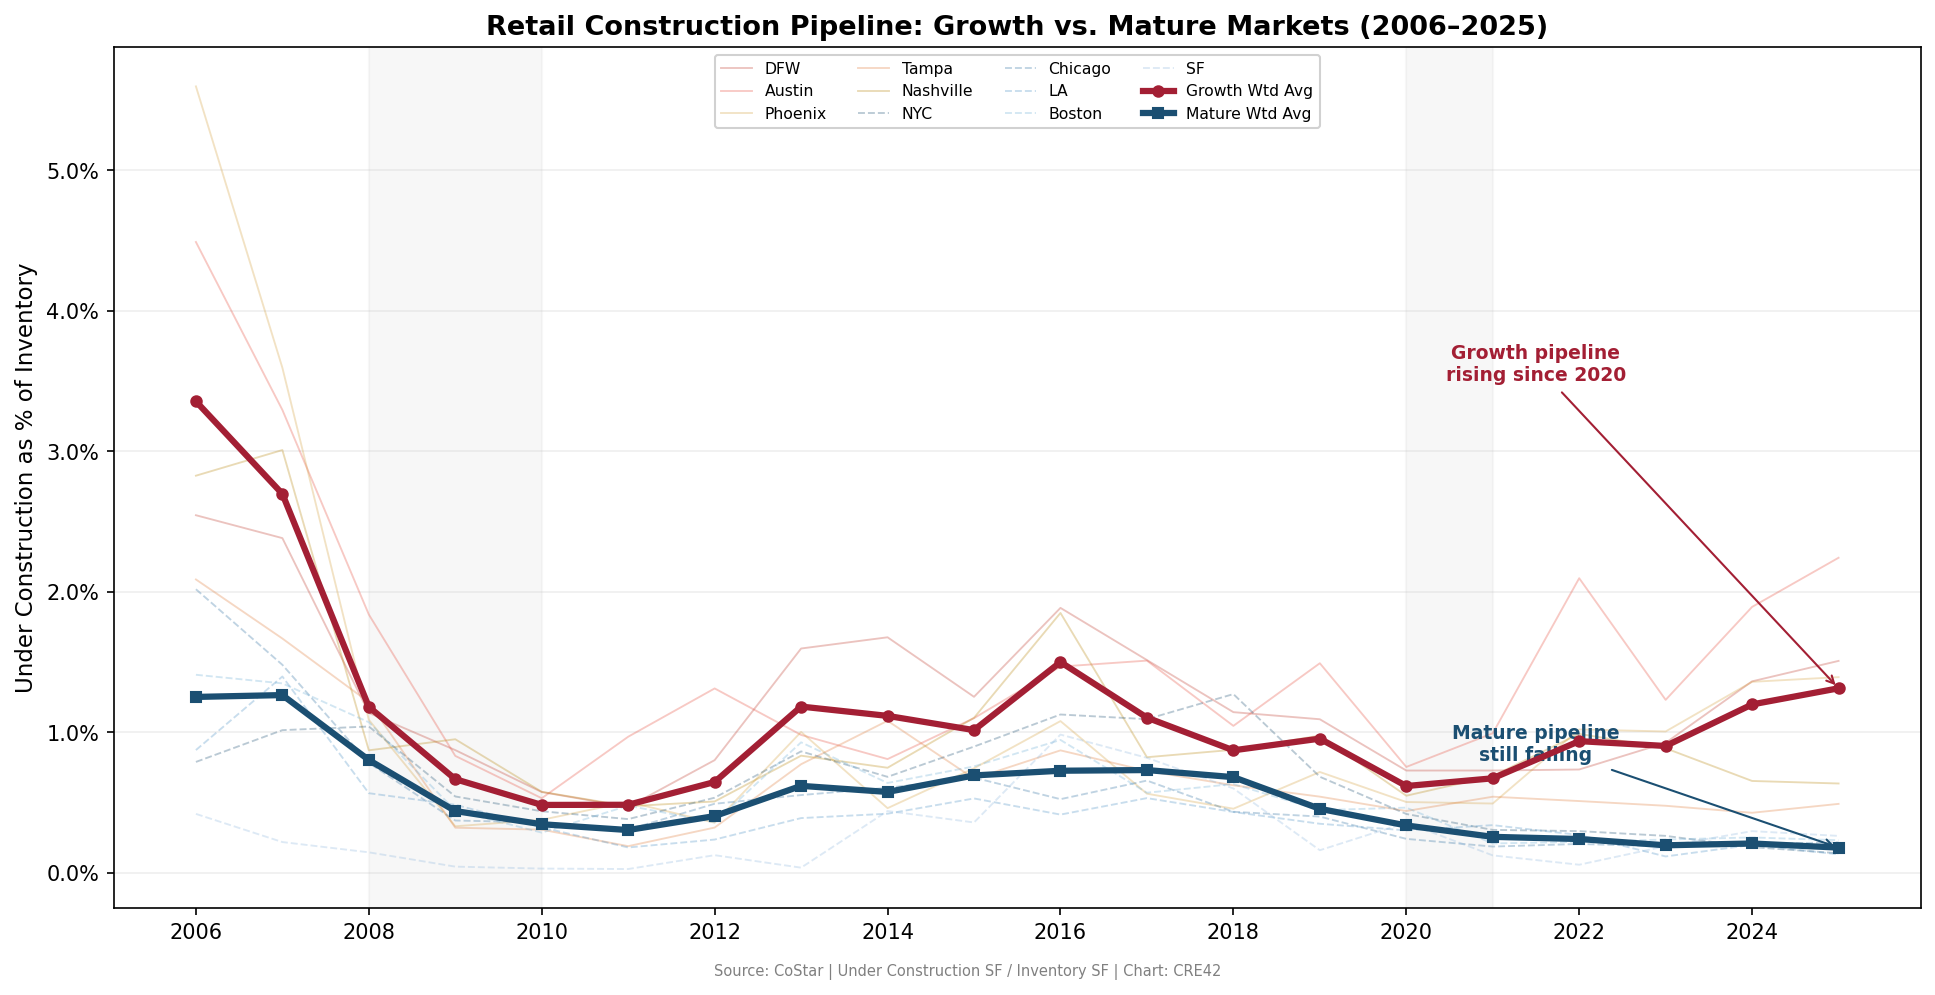
Under Construction SF as Percentage of Inventory | Bold lines = group weighted averages; thin lines = individual markets | Source: CoStar | Chart: CRE42
Key Observations (CoStar, March 2026)
Construction concentration across markets
The two charts below show the dominance of a handful of metros vs. national retail construction averages. The four major Texas metros (DFW, Houston, Austin, San Antonio) comprise 35% of current construction intensity (TTM deliveries plus current under construction). The top eight markets make up more than half of the national total by the same measure.
Retail Construction Intensity* by Market (March 2026)
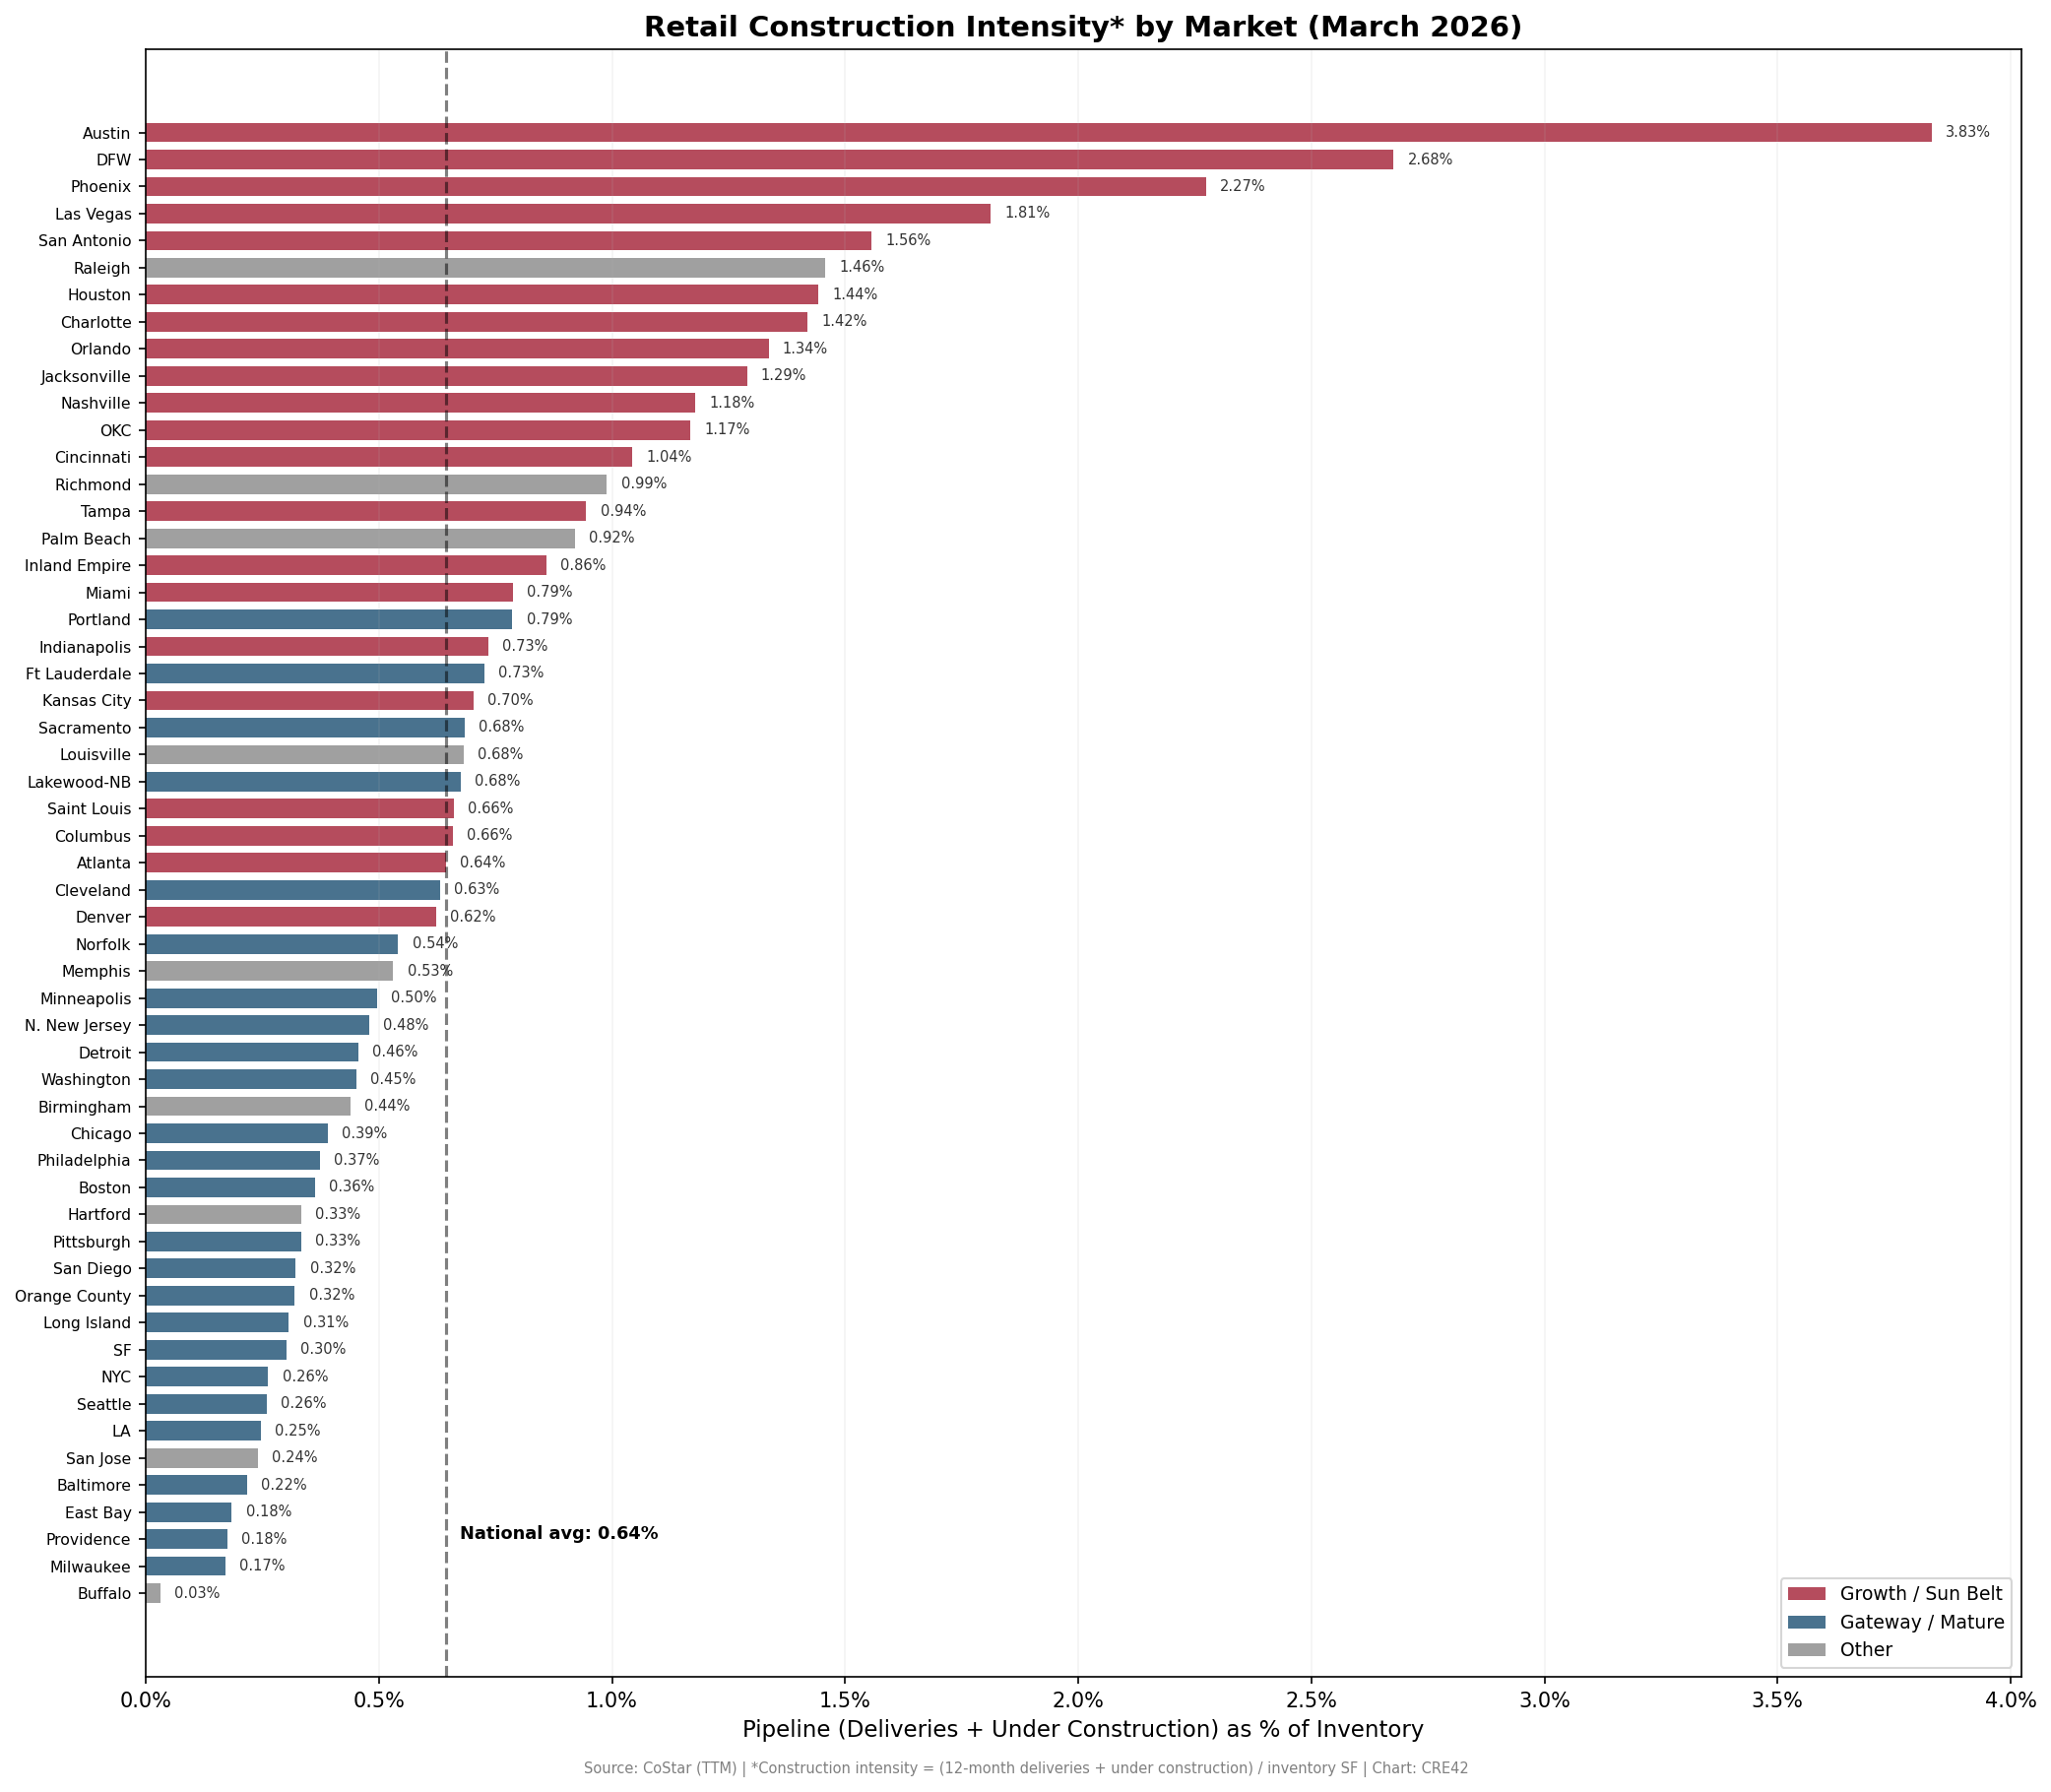
*Construction intensity = (12-month deliveries + under construction) / inventory SF | 45 MSAs with 75M+ SF | Source: CoStar | Chart: CRE42
Retail Construction Concentration by Market (March 2026)
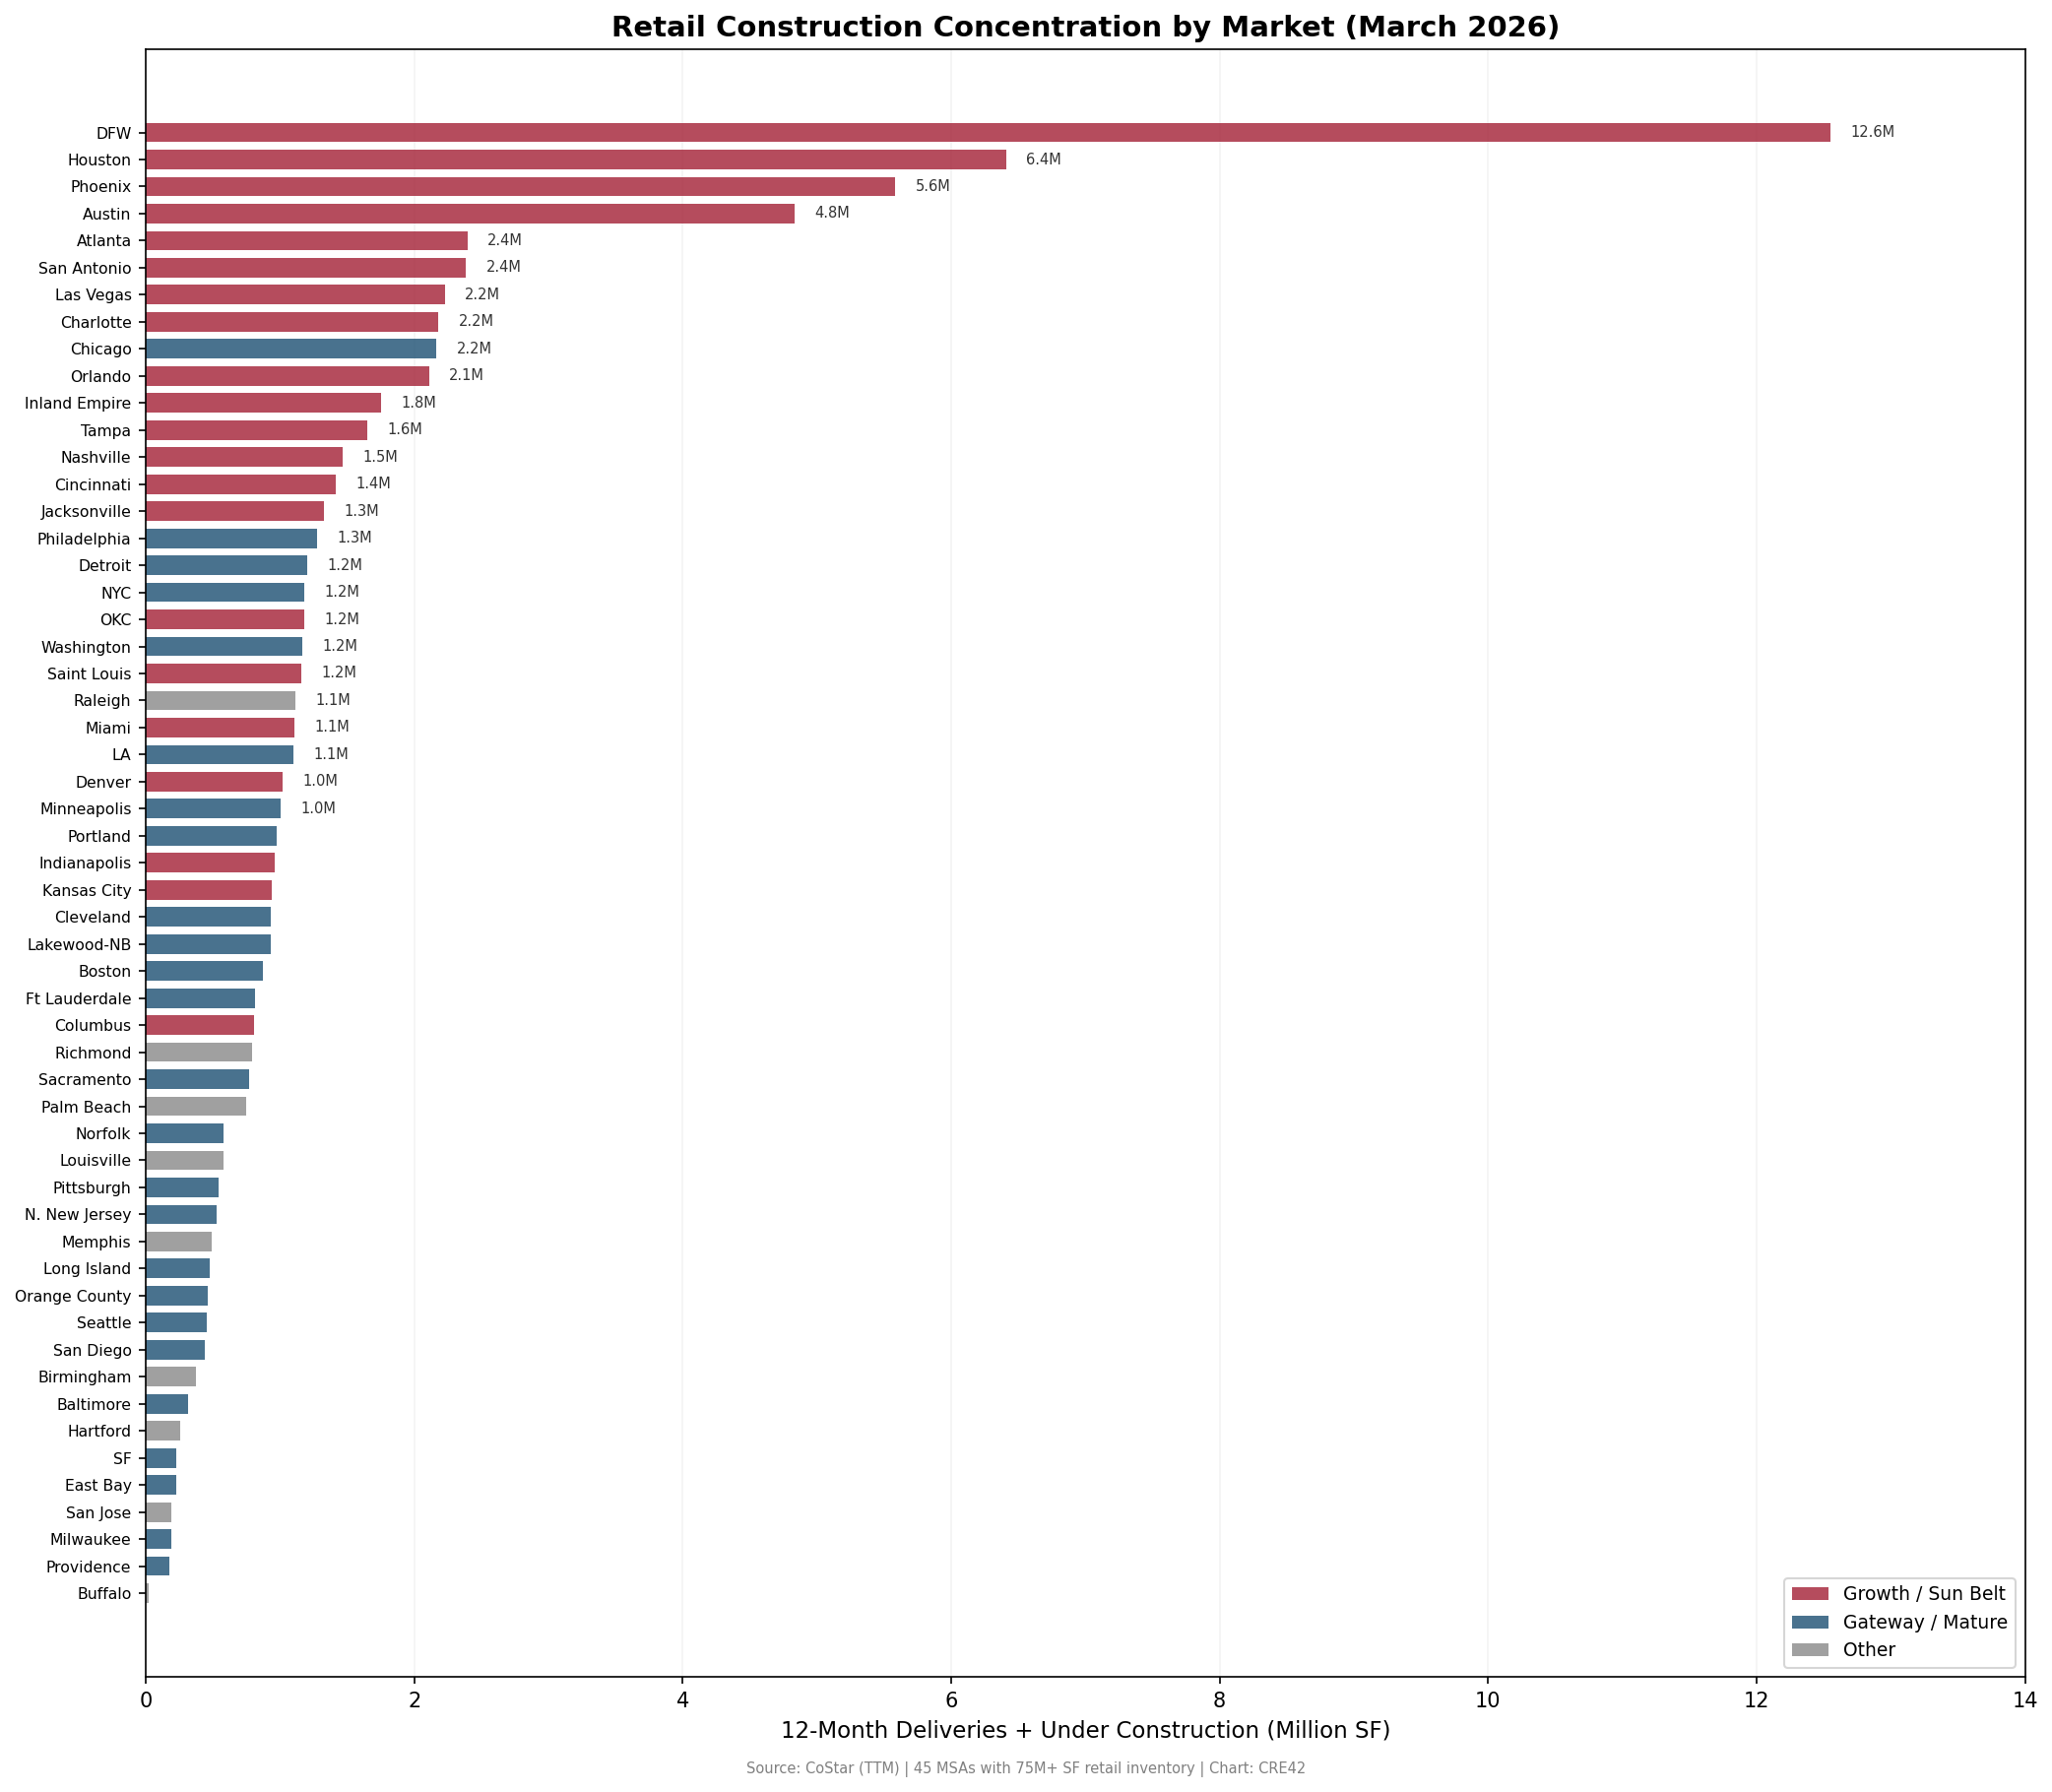
MSAs Ranked by 12-Month Deliveries + Under Construction (Million SF) | Source: CoStar | Chart: CRE42
Context & Discussion
Growth vs. Mature MSAs: Converging outcomes, different paths
The headline vacancy rates for growth and mature retail markets converged by 2025 to within half a percentage point (4.2% vs. 4.7%).[1] Growth markets arrived at low vacancy by building aggressively and absorbing the new space. Their delivery rate averaged 0.92% of inventory in 2025, with net absorption of +7.1 million SF across five metros.[1] Mature markets arrived at a similar vacancy by building almost nothing—and still losing tenants. Net deliveries were negative (−0.04% of inventory), meaning demolitions and conversions outpaced new construction, yet net absorption was also negative at −3.8 million SF.[1]
This pattern is the inverse of what played out in multifamily and industrial during the same period. In those sectors, growth markets overbuilt relative to near-term demand, vacancy spiked, and the narrative centered on supply risk. In retail, growth markets are both building more and running tighter than mature markets on every operating metric except absolute rent level.
Factors influencing retail construction vs. other assets
Several structural factors explain why retail did not experience the construction boom that characterized multifamily and industrial from 2020 through 2024.
Capital allocation during the MF and industrial boom absorbed most development dollars. Multifamily and industrial were consensus investment theses from 2020 to 2023, attracting the bulk of institutional construction capital. Retail, still carrying the stigma of the “retail apocalypse” narrative, was not competing effectively for that capital even as its fundamentals quietly improved.
The e-commerce narrative itself imposed a delayed planning cycle. Lenders and equity investors reduced exposure to speculative retail development during the 2015–2020 period, and the pandemic intensified that risk aversion. Even after in-store retail spending recovered and e-commerce penetration stabilized near 16% of total retail sales, the development community remained cautious.[4]
Construction costs added a further constraint. The PPI for new nonresidential building construction rose approximately 40% from mid-2019 through the end of 2025, nearly double the 23% increase in consumer prices over the same period.[2] Industrial building construction costs rose even faster, at approximately 47%.[2] Combined with construction loan rates in the 7–9% range during 2023–2024, development yields compressed to the point where only pre-leased projects in high-growth markets could achieve acceptable returns.[3]
Finally, retail is arguably the most location-specific commercial real estate asset type. Retail requires high-traffic intersections, appropriate co-tenancy, road visibility, and adequate parking—a set of constraints that produces far fewer viable development sites per square mile than any other asset class. In mature markets where the best intersections have been built out for decades, new retail construction faces a physical scarcity that does not exist for multifamily or industrial.
Construction picking up in select markets
Despite these constraints, the growth-market pipeline has accelerated. Under construction as a share of inventory doubled in growth markets from 0.62% in 2020 to 1.31% in 2025.[1] DFW alone has 7.1 million SF under construction—more than the entire mature-market group combined (3.2 million SF across NYC, Chicago, LA, Boston, and SF).[1]
The concentration is extreme. Among the 45 MSAs with 75 million SF or more of retail inventory, the top four markets (DFW, Houston, Phoenix, Austin) account for 39.6% of the total pipeline. The top eight account for 52%.[1] The first traditional gateway city in the ranking is Chicago at #9, with 2.2 million SF—less than one-fifth of DFW’s total.[1] This geographic concentration reflects the same population-follows-jobs-follows-construction logic visible in the multifamily and industrial data, but at a much smaller absolute scale.
Current pipeline levels remain well below the pre-GFC boom, when growth markets routinely delivered 2.5–3.5% of inventory annually.[1] Even DFW’s elevated 2.68% construction intensity is below the 2006–2008 average for the growth group as a whole.
What to Watch
The central question is whether the growth-market construction pickup represents healthy demand-driven development or the early stage of a supply cycle that could push vacancy higher.
Factors favoring continued absorption:
- Population growth in Sun Belt metros continues to outpace the national average, supporting retail demand (see Domestic Migration)
- E-commerce penetration has stabilized, reducing the structural headwind to physical retail (see E-Commerce & Retail)
- Current delivery rates (0.92% of inventory) are well below the pre-GFC levels (2.5–3.5%) that produced vacancy spikes[1]
- Vacancy in growth markets (4.2%) is near historical lows, providing a buffer against moderate oversupply[1]
Headwinds to watch:
- DFW and Phoenix pipelines are concentrated and accelerating; localized oversupply risk is higher than group averages suggest[1]
- Construction cost inflation continues at approximately 4.4% annually for nonresidential buildings, with tariff uncertainty adding upward pressure[2][5]
- Interest rates remain elevated, compressing development spreads and limiting the pool of feasible projects[3]
- Mature-market negative absorption could signal broader consumer spending shifts rather than purely geographic reallocation[1]
Sources to Track Retail Construction in 2026:
| Source | Next Release | Date | Notes |
|---|---|---|---|
| BLS PPI: Nonresidential Building Construction (FRED WPU801) | December 2025 data | January 30, 2026 | Tracks construction cost trajectory; key input to development feasibility |
| Census Bureau: Construction Spending | December 2025 data | February 27, 2026 | Commercial construction spending by category; signals capital allocation shifts |
| CoStar: MSA-Level Retail Analytics | Q1 2026 update | Expected April 2026 | Delivery and absorption data for growth-market pipeline tracking |
| Federal Reserve: FOMC Statements | March 2026 meeting | March 18–19, 2026 | Rate path directly affects construction loan pricing and development feasibility |
Notes
[1] CoStar Group. Market Analytics: Retail — National, MSA-Level Annual Data (2006–2025). costar.com ↩
[2] U.S. Bureau of Labor Statistics. Producer Price Index: New Nonresidential Building Construction (WPU801) (2009–2025). fred.stlouisfed.org ↩
[3] Federal Reserve. Federal Funds Effective Rate. fred.stlouisfed.org ↩
[4] U.S. Census Bureau. Quarterly Retail E-Commerce Sales. census.gov ↩
[5] Construction Analytics (Ed Zarenski). Construction Inflation & PPI 2025. edzarenski.com ↩
Methodology & Data Notes
Data Source & Period
All retail market data is from CoStar Group’s market analytics platform. Historical annual data covers 2006–2025 for 10 MSAs. Snapshot data (TTM) covers 45 MSAs with 75 million SF or more of retail inventory.
Market Selection
Growth markets (5): Dallas–Fort Worth, Austin, Phoenix, Tampa, Nashville. Selected for sustained population growth, geographic diversity, and representation across Texas, Florida, Arizona, and Tennessee.
Mature markets (5): New York, Chicago, Los Angeles, Boston, San Francisco. Selected as traditional gateway/coastal metros with large existing retail inventory and slower population growth.
Combined coverage: approximately 2,900 million SF, or 24.7% of national retail inventory. San Francisco (75M SF) contributes relatively little to weighted averages but is included for geographic balance and topical relevance.
Aggregation Method
Group vacancy rates and rent growth are inventory-weighted averages. Group delivery rates and absorption are simple sums divided by group total inventory. This approach gives appropriate weight to larger markets (DFW, Chicago, NYC) while still reflecting conditions in smaller markets (Nashville, SF).
Construction Cost Data
PPI values are from the Bureau of Labor Statistics via FRED. The nonresidential building construction index (WPU801) uses June 2009 = 100 as its base. The approximate 40% increase from 2019 to 2025 is based on index values of approximately 128.5 (mid-2019) and 179.9 (December 2025). Exact values should be verified against the BLS source for specific date comparisons.
Limitations
CoStar’s MSA definitions may differ from Census Bureau MSA boundaries. Retail inventory includes all retail property types tracked by CoStar (strip centers, malls, freestanding, urban retail) and may not be directly comparable across different data providers. Pipeline data (under construction) represents a point-in-time snapshot and can fluctuate with project delays, cancellations, or accelerations.