
Net Population Growth 2020–2025 by State
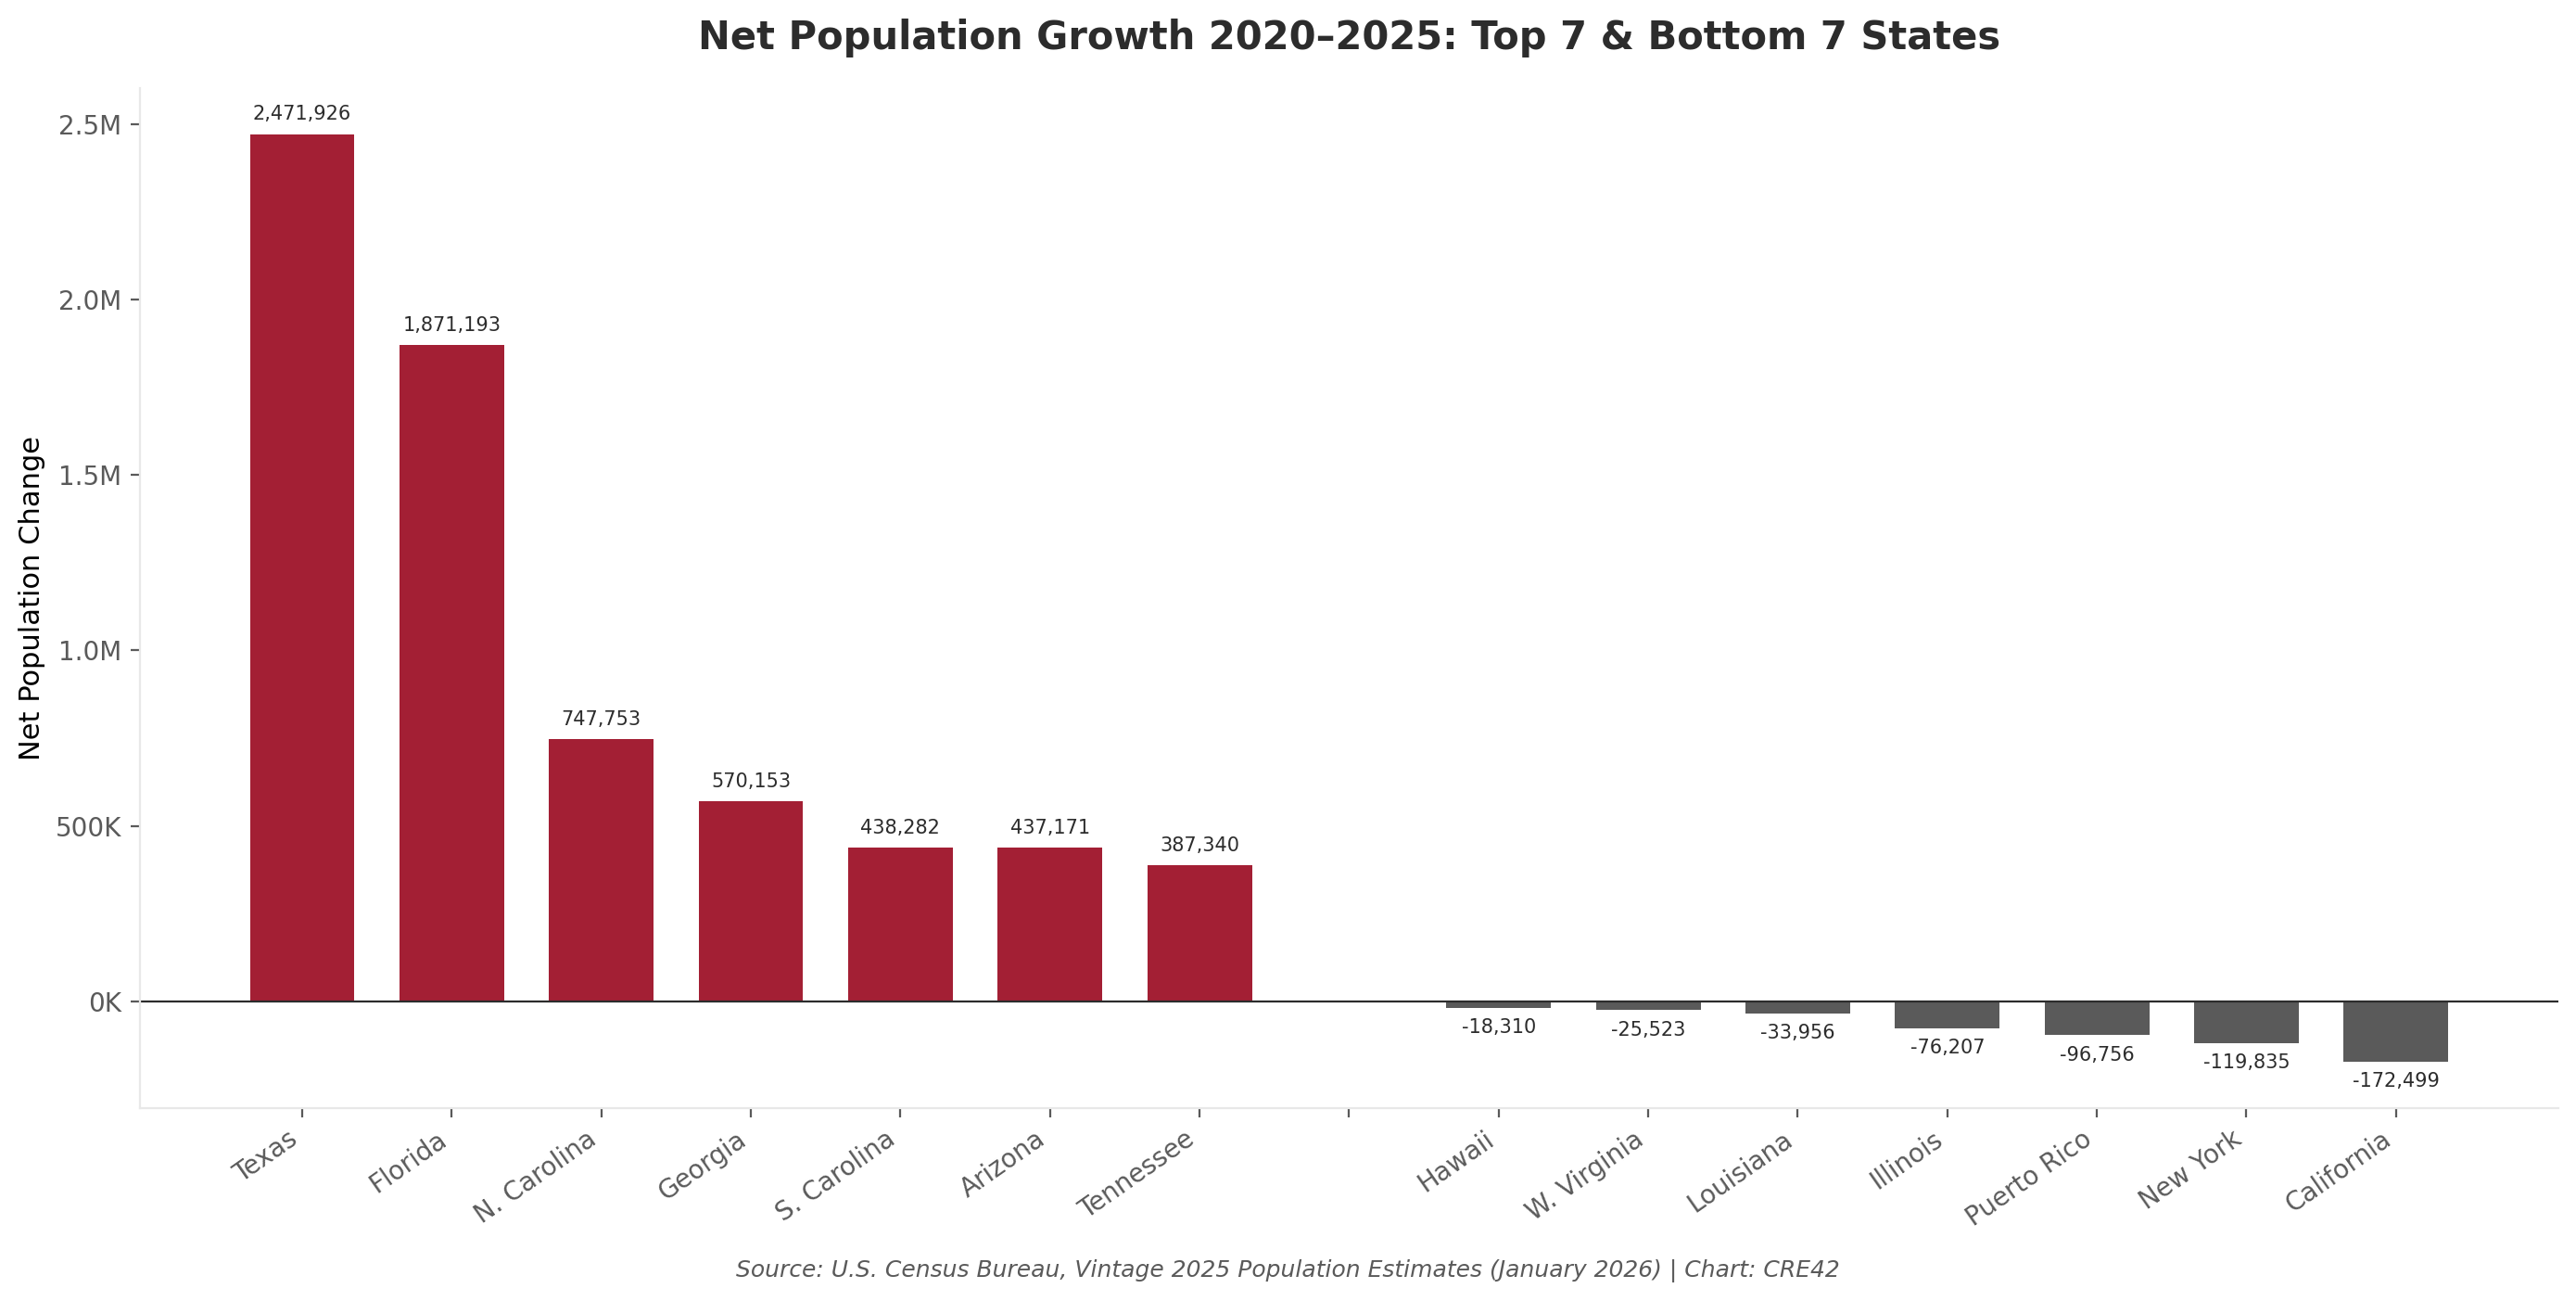
Net Population Growth 2020–2025: Top 7 & Bottom 7 States | Source: U.S. Census Bureau, Vintage 2025 Population Estimates (January 2026) | Chart: CRE42
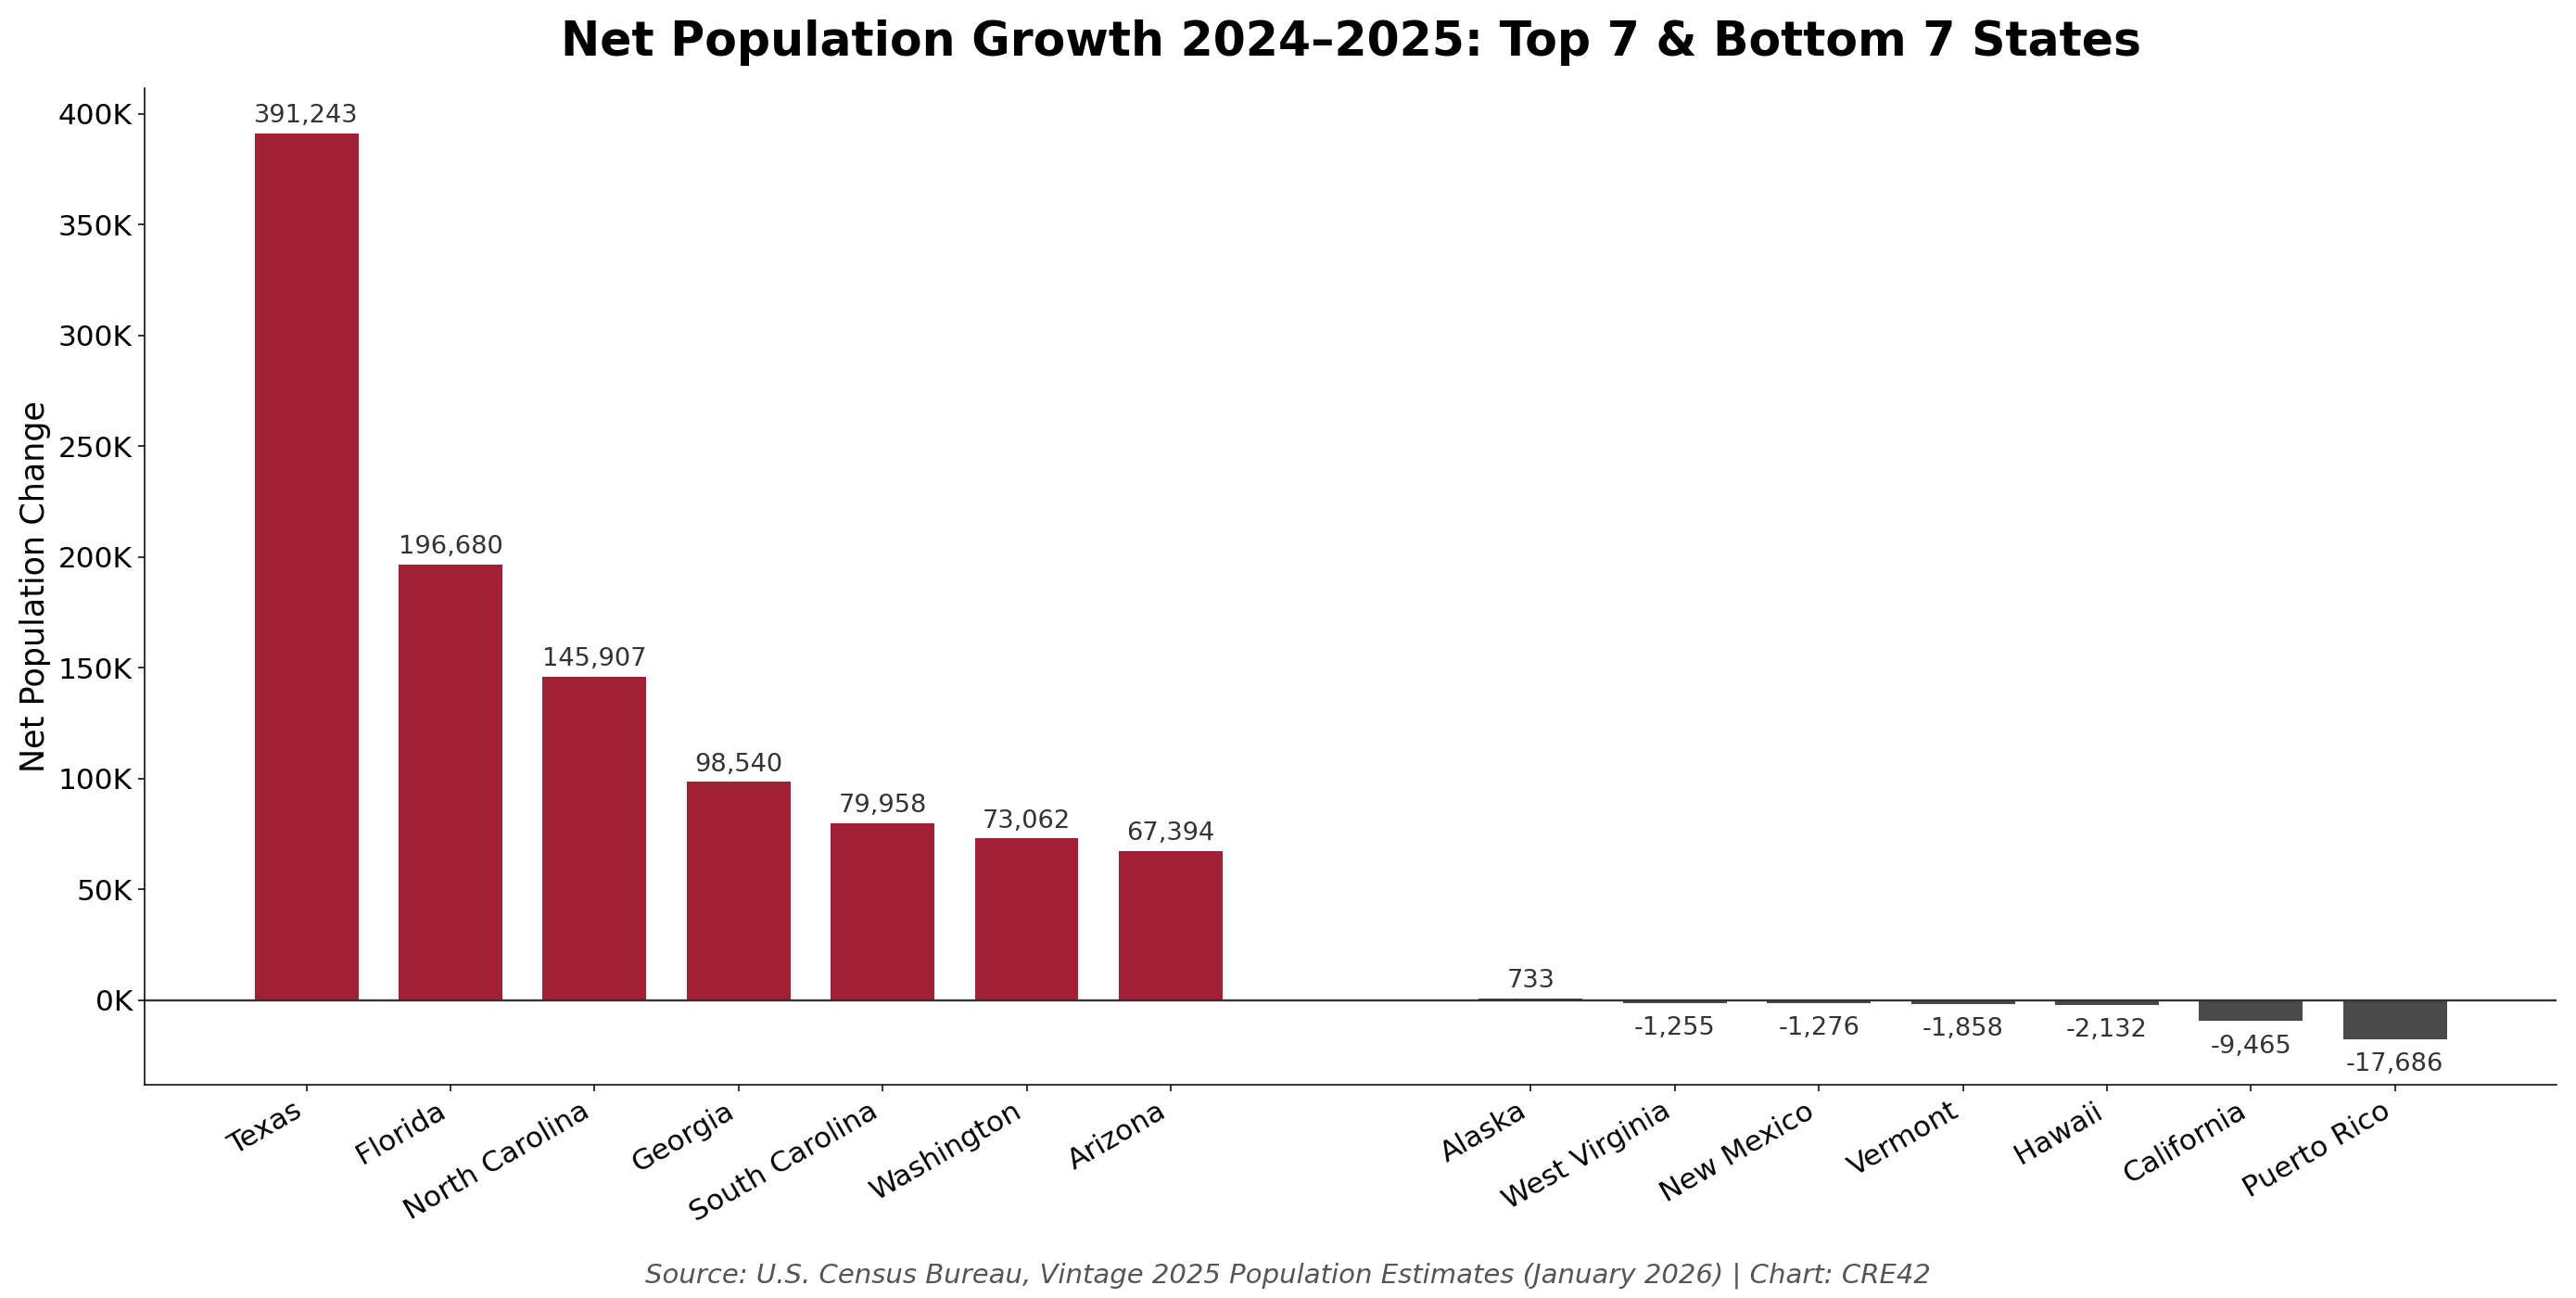
Net Population Growth 2024–2025: Top 7 & Bottom 7 States | Source: U.S. Census Bureau, Vintage 2025 Population Estimates (January 2026) | Chart: CRE42
Top 7 States — Share of U.S. Population Growth (2020–2025)
| State | Net Growth 2020–25 | % of U.S. Total | Net Growth 2024–25 | Domestic Migration | Int’l Migration | Natural Change |
|---|---|---|---|---|---|---|
| Texas | 2,471,926 | 24.5% | 391,243 | 67,299 | 167,475 | 157,711 |
| Florida | 1,871,193 | 18.5% | 196,680 | 22,517 | 178,674 | −1,333 |
| North Carolina | 747,753 | 7.4% | 145,907 | 84,064 | 46,890 | 15,129 |
| Georgia | 570,153 | 5.6% | 98,540 | 27,333 | 42,579 | 28,631 |
| South Carolina | 438,282 | 4.3% | 79,958 | 66,622 | 12,930 | 564 |
| Arizona | 437,171 | 4.3% | 67,394 | 31,107 | 28,219 | 7,649 |
| Tennessee | 387,340 | 3.8% | 63,785 | 42,389 | 17,990 | 3,597 |
| Top 7 Total | 6,923,818 | 68.5% | 1,043,507 | 341,331 | 494,757 | 211,948 |
Component columns (net domestic migration, net international migration, and natural change: births minus deaths) cover the 2024–25 year only. Components do not sum exactly to net growth; the difference is the Census Bureau’s small statistical residual. Source: U.S. Census Bureau, Vintage 2025 components of change (NST-EST2025-COMP).
- National growth fell from +3.25 million (2023–2024) to +1.76 million (2024–2025) as net international migration declined 54%.
- New York’s annual gain collapsed from +214,876 to +1,008; California returned to decline (−9,465) after one positive year; even Texas slowed from +599,331 to +391,243, yet its share of national growth rose to 22%.
- Florida’s deceleration is a domestic migration story: net domestic inflow fell from +310,892 in 2021–2022 to +22,517 in 2024–2025, a 93% decline, as insurance premiums, property taxes, condo assessments, and home prices eroded the state’s affordability edge. International migration (+178,674) now accounts for nearly all of Florida’s growth, and natural change has turned negative (−1,333).
- The top seven growth states captured 59% of the smaller national increase, versus 68.5% over the full five-year period.
Key Observations
Context & Discussion
Growth Concentration: South and Mountain West Dominate
The seven-state concentration of 68.5% is not a pandemic-era anomaly. It is the acceleration of a structural trend visible across all time horizons in the Census data. Over 25 years (2000–2025), the top ten growth states added 39.4 million residents and captured two-thirds of all U.S. population growth. Eight of those ten — Texas, Florida, North Carolina, Georgia, Arizona, Virginia, Colorado, and Tennessee — are in the South or Mountain West. The only exceptions are California (which ranks third over 25 years but has been shrinking since 2020) and Washington. The drivers are well-documented: lower housing costs relative to coastal metros, lower state income and property tax burdens, warmer climates, and sustained employment growth in technology, logistics, healthcare, and energy. The pandemic accelerated these trends by enabling remote work, but the underlying economics were already pulling population southward and westward for decades.
2025 Growth — Structural Trends Persist but the Post-Pandemic Surge Has Cooled
| State | 5yr CAGR | 1yr Growth | Shift | Note |
|---|---|---|---|---|
| Texas | 1.64% | 1.25% | -0.39% | Still #1 absolute growth |
| Florida | 1.68% | 0.85% | -0.83% | Sharpest deceleration |
| North Carolina | 1.39% | 1.32% | -0.07% | Most stable |
| Georgia | 1.04% | 0.88% | -0.16% | |
| South Carolina | 1.65% | 1.46% | -0.19% | Fastest 1yr % growth (1.5%) |
| Arizona | 1.19% | 0.89% | -0.30% | |
| Tennessee | 1.09% | 0.88% | -0.21% | |
| Idaho | 1.88% | 1.44% | -0.44% | Mountain West cooling |
| Utah | 1.51% | 1.03% | -0.48% | Mountain West cooling |
| Washington | 0.70% | 0.92% | +0.22% | Accelerated |
| Illinois | -0.12% | +0.13% | +0.25% | Modest recovery |
| New York | -0.12% | +0.01% | +0.13% | Roughly flat |
| California | -0.09% | -0.02% | +0.07% | Still declining |
Texas remains the national leader in absolute growth but slowed from a 2022–2024 pace near 2.0% annually to 1.25% in the most recent year. Net domestic migration to Texas fell from 218,840 in 2022 to 67,299 in 2025.
Florida experienced the sharpest deceleration of any major growth state. Its 2024–2025 growth of 0.85% was roughly half its five-year CAGR, down from a peak of 2.64% in 2021–2022. Significantly rising property insurance premiums and growing concerns about hurricane exposure and summer heat appear to have tempered what was the country’s most dramatic pandemic-era migration surge.
The top ten growth states captured 69.1% of national population growth in 2024–2025, down from 76.5% over the full five-year period. Eight of the top ten decelerated in the most recent year, while previously declining states including Illinois, New York, and California showed modest stabilization. The pattern is consistent with a pull-forward effect — households that were already planning to relocate accelerated their timelines during the remote-work window of 2021–2022 — and suggests the geographic concentration of U.S. population growth, while still firmly intact, has begun to normalize from its pandemic-era peak.
U.S. Population Growth Has Slowed Sharply, Driven by Immigration Decline
Overall U.S. population growth slowed to 0.5% in the year ending July 2025 (vs. a 5-year CAGR of 0.60% and 3-year CAGR of 0.76%) — the slowest rate since the early pandemic period in 2021 and less than half the 1.0% rate recorded in 2024. Net international migration fell 54% in a single year, from 2.7 million to 1.3 million, according to the Census Bureau’s Vintage 2025 estimates. Natural increase (births minus deaths) remained roughly stable near 519,000 — itself a significant decline from the 1.6–1.9 million range during the 2000s decade. If current trends continue, the Census Bureau projects net international migration could fall further to approximately 321,000 by mid-2026, which would represent an 88% decline from the 2024 peak and bring overall U.S. population growth close to the pandemic-era lows.[3]
California — From Growth Engine to Net Exporter
California’s trajectory is the single most dramatic reversal in the dataset. The state added 5.4 million residents from 2000 to 2025, enough to rank third nationally over that 25-year span. Yet its population has been declining since 2020, with a net loss of 172,000 over the past five years. Four of its five 2M+ metros — Los Angeles, San Francisco, San Diego, and Sacramento — rank in the bottom half of the 35 largest metros for 5-year population growth, with Los Angeles and San Francisco ranking 1st and 2nd slowest, respectively. Riverside is the only California metro with modestly positive recent growth, ranking just above the midpoint. The combination of housing costs that are among the highest in the nation, a regulatory environment that constrains new supply, and state income tax rates reaching 13.3% has structurally repositioned California from the country’s primary growth engine to a net exporter of residents to lower-cost states.
What to Watch — Will Domestic Migration Patterns Moderate or Reaccelerate?
Factors favoring continued Sunbelt and Mountain West growth:
- Relative housing costs between growth and mature metros remain wide. The FHFA House Price Index shows Northeastern and West Coast metros still appreciating faster than many Sunbelt markets in 2025 (see Home Affordability Crisis).
- Approximately 4.1 million Americans turn 65 each year through 2030, and retiree migration has historically skewed heavily toward warmer, lower-cost states (see Senior Population Growth and Senior Living Demand).
- Employment growth in technology, logistics, and healthcare continues to concentrate in growing metros in the Sunbelt and Mountain West regions.
Headwinds to continued domestic migration:
- The sharp decline in net international migration — from 2.7 million in 2024 to 1.3 million in 2025, with the Census Bureau projecting a further decline to approximately 321,000 by mid-2026 — reduces the total pool of new residents available to any metro.
- Domestic birthrates continue to fall, with natural increase contributing just 519,000 people nationally in 2025 versus 1.6–1.9 million annually during the 2000s.
If reduced immigration persists, overall U.S. population growth could approach the pandemic-era lows even without an economic shock, constraining demand formation in both growth and mature markets.
Sources to Track Domestic Migration in 2026:
| Source | Next Release | Date | Notes |
|---|---|---|---|
| Census Bureau — Vintage 2026 State Estimates | State totals & components of change | Expected December 2026 | First read on whether the 2025 slowdown extended into 2026 |
| Census Bureau — ACS | 2024 1-year estimates | September 2025 (released) | County-to-county migration flows, housing cost burden, commuting patterns |
| IRS — SOI Migration Data | Tax year 2023 state-to-state flows with AGI | Expected mid-2026 | Tracks not just headcount but income flows between states |
Notes
[1] Top ten states by net population growth, 2000–2025: Texas (+10.8M), Florida (+7.4M), California (+5.4M), North Carolina (+3.1M), Georgia (+3.1M), Arizona (+2.5M), Washington (+2.1M), Virginia (+1.8M), Colorado (+1.7M), Tennessee (+1.6M). Eight of ten are in the South or Mountain West; the exceptions are California and Washington. ↩
[2] Top ten states by net population growth, 2015–2025: Texas (+4.2M), Florida (+3.2M), North Carolina (+1.2M), Georgia (+1.1M), Washington (+834K), Arizona (+791K), Tennessee (+720K), New Jersey (+678K), South Carolina (+674K), Colorado (+558K). Eight of ten are in the South or Mountain West; the exceptions are New Jersey and Washington. ↩
[3] U.S. Census Bureau, “U.S. Population Growth Slows Due to Historic Decline in Net International Migration,” press release, January 27, 2026. Net international migration projections from Census Bureau Random Samplings blog, January 27, 2026. The 2024–2025 estimate period spans the final six months of the Biden administration and the first six months of the current administration; the Census Bureau noted that policy changes may take time to have full effect on migration patterns. ↩
Sources
1. U.S. Census Bureau. Vintage 2025 State Population Estimates (January 2026). census.gov/popest/2020s-state-total
2. U.S. Census Bureau. Annual and Cumulative Estimates of the Components of Resident Population Change: Vintage 2025 (NST-EST2025-COMP) (January 2026). census.gov/popest/2020s-state-total
3. U.S. Census Bureau. Intercensal State Population Estimates: 2000–2010. census.gov/popest/intercensal-2000-2010
4. U.S. Census Bureau. Vintage 2020 State Population Estimates: 2010–2020. census.gov/popest/2020s-state-total
5. U.S. Census Bureau. “U.S. Population Growth Slows Due to Historic Decline in Net International Migration.” Press release (January 27, 2026). census.gov/newsroom/2026/population-growth-slows
6. U.S. Census Bureau. “New Population Estimates Show Historic Decline in Net International Migration.” Random Samplings blog (January 27, 2026). census.gov/random-samplings/2026/01
7. IRS Statistics of Income. Migration Data: State-to-State Flows (Filing Years 1991–2022). irs.gov/soi-tax-stats-migration-data
Companion workbook. demographics-domestic-migration.xlsx — MSA population data (393 MSAs, 2000–2025), Growth Quotient analysis for 2M+ metros, state point allocation tables, and city-level tables for incorporated places of 20,000+ (2020–2025)
Methodology & Data Notes
State Population Data
State-level population figures use July 1 reference dates throughout, drawn from three Census Bureau series: Intercensal Estimates (2000–2009), Vintage 2020 Estimates (2010–2019), and Vintage 2025 Estimates (2020–2025). State boundaries do not change, so all periods are directly comparable. Totals include 50 states, the District of Columbia, and Puerto Rico. The Census Bureau’s headline national population figure of 341.8 million excludes Puerto Rico; the spreadsheet totals including Puerto Rico sum to approximately 345.0 million. Components of population change (net domestic migration, net international migration, and natural change) are from the Census Bureau’s Vintage 2025 components-of-change series (NST-EST2025-COMP) and cover July 2024 to July 2025; component sums differ from net population change by a small statistical residual.
Growth Rate Calculations
CAGR (Compound Annual Growth Rate) = (End/Start)^(1/n) – 1, where n is the number of years. Cumulative growth = (End – Start) / Start. All growth rate columns in the spreadsheets are live Excel formulas that recalculate automatically when source data is updated.