U.S. Industrial Regional Analysis: Q1 2026
▸ THIS SECTION INCLUDES PROPRIETARY DATA AND IS NOT AVAILABLE FOR PUBLIC USE
All data: CoStar, U.S. Industrial National Historical Data (March 2026).
The charts below include all CoStar-defined MSAs with industrial inventory of at least 100M SF.
Industrial Deliveries by Census Region — Trailing 12 Months (March 2026)
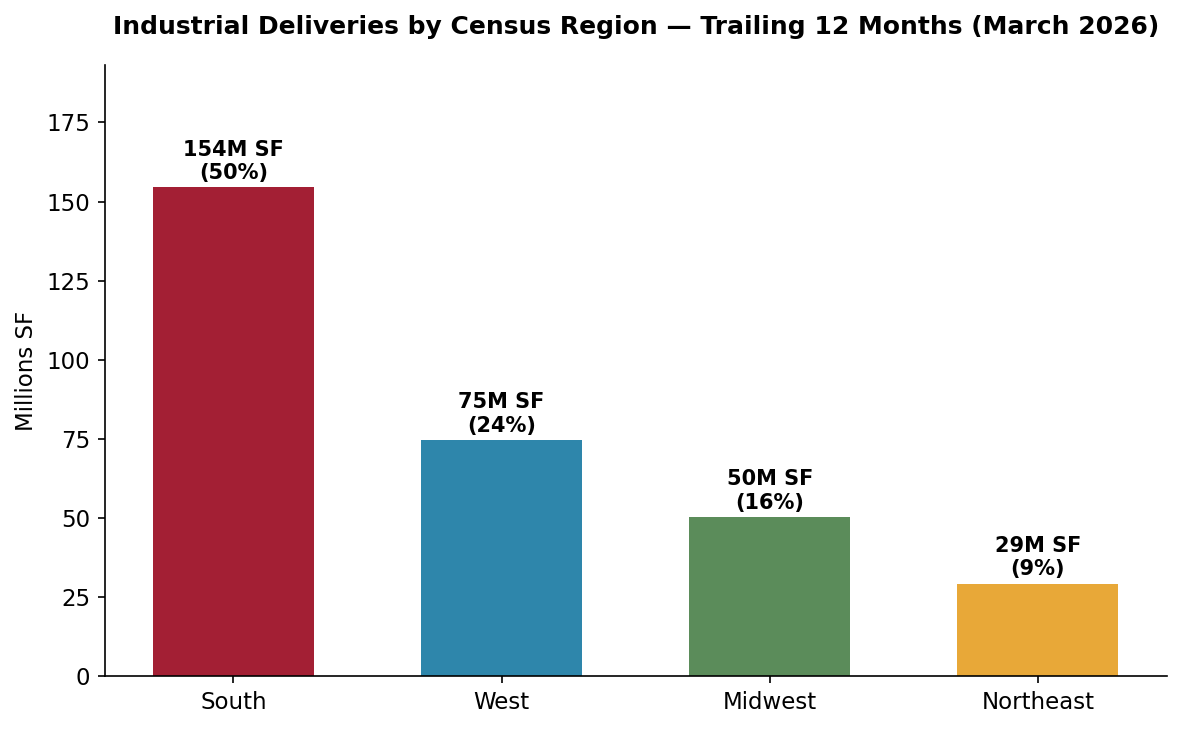
Source: CoStar, March 2026. 75 MSAs with 100M+ SF industrial inventory, grouped by Census region.
Industrial Vacancy Rate by Census Region — Inventory-Weighted (March 2026)
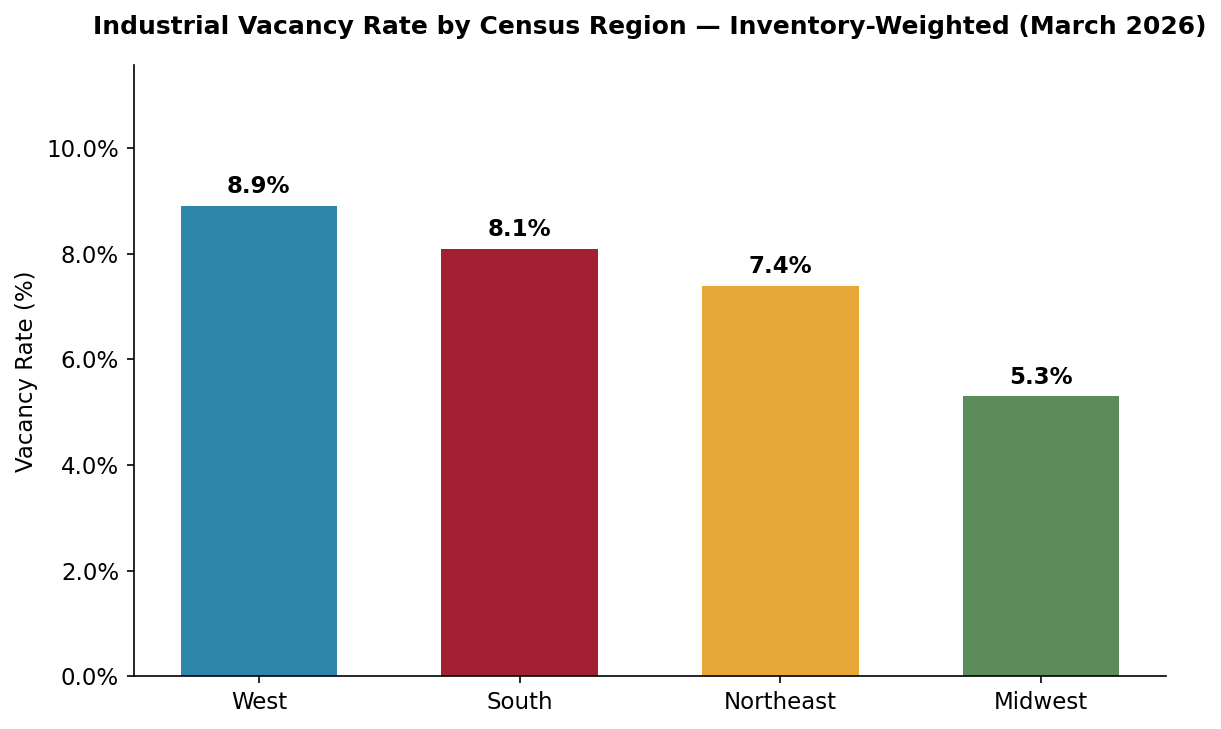
Source: CoStar, March 2026. Weighted by inventory SF across 75 MSAs with 100M+ SF industrial inventory.
Markets with Negative Rent Growth by Census Region (March 2026)
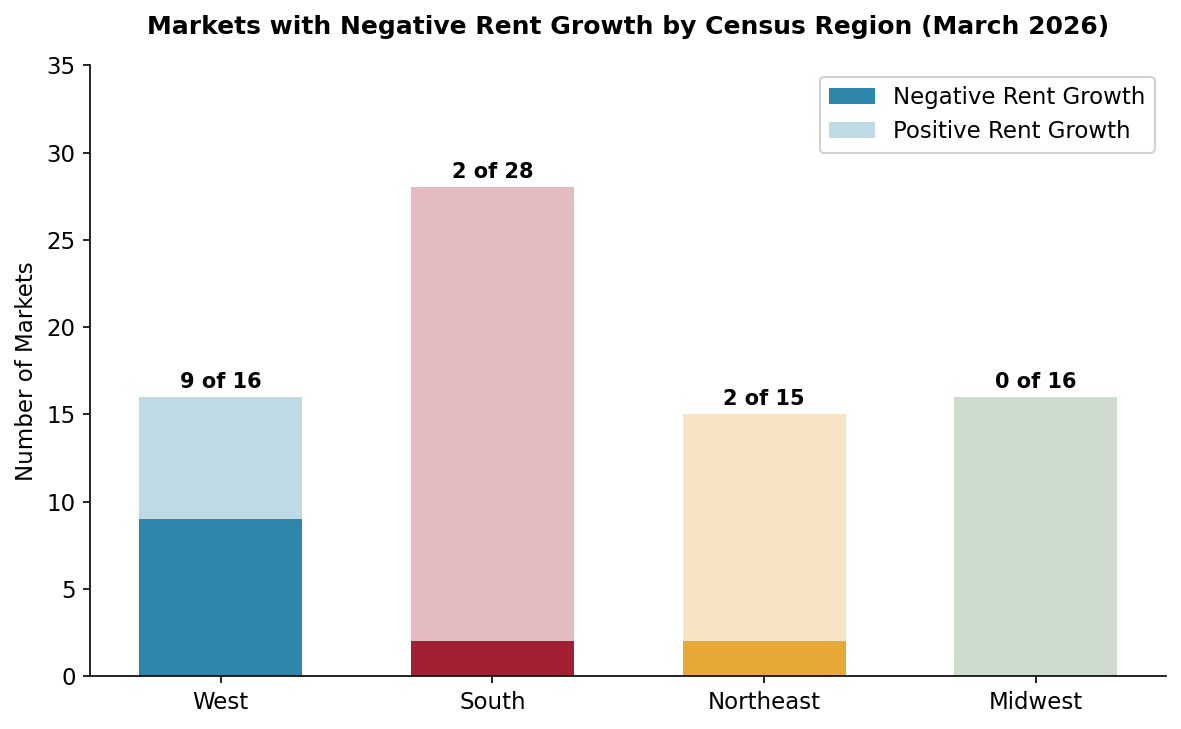
Source: CoStar, March 2026. 75 MSAs with 100M+ SF industrial inventory.
Document Links
industrial-regional-divergence.xlsx — Regional summary and 75-market detail with vacancy, rents, deliveries, absorption, and sale prices. CoStar, March 2026.
Key Observations
Context & Discussion
The E-Commerce Construction Wave and Its Aftermath
The pandemic-era surge in e-commerce penetration triggered the largest industrial construction boom in U.S. history. National industrial deliveries peaked above 500 million SF annually in 2023, driven by Amazon, third-party logistics providers, and speculative developers responding to warehouse demand that appeared insatiable. Southern and Western markets led the wave: Dallas–Fort Worth, Houston, Phoenix, and the Inland Empire each absorbed tens of millions of square feet annually during 2021–2022 while maintaining sub-5% vacancy rates.
2024–2026: E-commerce growth rates have normalized, Amazon has consolidated its logistics footprint after pandemic-era overexpansion (although recently began expanding again at a more measured pace than 2020–2023), and persistently elevated interest rates have reduced both speculative development and corporate capital expenditure plans. The 308.5 million SF delivered in the trailing twelve months through March 2026 represents a significant decline from the peak but remains elevated relative to pre-pandemic norms of approximately 200–250 million SF annually. Construction starts have fallen dramatically in most markets, although bolstered significantly if data centers are included in the statistics.
Western Region Correction
California’s industrial markets face a unique combination of over-supply and cost pressures. The Inland Empire—the nation’s largest logistics corridor—added nearly 14 million SF in the trailing twelve months while posting 8.9% vacancy and –2.3% rent growth. Los Angeles, constrained by land scarcity and high development costs, nonetheless saw rents decline 3.8% year-over-year as tenants consolidated or relocated to lower-cost inland locations.
Beyond California, Denver (–2.2% rent growth, 9.3% vacancy) and Las Vegas (11.8% vacancy) are absorbing significant speculative pipelines built during the boom. Salt Lake City, Reno, and Phoenix round out a Western region where nearly every major market is experiencing some combination of rising vacancy and flat-to-negative rent growth.
Midwest Supply Constraints
Midwestern industrial markets were not immune to the construction boom, but their pipelines were proportionally smaller and their demand fundamentals more durable. Chicago, the nation’s largest industrial market by inventory (1.38 billion SF), delivered 8.7 million SF while maintaining 5.4% vacancy and 4.4% rent growth. Kansas City delivered 12.3 million SF—among the largest pipelines nationally—but its intermodal rail hub and central distribution location sustained absorption. The region’s weighted average under-construction pipeline of 1.2% of inventory compares favorably to the South’s 2.7%.
Lower land and construction costs in the Midwest produce lower rents ($8.40/SF weighted average) that limit speculative overbuilding. Rents are generally lower in the Midwest, whereas construction costs remain high nationally, driven by labor and material constraints. We see a similar dynamic in multifamily in the Midwest, which has led (in both cases) to reduced supply in spite of gradually increasing demand (after years of decline) and consequently lower vacancy rates and rising rents.
The South: Volume Leader with Diverging Submarket Stories
The South’s 154.4 million SF in trailing-twelve-month deliveries masks significant variation across its 28 major markets. Dallas–Fort Worth and Houston together accounted for 48.3 million SF—31% of the region’s total—and are absorbing new supply at varying rates. Austin stands out with 14.5% vacancy and 8.5% of inventory under construction, the highest pipeline concentration among all 75 markets (although this includes large owner-occupied projects including Tesla, Samsung, as well as data centers). At the other end, Birmingham (4.4% vacancy), Tulsa (4.4%), and Greensboro (4.6%) reflect tighter conditions in smaller, less speculative Southern markets.
What to Watch in 2026
The industrial regional divergence story will be shaped by several factors: the pace of Western rent correction (particularly in California), the trajectory of e-commerce demand growth, tariff and trade policy effects on port-proximate vs. inland distribution, and the continued buildout of nearshoring-driven manufacturing in the South and Midwest. The Inland Empire’s absorption rate, Austin’s pipeline digestion, and the Midwest’s ability to maintain sub-6% vacancy will be key indicators. We will continue to track deliveries, starts, absorption, and trade policy developments that may shift the geography of industrial demand.
Sources to Track U.S. Industrial Regional Dynamics in 2026:
| Source | Next Release | Date | Notes |
|---|---|---|---|
| CoStar | Quarterly MSA-level industrial update | Ongoing (subscription) | Vacancy, rents, deliveries, starts, and absorption for 395 MSAs |
| CBRE | U.S. Industrial & Logistics Figures | Quarterly | National and market-level vacancy, rent, and absorption trends |
| U.S. Census Bureau | New Residential & Nonresidential Construction | Monthly | Warehouse and manufacturing construction spending by region |
Notes
[1] CoStar. U.S. Industrial Market Data — All Cities (March 2026). costar.com. Includes trailing-twelve-month data for 75 MSAs with 100 million+ SF industrial inventory. Regional aggregations by CRE42 using Census region definitions (Northeast, Midwest, South, West). Vacancy rates are inventory-weighted. Washington, D.C. and Baltimore are classified as South per Census convention. ↩
Methodology & Data Notes
Data Source & Regional Classification
Market-level data sourced from CoStar’s U.S. Industrial dataset, downloaded March 2026. The dataset includes 395 MSAs; this analysis filters to the 75 MSAs with industrial inventory of 100 million+ SF. Markets were assigned to Census regions (Northeast, Midwest, South, West) by CRE42 based on the primary state of each MSA. Washington, D.C. and Baltimore are classified as South per Census convention.
Weighted Averages
Regional vacancy rates are calculated as inventory-weighted averages: the sum of (vacancy rate × inventory SF) for all markets in the region, divided by total regional inventory SF. Regional asking rents and sale prices are calculated using the same inventory-weighted approach. This methodology ensures that larger markets exert proportionally greater influence on regional averages.