U.S. Industrial Supply & Demand Cycle: 2000–2026
▸ THIS SECTION INCLUDES PROPRIETARY DATA AND IS NOT AVAILABLE FOR PUBLIC USE
All data: CoStar, U.S. Industrial National Historical Data (March 2026).
Overview
U.S. Industrial Net Delivered SF (2000–2026 YTD)
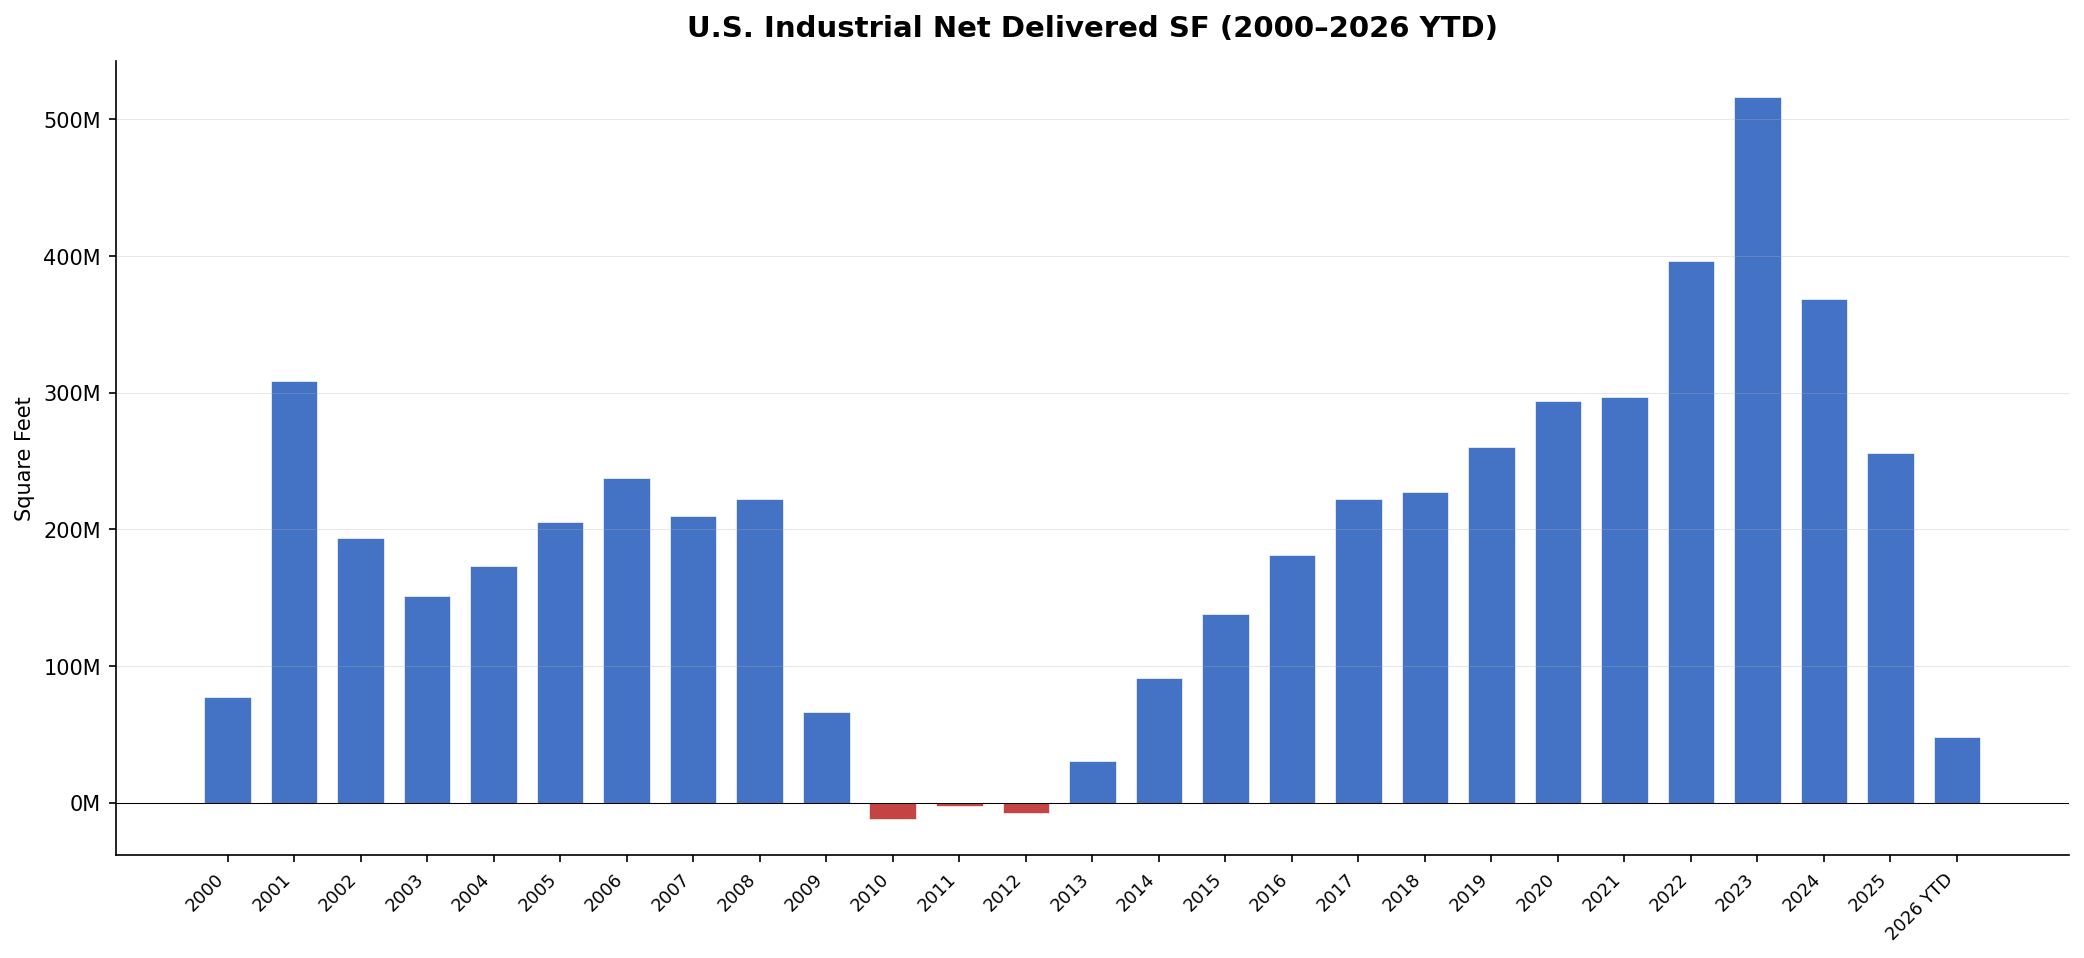
Source: CoStar, March 2026
U.S. Industrial Deliveries, Absorption & Vacancy (2000–2026 YTD)
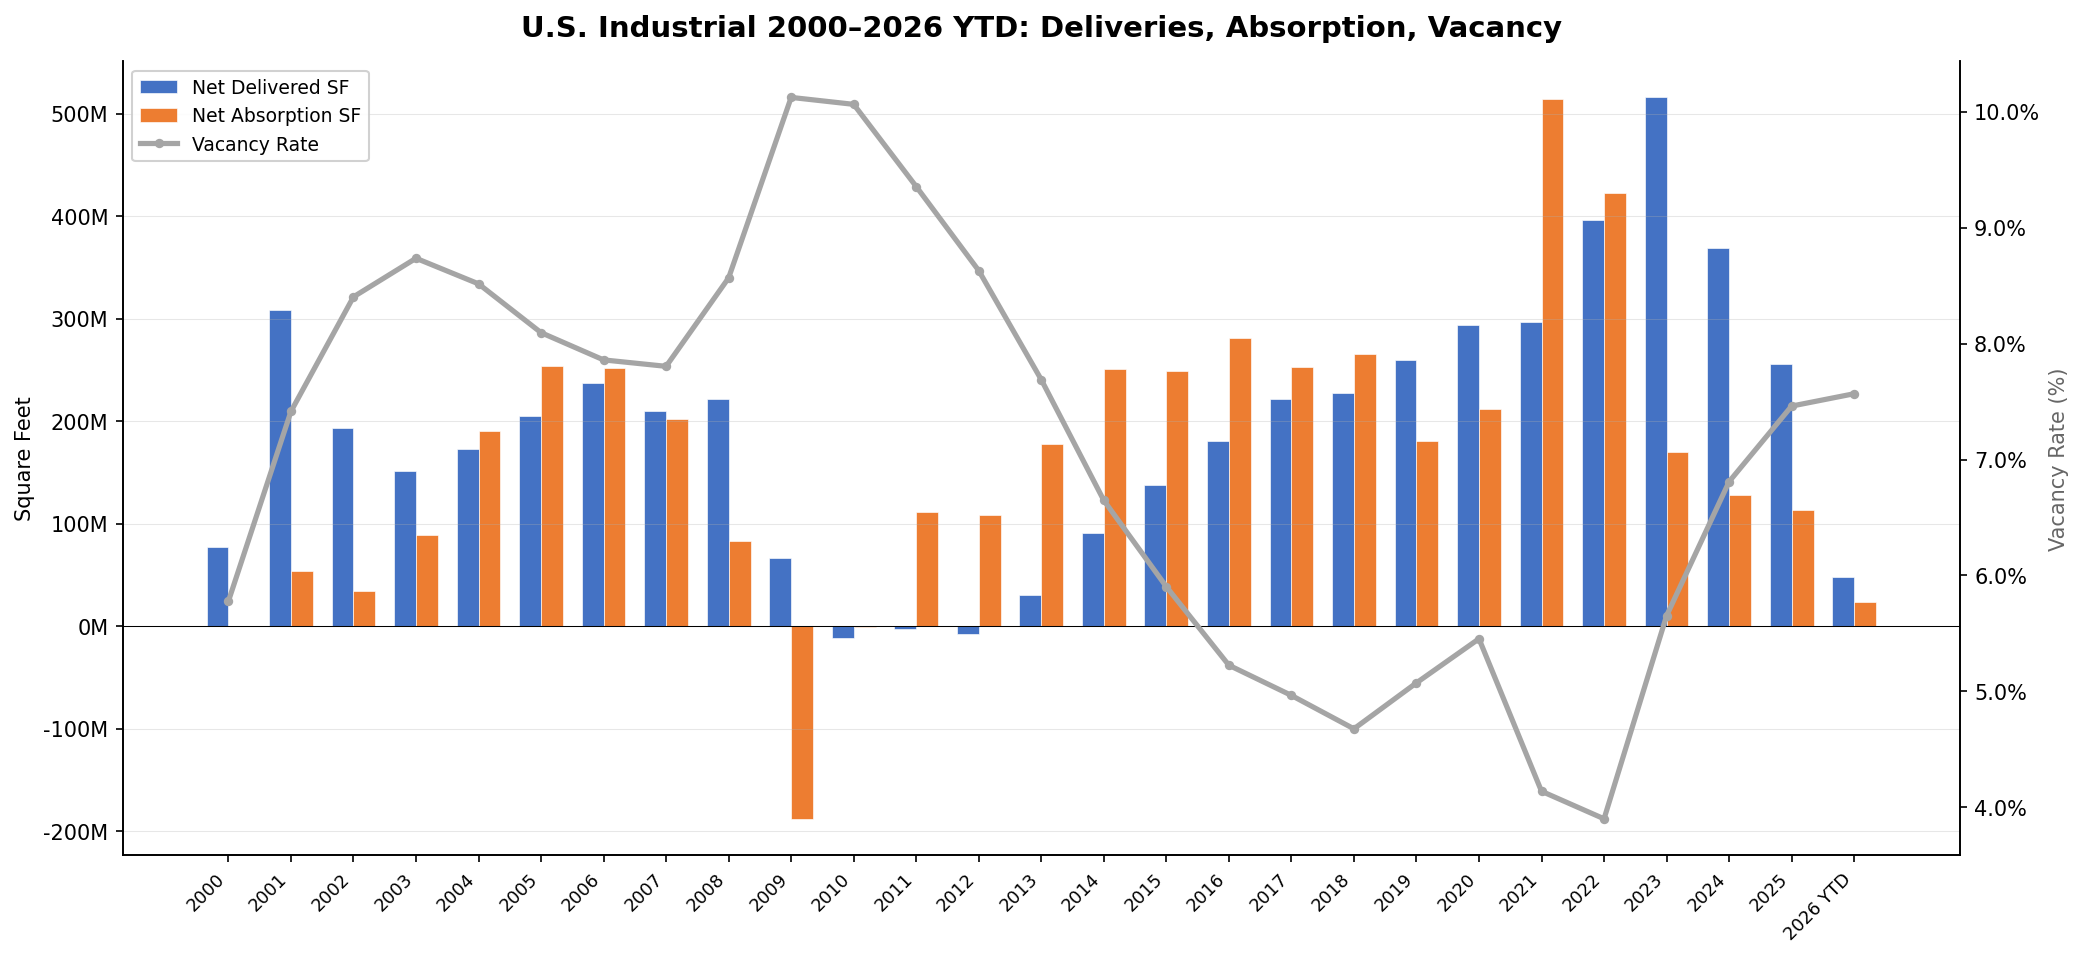
Source: CoStar, March 2026
U.S. Industrial Vacancy vs. Market Asking Rent (2000–2026 YTD)
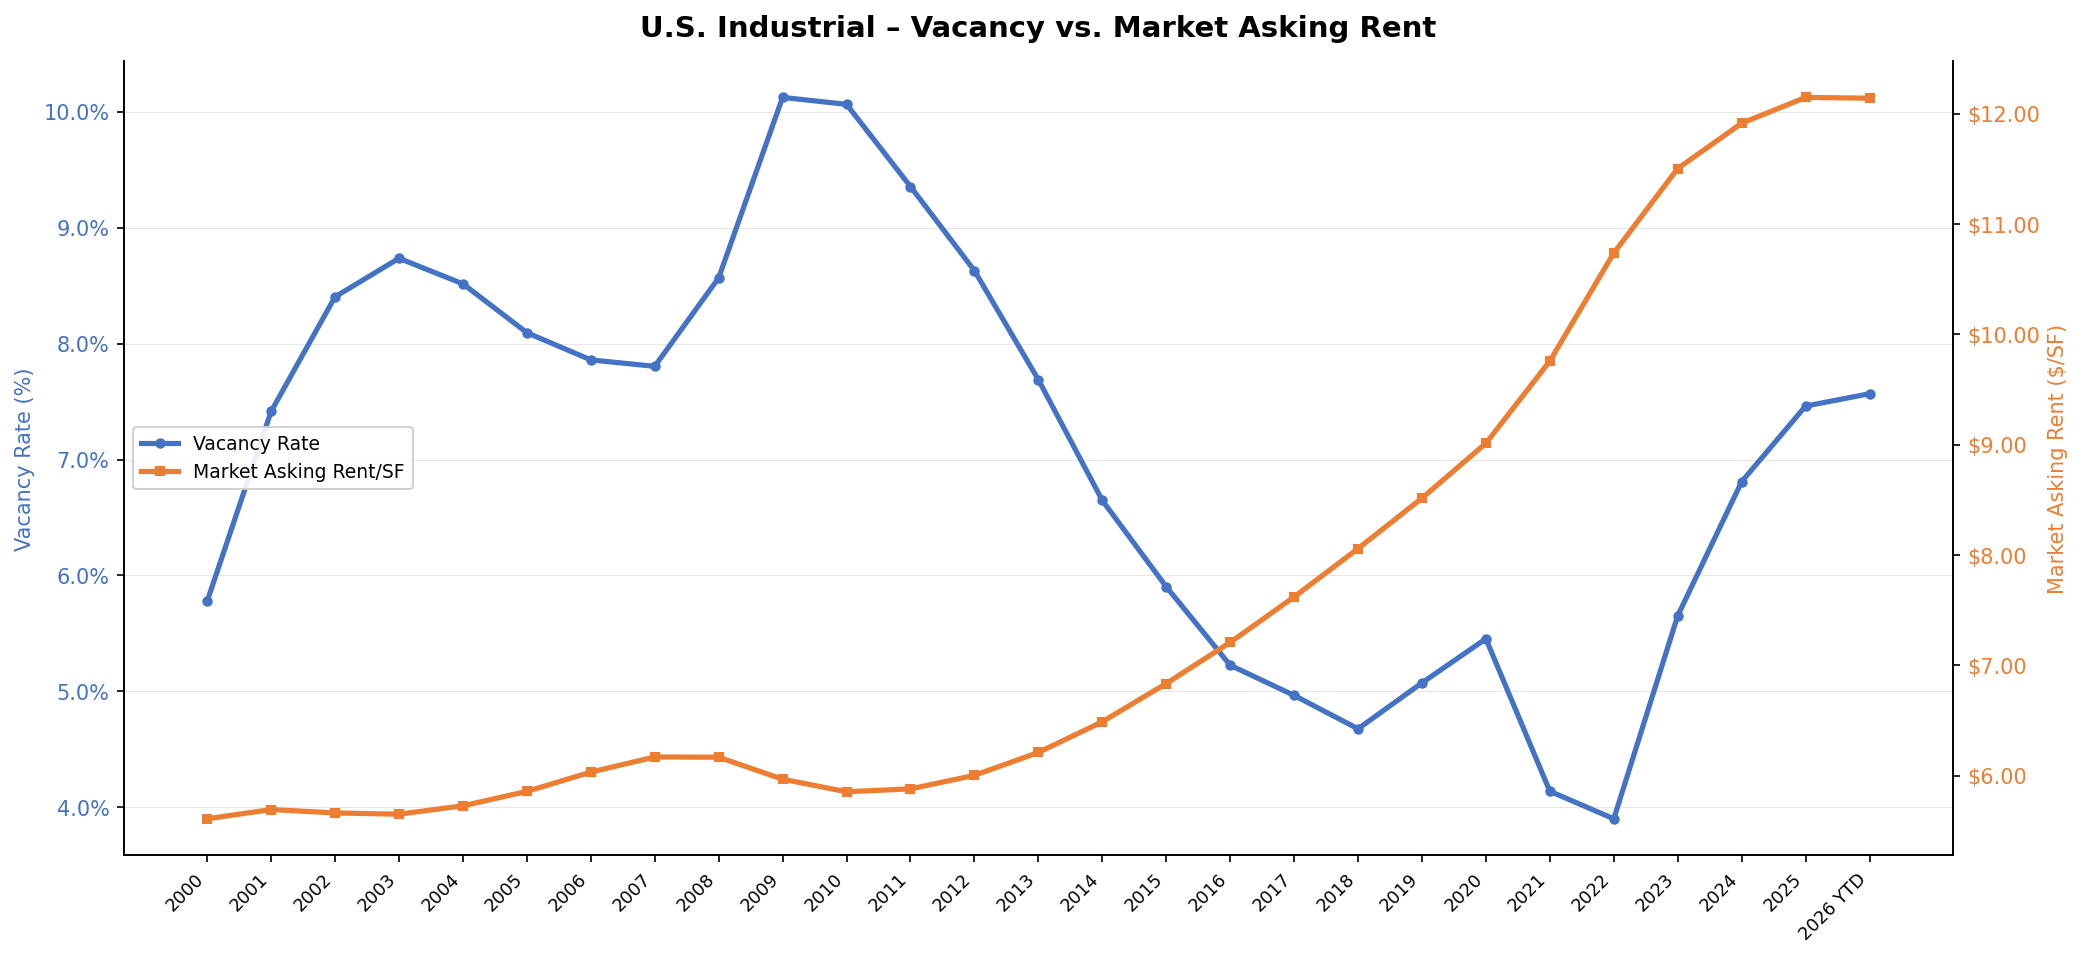
Source: CoStar, March 2026
U.S. Industrial Deliveries vs. Construction Starts (Prior 2-Year Average)
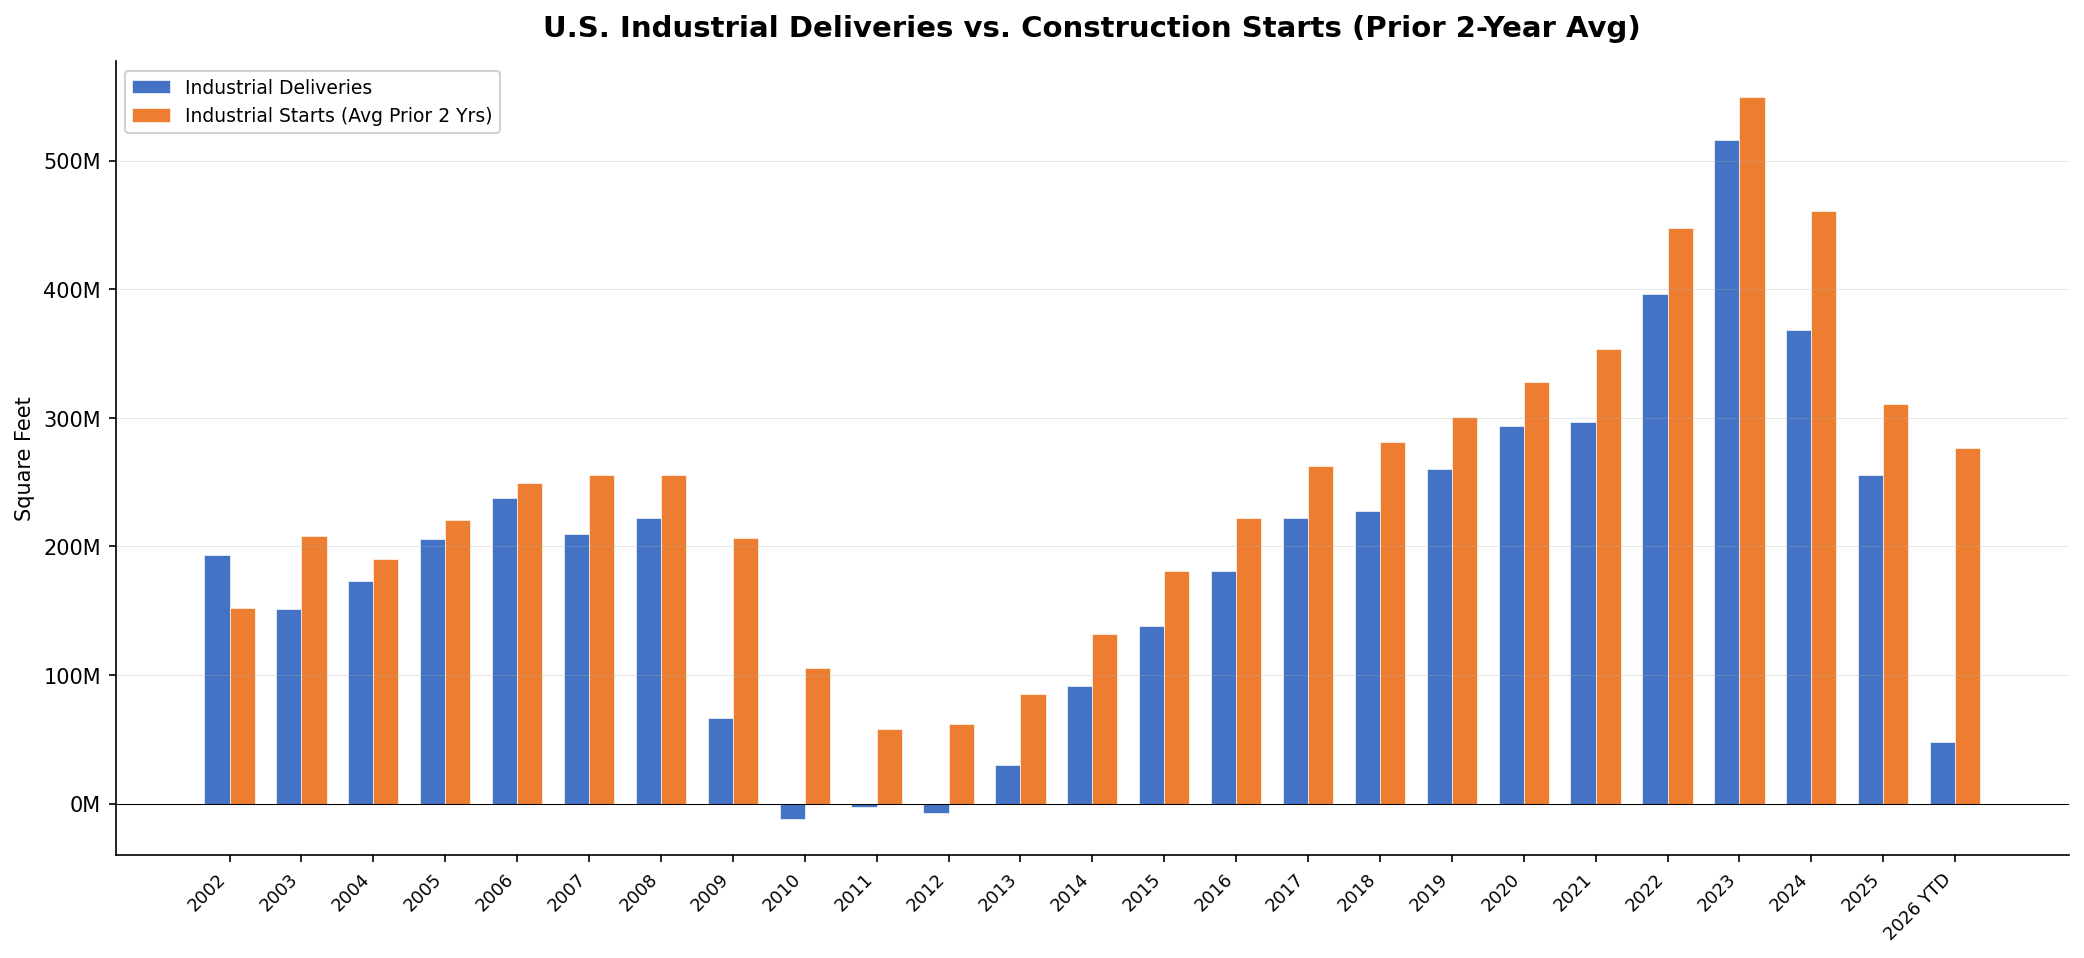
Source: CoStar, March 2026. Correlation between annual deliveries and prior 2-year average starts ≈ 0.92.
Document Links
industrial-national-supply-cycle.xlsx — National industrial historical data (2000–2026 YTD) with native charts. CoStar, March 2026.
Key Observations
Context & Discussion (Post-Pandemic Period)
Post-Pandemic Construction Boom
The 2020–2024 industrial construction boom was the largest sustained period of warehouse and distribution development in at least 25 years. From 2020 through 2024, U.S. builders delivered approximately 1.87 billion SF of net new industrial space, almost double the roughly 1.03 billion SF during the preceding five-year period (2015–2019). The boom was driven by ecommerce, expanding retailer and manufacturer inventories following the 2021–2022 supply-chain disruptions, historically attractive borrowing terms and interest rates, and a flood of capital coming out of office investment. Construction starts peaked at 577 million SF in 2022 and space under construction reached 662 million SF (3.7% of inventory), by far the highest proportion since at least 2000.
Demand Correction
Net absorption peaked at 514 million SF in 2021 before declining sharply to 113 million SF in 2025, as pandemic-era demand drivers faded and tenants absorbed existing commitments. The 2021 absorption spike reflected extraordinary conditions: retailers scrambled to stockpile inventory following supply-chain disruptions, e-commerce firms expanded fulfillment networks aggressively, and third-party logistics (3PL) providers leased speculative space in advance of anticipated demand. By 2023, much of this demand had been satisfied. 516 million SF was delivered in 2023 against only 170 million SF of absorption, pushing vacancy up 180 bps in a single year.
Rent Resilience Despite Rising Vacancy
Industrial asking rents have risen in every year since 2010, including during the current vacancy correction, reflecting a structural repricing of warehouse and distribution space. Market asking rent reached $12.15/SF in 2025, up 43% from $8.52 in 2019. This pattern contrasts with the GFC period, when rents declined approximately 5% as vacancy rose from 7.8% to 10.1%. The current rent resilience reflects several factors: much of the new supply consists of modern, high-clear-height facilities commanding premium rents; construction pricing has outpaced general inflation since 2000 and remains significantly elevated; in-place rents signed during 2018–2021 are substantially below current market rates, limiting downward pressure as leases roll. Rent growth has, however, decelerated from 10% or higher in 2021–2022 to approximately 2% in 2025.
Starts-to-Deliveries Pipeline
Starts averaged roughly 276 million SF annually in 2024–2025, down from 577 million SF in 2022. The pipeline points to deliveries normalizing toward 250–300 million SF annually by 2027, roughly in line with or slightly above the 2015–2019 average. Much of the recent and pending new supply is concentrated in southern growth metros, now racing to absorb new product before the next development cycle hits.
What to Watch in 2026
E-commerce growth trajectory and inventory-to-sales ratios are the most consequential near-term demand drivers. U.S. e-commerce penetration continues to rise, supporting structural demand for last-mile and regional distribution facilities. However, the pace of growth has normalized from the pandemic-era surge, and further upside depends on whether consumers continue shifting spending online at a rate sufficient to generate incremental warehouse demand beyond the capacity already built.
Nearshoring and tariff-driven supply-chain reconfiguration may generate a second wave of industrial demand. Reshoring and friend-shoring initiatives—accelerated by tariff policy and geopolitical risk—are driving new manufacturing and distribution facility construction, particularly in border markets (Laredo, El Paso), southeastern ports (Savannah, Charleston), and Midwest logistics hubs. The extent to which this demand offsets the post-pandemic absorption slowdown will be a key variable for vacancy trajectory through 2027.
Sources to Track U.S. Industrial Supply in 2026:
| Source | Report / Series | Frequency | Notes |
|---|---|---|---|
| CoStar | Quarterly national and MSA-level update | Quarterly | Most granular source for deliveries, starts, absorption, vacancy, and availability by submarket |
| CBRE | U.S. Industrial & Logistics Figures | Quarterly | National summary with metro-level detail; tracks net absorption, vacancy, rent growth, and investment volume |
| Prologis Research | Logistics Rent Index; Market Update | Quarterly | Largest global industrial REIT; proprietary data on effective rents, tenant demand, and utilization rates |
| U.S. Census Bureau | Construction Spending: Warehouse | Monthly | Dollar-denominated construction put in place for warehouse buildings; captures spending trajectory |
Notes
[1] CoStar. U.S. Industrial National Historical Data (March 2026). costar.com. Includes annual data for inventory, net delivered SF, construction starts, net absorption, vacancy rate, availability rate, asking rent/SF, rent growth, and under-construction SF for the U.S. industrial market, 2000–2026 YTD. ↩
Methodology & Data Notes
Data Source & Period
All national industrial data sourced from CoStar’s U.S. Industrial National Historical dataset, downloaded March 2026. The dataset covers annual observations from 2000 through 2025, plus year-to-date 2026 (through approximately March 2026). “Net Delivered SF” subtracts demolished square footage from gross deliveries; negative values indicate net inventory contraction (as observed in 2010–2012). “Construction Starts” represents the square footage of industrial projects that broke ground in each calendar year. “Net Absorption” represents the change in occupied square footage over the period. Net absorption data begins in 2001.
Starts-to-Deliveries Correlation
The correlation of approximately 0.92 is calculated between annual net delivered SF and the simple average of construction starts from the two preceding calendar years (e.g., 2025 deliveries correlated with the average of 2023 and 2024 starts). The two-year lag reflects the typical construction timeline for industrial projects (18–24 months). Data begins in 2002 (earliest year with two prior years of starts data).
Vacancy Rate vs. Availability Rate
Vacancy rate represents the percentage of total inventory that is physically vacant at period end. Availability rate is a broader measure that includes vacant space plus occupied space listed for sublease or anticipated to become available at lease expiration. Availability rate data begins in 2004 in the CoStar dataset. The gap between availability and vacancy widened to approximately 150 bps as of early 2026, reflecting sublease space entering the market as tenants right-size footprints.
Rent Data & Industrial Property Types
Market asking rent represents the CoStar-weighted average asking rent per SF across the full industrial inventory, including warehouse/distribution, flex/R&D, and manufacturing space. The U.S. industrial market tracked by CoStar totals approximately 19.3 billion SF as of early 2026. Rent growth data begins in 2001.