Overview
The Consumer Price Index rolls dozens of categories into a single number. As of February 2026, that number was 2.4% year-over-year.[1] The single figure is useful shorthand, but it obscures the variability of the components. Post-pandemic inflation can be broadly characterized by three parallel dynamics: consistent services inflation driven by labor costs, volatile goods inflation, and episodic energy price swings driven by geopolitics and supply constraints.
This section examines the primary inflation components, with particular attention to construction cost inflation and the labor-demographic forces.
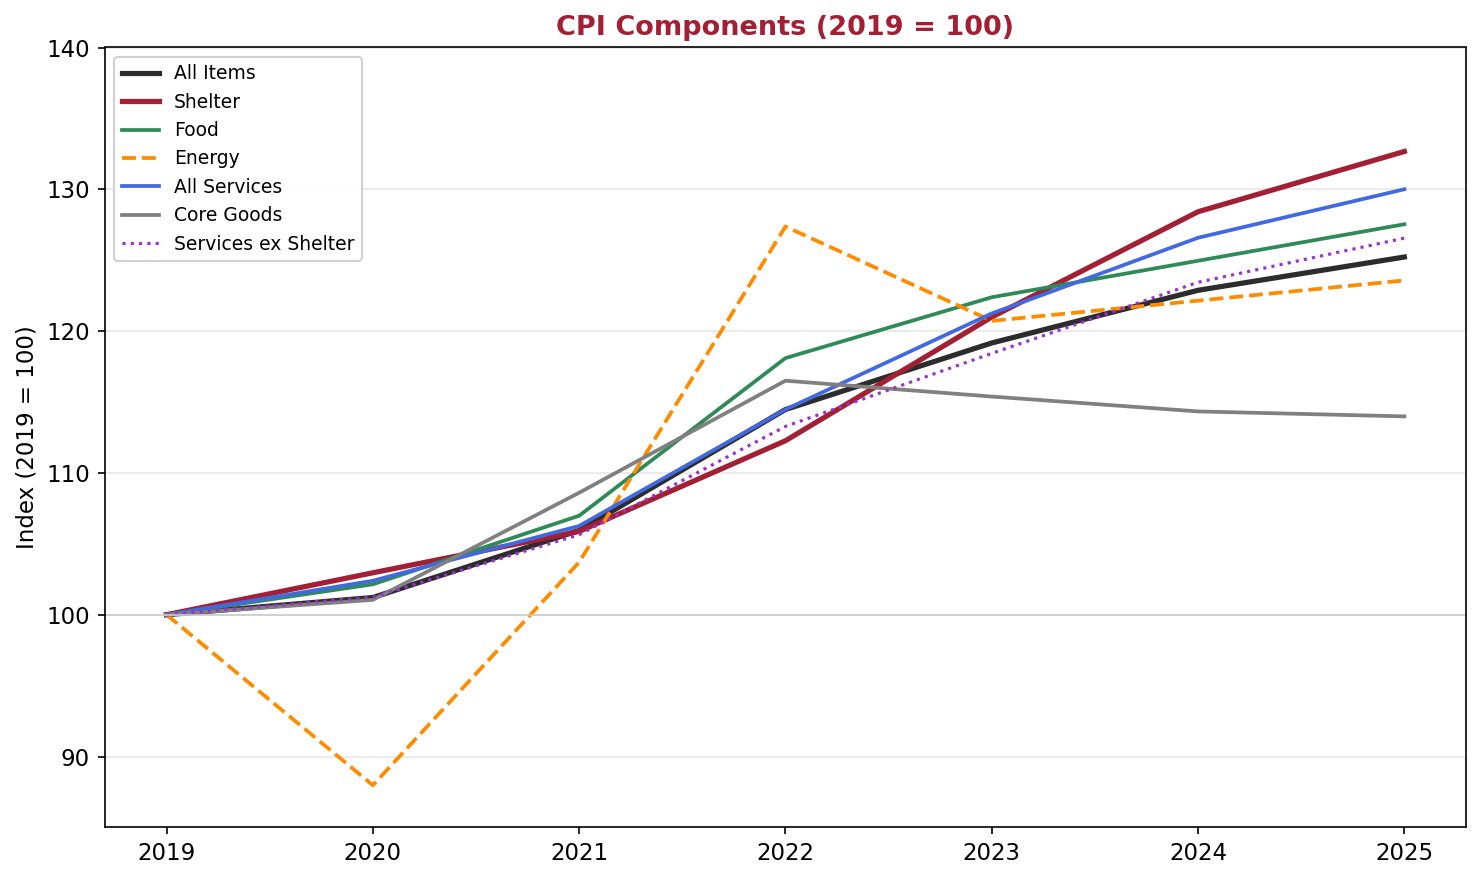
CPI Components Indexed (2019 = 100) | Source: BLS CPI-U via FRED | Chart: CRE42
Document Links
inflation-by-category.xlsx — CPI component data, services and goods breakdowns, construction costs, wage growth by sector
Services Inflation
Services account for roughly 60% of the CPI basket and have approximately doubled since 2000 (+101%). Services are divided into two parts: shelter (approximately 36% of CPI, discussed separately below) and non-shelter services—healthcare, food away from home, motor vehicle repair, education, recreation—which rose approximately 97% over the same period.[2]
The common thread is labor intensity. These categories cannot be imported and are difficult to automate. A hospital stay, a restaurant meal, a haircut, and a roof repair all require a physical person in a specific location. When the labor pool for those roles tightens, wages rise and pass through to consumer prices.
| CPI Service Category | 2022 | 2023 | 2024 | 2025 |
|---|---|---|---|---|
| Hospital & Related Services | 3.0% | 0.8% | 4.0% | 6.7% |
| Food Away from Home | 8.5% | 5.2% | 3.6% | 4.1% |
| Motor Vehicle Insurance | 14.2% | 20.2% | 11.5% | 11.7% |
| Motor Vehicle Repair | 8.9% | 7.4% | 5.8% | 4.8% |
| Recreation Services | 6.4% | 3.5% | 2.0% | 3.0% |
BLS CPI-U, December-over-December, not seasonally adjusted. Hospital services YoY in 2025 was the largest annual increase since 2010.[3]
Motor vehicle insurance is classified as a service even though it is associated with a goods purchase. The persistent double-digit increases reflect the cost of repair labor, replacement parts, and medical claims—all of which are themselves labor-intensive and rising.
The Shelter Lag and the OER Debate
Shelter is the single largest CPI component at approximately 36% of headline and 42% of core CPI. Owners’ Equivalent Rent (OER), which accounts for roughly 26% of headline CPI alone, is constructed from a BLS survey asking homeowners what they believe their home would rent for—not from transaction data.[4]
CPI shelter carries a well-documented lag relative to market rent indices. Brookings Institution and Richmond Fed research place the lag at 12–18 months, reflecting the slow turnover of the existing lease stock (most leases are 12-month terms) and the tendency of landlords to smooth rent increases for continuing tenants. As a result, CPI shelter was still above 3% year-over-year for 53 consecutive months through February 2026 (per Zelman & Associates), even as private indices—Zillow Observed Rent Index, CoreLogic Single Family Rent Index, and RealPage new-lease data—showed rent growth near or below pre-pandemic norms in many markets.[5]
Industry figures including Walker & Dunlop CEO Willy Walker and economist Peter Linneman have argued that OER and the CPI shelter methodology overstated actual shelter inflation through 2024–2025, particularly in Sunbelt markets where effective rents (net of concessions) were flat or declining. The BLS samples smaller, tertiary rental markets more heavily than large institutional-grade assets, further widening the gap between official statistics and what multifamily operators observe.[6]
CPI All Items less shelter ran at 2.4% year-over-year in December 2025, increasing to 2.7% with shelter included. CPI shelter inflation is a lagging indicator and appears to have decelerated in actual markets at least one year before CPI measurements reflected the change, consistent with many past movements.
Goods Inflation
Core goods (commodities less food and energy) rose approximately 9% in total from 2000 to 2025.[7] For two decades, globalization and technology held traded-goods inflation near zero, before pandemic-related trade disruptions created rapid price moves for all kinds of goods. Used cars spiked 37% in 2021 alone, furniture rose 14%, and consumer goods broadly surged. Most have since returned to trend or deflated in a kind of bounce-back supply recovery.
| Category | 2020 | 2021 | 2022 | 2023 | 2024 | 2025 |
|---|---|---|---|---|---|---|
| Used Cars & Trucks | -1.6% | +37.2% | -8.3% | -1.6% | -3.7% | -3.3% |
| Eggs | +4.2% | +11.3% | +59.6% | -22.2% | +37.0% | -8.2% |
| Gasoline | -15.3% | +49.3% | -1.7% | -1.8% | +0.3% | -3.4% |
| Furniture & Bedding | -0.8% | +13.8% | +4.4% | -6.5% | -4.3% | -2.0% |
| Apparel | -3.7% | +5.3% | +2.8% | -1.7% | +1.2% | +1.9% |
BLS CPI-U, December-over-December, not seasonally adjusted.
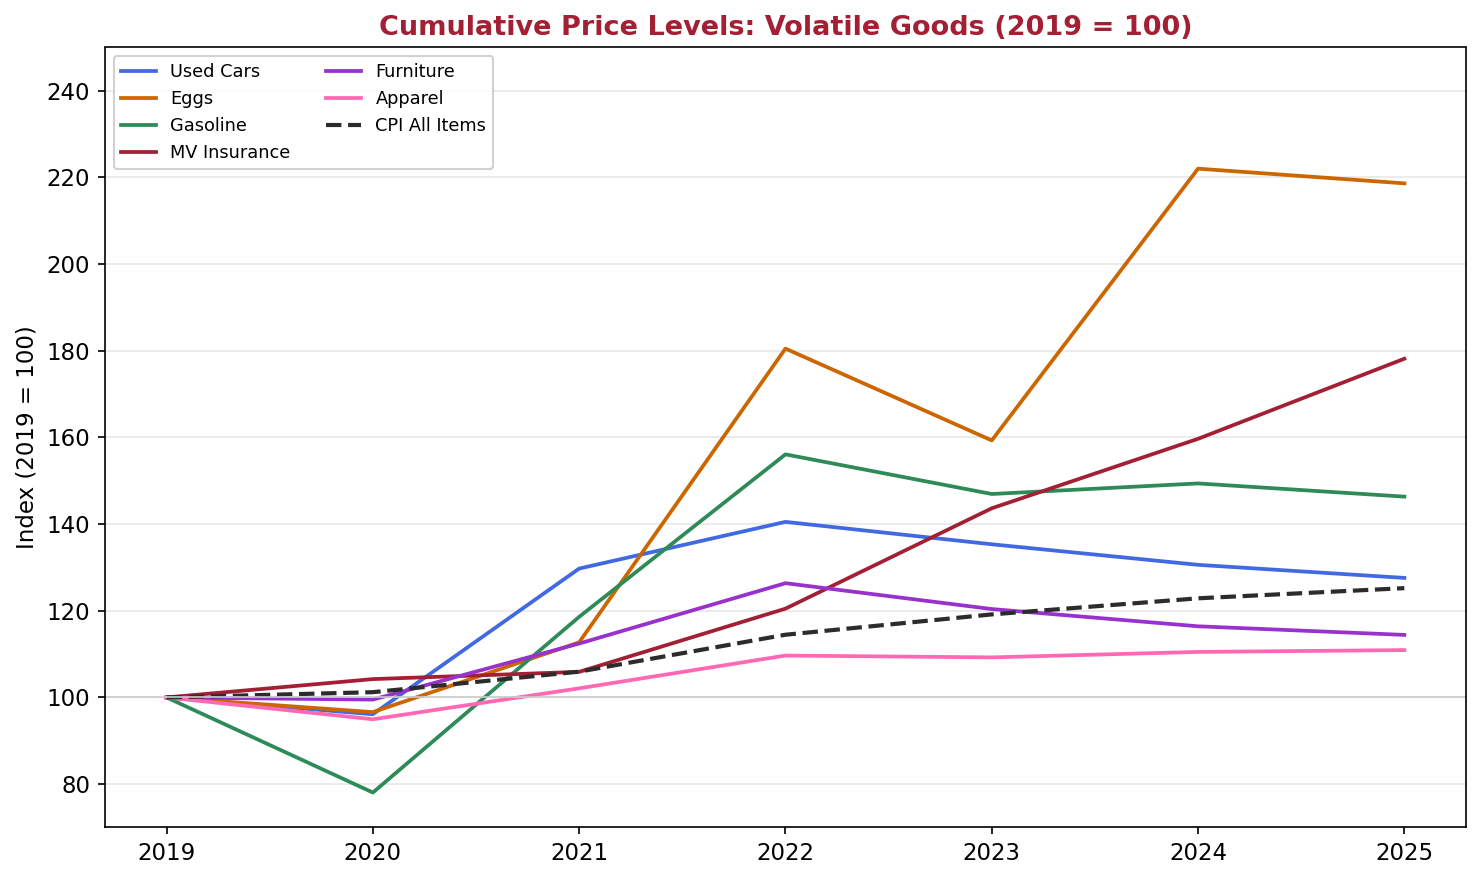
Cumulative Price Levels: Volatile Goods (2019 = 100) | Source: BLS CPI-U via FRED | Chart: CRE42
Energy
Energy carries only approximately 6% direct weight in the CPI, but its indirect effects are disproportionate. Petroleum is an input to a wide array of demand-inelastic goods and services, including transportation, fertilizer production, plastics, chemicals, and construction materials. Oil and gas tend to be very inelastic in the short term on both the supply and demand sides (changing production or consumption is difficult in the short term), creating significant price volatility which can last for extended periods of time. However, markets do adjust over time and tend to revert to stable. WTI crude monthly average prices have been within the $40–$80 per barrel range 78% of the time over the last 10 years.[8]
Services Inflation and the Labor Connection
The persistence of services inflation connects directly to labor market dynamics—and those dynamics connect to the demographic trends covered in the U.S. Demographics section of this site.
Wage Growth by Sector
| Sector | AHE* 2019 | AHE* 2025 (est.) | Change |
|---|---|---|---|
| Leisure & Hospitality | $15.60 | $21.40 | +37.2% |
| Food Services & Drinking | $13.50 | $18.60 | +37.8% |
| Construction | $29.50 | $38.50 | +30.5% |
| Healthcare & Social Asst. | $25.50 | $33.00 | +29.4% |
| Retail Trade | $18.30 | $23.30 | +27.3% |
| Total Private (reference) | $23.70 | $30.50 | +28.7% |
* AHE: Average Hourly Earnings, a BLS measure of gross hourly pay (including overtime and shift premiums, excluding benefits and bonuses) from the Current Employment Statistics establishment survey. All Employees, Seasonally Adjusted annual averages.
Wage Growth by Sector (2019 = 100) | Source: BLS CES via FRED | Chart: CRE42
The sectors with the largest post-2019 wage acceleration—leisure & hospitality, food services, construction, healthcare—share common characteristics: high physical-presence requirements, historically heavy reliance on younger and immigrant workers, and limited near-term automation potential.
Between December 1997 and July 2021, wage growth in leisure and hospitality occupations was almost always below the all-occupations benchmark. Post-pandemic, it flipped to consistently above average—and has not reverted.[9]
Blue Collar vs. White Collar
An emerging pattern complicates the picture. While physical-service and trades labor remains scarce, young college graduates face their most difficult job market in years. The Federal Reserve Bank of New York reported that the unemployment rate for recent college graduates (ages 22–27) reached 5.8% in Q1 2025, the highest since 2021, with an underemployment rate above 40%.[10] The Cleveland Fed (Nov 2025) documented that the unemployment gap between young high school and college workers has narrowed to near its all-time low—a reversal of a decades-long pattern in which college graduates consistently had lower unemployment.[11]
Researchers point to three potential factors: general economic uncertainty (including tariff-driven hiring freezes), the automation of entry-level white-collar tasks by generative AI, and a reaction to post-pandemic over-hiring (similar to the bounce-back goods prices described above). The actual AI effect on the labor market is currently a debated topic, one which is examined further in the Technology & AI section.
Construction Cost Inflation
Construction costs have risen substantially faster than consumer prices since 2019. The BLS Producer Price Index for new nonresidential building construction increased approximately 38% from 2019 to 2025, compared with approximately 25% for CPI All Items over the same period. New industrial building construction rose approximately 48%.[12]
| Index | Change 2019–2025 |
|---|---|
| CPI All Items | +25.2% |
| PPI: New Nonresidential Building (WPU801) | +37.8% |
| PPI: New Industrial Building (WPU801104) | +48.0% |
| PPI: New Office Building (WPU801103) | +39.4% |
| PPI: New Warehouse Building (WPU801101) | +36.7% |
| PPI: Construction Materials (WPUSI012011) | +30.5% |
| Avg Hourly Earnings: Construction | +30.5% |
BLS PPI via FRED; BLS CES. Annual average index values. PPI Final Demand indices are quarterly (survey updates in Jan/Apr/Jul/Oct).
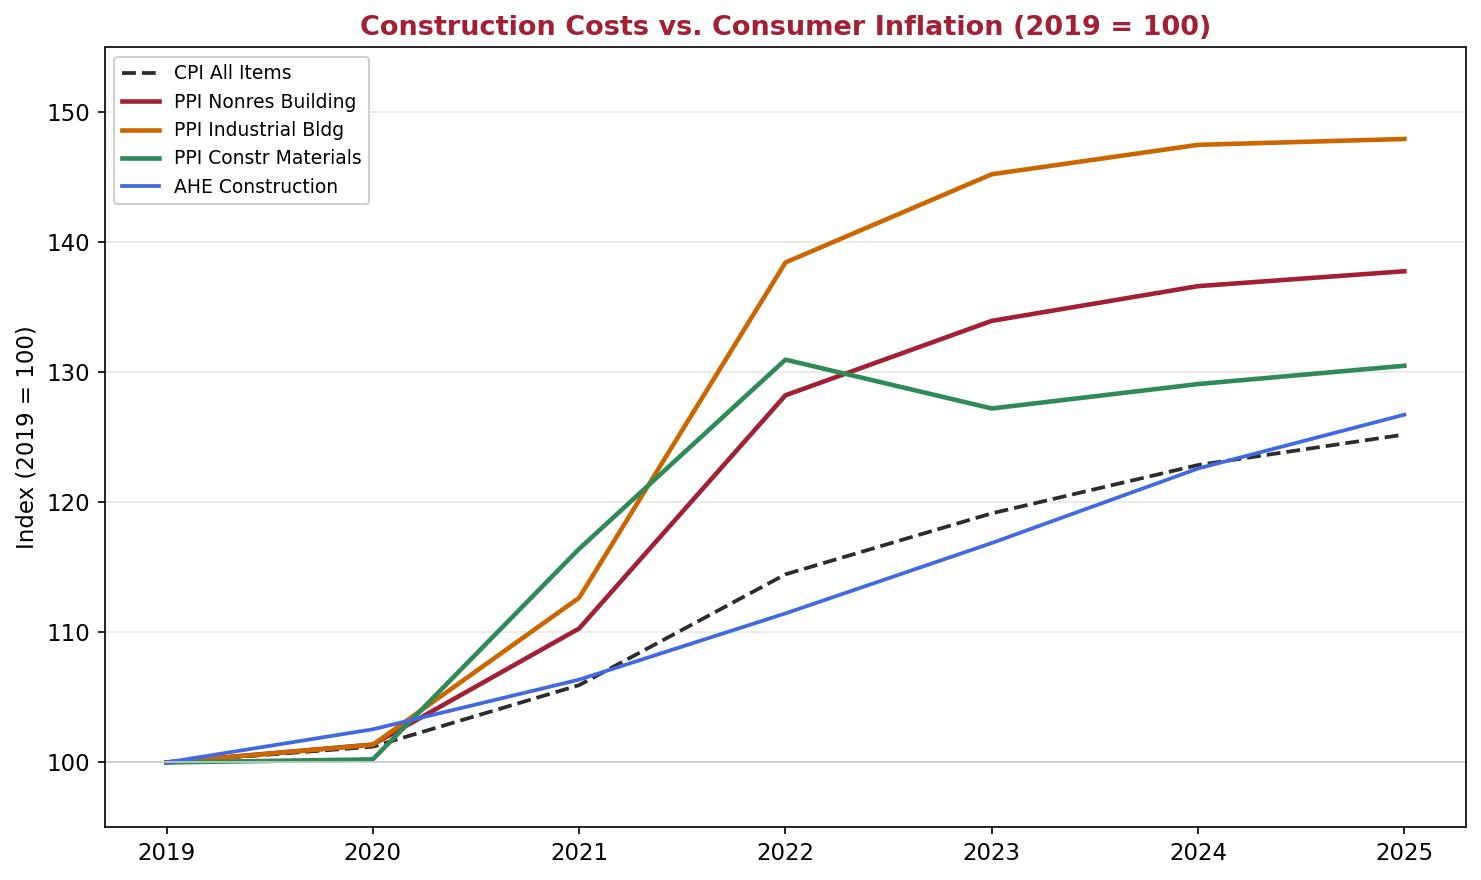
Construction Costs vs. Consumer Inflation (2019 = 100) | Source: BLS PPI & CES via FRED | Chart: CRE42
The composition of construction cost inflation shifted over this period. Materials prices spiked in 2021–2022—lumber, steel, and copper surged on supply-chain disruptions and record demand—then partially normalized. Materials are approximately 31% above 2019 levels—still higher than aggregate CPI but relatively stable. Labor costs, by contrast, have risen steadily throughout this time period, driven in large part by the demographic trends described in the U.S. Demographics section. Construction average hourly earnings reached approximately $38.50 by 2025, with the industry facing an estimated annual shortfall of approximately 500,000 workers according to Associated Builders and Contractors.[13] Median hourly wages for construction workers rose 21.1% from 2021 to 2024—more than double the 8.2% increase for all occupations over the same period.[14]
Development Economics Implications
Construction activity is down significantly in all major asset types except data centers (see Data Centers). The combination of persistently high construction costs, higher interest rates and cap rates, and softening rents (mostly due to post-pandemic overbuilding) have combined to create a landscape in which most development does not make economic sense. Many developers with shovel-ready sites continue to wait and watch the U.S. economic, labor, and commercial real estate story unfold.
What to Watch in 2026
Notes
[1] BLS CPI-U, February 2026 release (March 11, 2026). 12-month percent change, not seasonally adjusted. ↩
[2] BLS CPI-U via FRED: All Services (CUSR0000SAS) and Services less Rent of Shelter (CUSR0000SASL2RS). Annual average index values, 2000 vs. 2025. ↩
[3] BLS, Consumer Price Index: 2025 in Review, The Economics Daily (January 2026). Hospital and related services rose 6.7% Dec-over-Dec, the largest annual increase since 2010. ↩
[4] BLS, Measuring Price Change in the CPI: Rent and Rental Equivalence (factsheet). OER is derived from a survey question asking homeowners what they believe their home would rent for, then reweighted using Consumer Expenditure Survey data. ↩
[5] Zelman & Associates, “Housing CPI Versus Reality,” March 2026. Brookings Institution, “How Does the Consumer Price Index Account for the Cost of Housing?” January 2024. Federal Reserve Bank of Richmond, Macro Minute on OER lag, April 2023. ↩
[6] CRE Daily, “Multifamily Rents Disputed in CPI Reports,” February 2026, summarizing Walker/Linneman webinar discussion. ↩
[7] BLS CPI-U via FRED: Commodities less food and energy commodities (CUSR0000SACL1E). Annual average index rose from approximately 149 (2000) to approximately 163 (2025), a cumulative increase of approximately 9.2%. ↩
[8] U.S. Energy Information Administration via FRED (DCOILWTICO). Monthly average WTI crude oil spot prices, March 2016 through February 2026: 94 of 120 months (78.3%) fell within the $40–$80/bbl range. ↩
[9] FRED Blog, “Above-Average Wage Growth in the Leisure and Hospitality Industry,” September 2023. Underlying data from the Atlanta Fed Wage Growth Tracker. ↩
[10] Federal Reserve Bank of New York, Labor Market for Recent College Graduates, Q1 2025 data. Year-end 2025 underemployment rate: 42.5%. ↩
[11] Cline, Alexander, and Baris Kaymak. “Are Young College Graduates Losing Their Edge in the Job Market?” Federal Reserve Bank of Cleveland, Economic Commentary 2025-14 (November 2025). ↩
[12] BLS PPI via FRED: New Nonresidential Building Construction (WPU801), New Industrial Building Construction (WPU801104). Annual average index values, 2019 vs. 2025 estimates. PPI Final Demand indices are quarterly; annual averages smooth survey-month corrections. ↩
[13] Associated Builders and Contractors (ABC), 2025 construction workforce shortage estimates. ↩
[14] LendingTree analysis of BLS Occupational Employment and Wage Statistics (OEWS) data, published July 2025. ↩
Sources
1. U.S. Bureau of Labor Statistics. Consumer Price Index (CPI-U). bls.gov/cpi
2. U.S. Bureau of Labor Statistics. Producer Price Index (PPI). bls.gov/ppi
3. U.S. Bureau of Labor Statistics. Current Employment Statistics (CES). bls.gov/ces
4. Federal Reserve Bank of St. Louis (FRED). CPI, PPI, AHE, and WTI crude oil series. fred.stlouisfed.org
5. U.S. Energy Information Administration. WTI Crude Oil Spot Prices (via FRED, DCOILWTICO).
6. Federal Reserve Bank of New York. Labor Market for Recent College Graduates. newyorkfed.org
7. Federal Reserve Bank of Cleveland. Economic Commentary 2025-14 (November 2025).
8. Brookings Institution. “How Does the CPI Account for Housing?” January 2024.
9. Federal Reserve Bank of Richmond. Macro Minute on OER lag, April 2023.
10. Zelman & Associates. “Housing CPI Versus Reality,” March 2026.
11. CRE Daily. “Multifamily Rents Disputed in CPI Reports,” February 2026.
12. Associated Builders and Contractors (ABC). 2025 construction workforce estimates.
13. Associated General Contractors of America (AGC). Labor market reports.
14. LendingTree. Analysis of BLS OEWS data on construction wage growth, July 2025.
15. Ed Zarenski, Construction Analytics. PPI construction inflation analysis. edzarenski.com