Overview
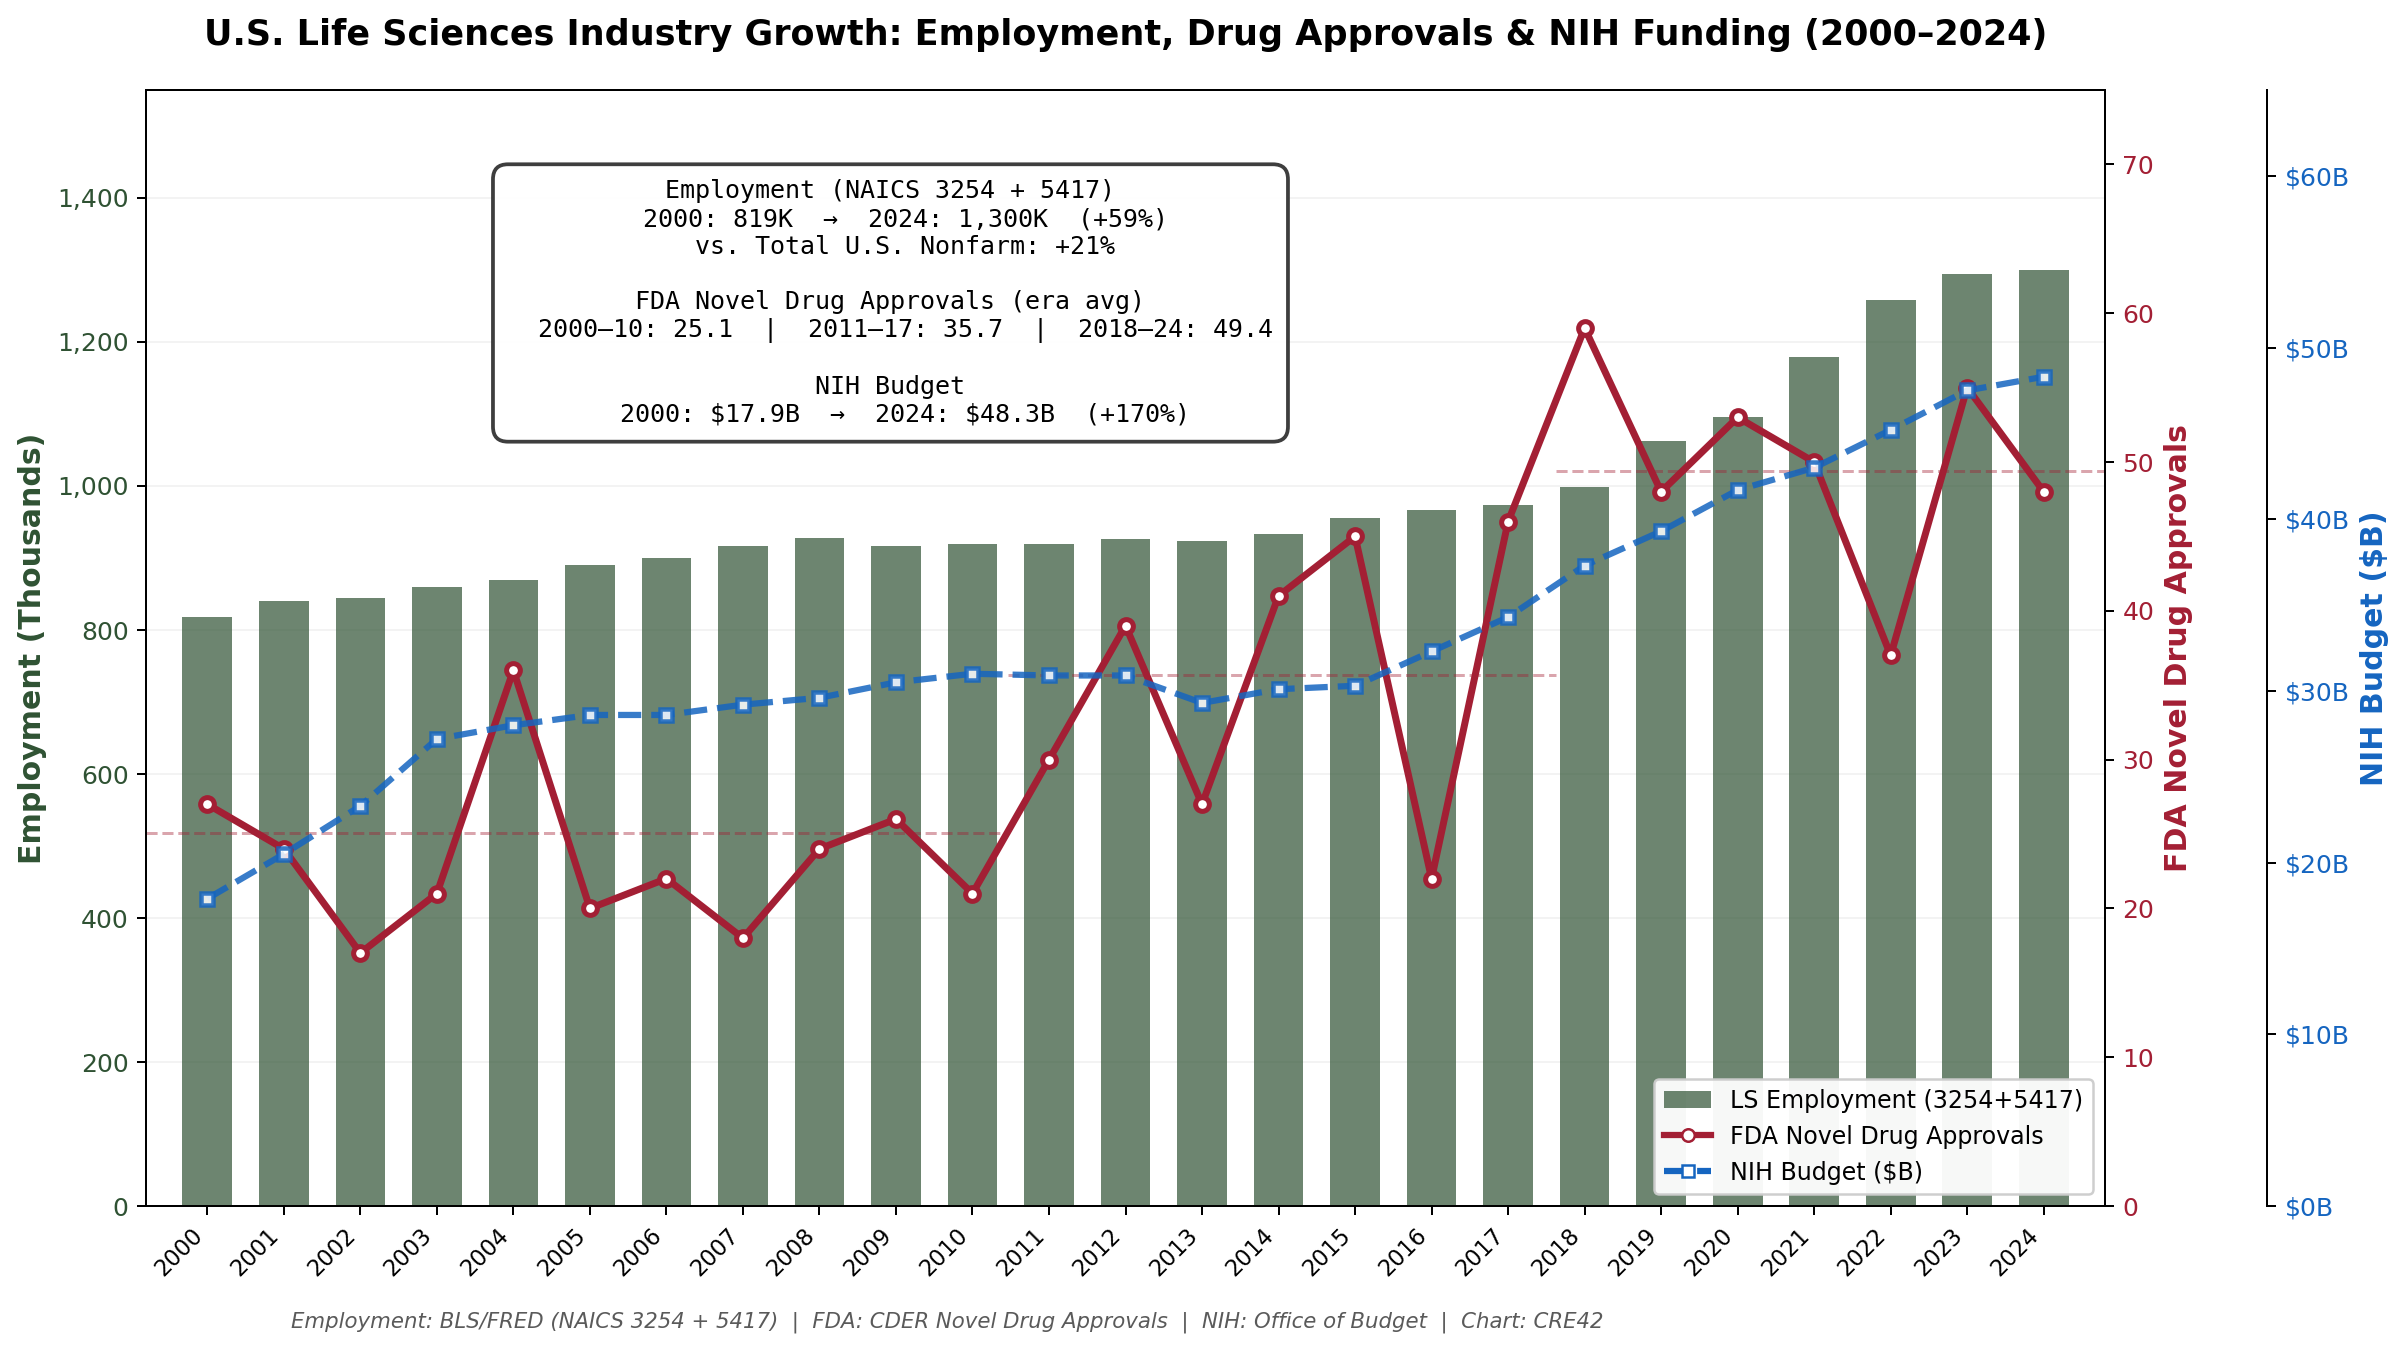
Life sciences real estate has undergone one of the most dramatic boom–bust cycles in commercial real estate history. The underlying industry has been a strong and consistent growth story—life sciences employment grew roughly 59% since 2000, outpacing overall U.S. nonfarm employment growth (+21%) by nearly three-to-one, while FDA drug approvals and NIH funding both roughly doubled. But the real estate metrics have been far more volatile than the industry fundamentals would suggest. Fueled by breakthroughs in genetic medicine, record venture capital, and pandemic-era urgency, developers delivered unprecedented amounts of purpose-built lab space into a handful of concentrated markets between 2020 and 2024. When funding slowed and demand normalized, vacancy in the three largest markets surged from roughly 5% to over 20% in under three years—a correction sharper and faster than the post-GFC office downturn.
Chart: U.S. Life Sciences Industry Growth (2000–2024)
U.S. Life Sciences Industry Growth: Employment, Drug Approvals & NIH Funding (2000–2024) | Sources: BLS/FRED (NAICS 3254 + 5417), FDA CDER, NIH Office of Budget | Chart: CRE42
Employment includes Pharmaceutical & Medicine Manufacturing (NAICS 3254) and Scientific R&D Services (NAICS 5417). This understates total life sciences employment, which also includes medical devices, diagnostics, and other subsectors.
Document Links
office-life-science.xlsx — Market comparison across three brokerage reports, historical vacancy and rent estimates by market (2016–2024), industry growth data (BLS, FDA, NIH)
🔗 FRED: Pharma & Medicine Mfg Employment (NAICS 3254) — Annual employment data, BLS QCEW
🔗 FRED: Scientific R&D Services Employment (NAICS 5417) — Annual employment data, BLS QCEW
🔗 FDA CDER Novel Drug Approvals — Annual approval counts by year
Key Observations
Context & Discussion
The Science Driving Demand
The life sciences industry has evolved dramatically over the past two decades. Traditional pharmaceutical manufacturing—synthesizing small-molecule chemical compounds—remains a large and stable employer but is a mature business with modest growth. The real acceleration has come from biological and genetic R&D: mRNA-based therapeutics (validated at scale during COVID), CAR-T and other engineered cell therapies, CRISPR-derived gene editing platforms, and most recently the early integration of AI and machine learning into drug candidate identification. Each successive generation of therapeutic approach is more complex, more capital-intensive, and requires more specialized physical infrastructure. The rapidly evolving science also means that lab fit-outs can become functionally obsolete within a single lease term, creating both opportunity and risk for landlords and tenants.
Life Science Real Estate: Highly Variable Asset Types
“Life science real estate” encompasses a remarkably wide range of building types with very different cost profiles and demand drivers. At the high end, BSL-2 and BSL-3 wet laboratories for biological research and cGMP bioprocessing facilities for drug manufacturing can cost $1,000 per square foot or more to develop when all-in costs are included—tenant improvement packages, specialized HVAC and ventilation systems, power redundancy, vibration control, and regulatory compliance infrastructure. Rents in premier markets like Cambridge and South San Francisco for top-tier lab space run $80–100+/SF NNN. At the other end of the spectrum, routine diagnostics laboratories (blood testing, clinical sample processing) and computational “dry labs” are far less expensive to build and operate—sometimes not materially different from conventional office space, with construction costs and rents to match. Conflating these categories in market statistics overstates the scale of the “lab market” and can distort vacancy, rent, and supply comparisons across markets and sources. As the industry has matured, the trend has been toward more specialized, higher-cost facilities—driven by the shift from small-molecule chemistry to large-molecule biology and genetic medicine—though this also raises the stakes for landlords if scientific directions shift or tenants fail.
The Boom: How Purpose-Built Lab Became a CRE Asset Class
Prior to roughly 2015, most U.S. lab space was converted office buildings, repurposed academic or government facilities, or small-scale purpose-built clusters near major research universities. The combination of a venture capital surge, regulatory acceleration (FDA breakthrough therapy designations), historically low interest rates, and then pandemic-era mRNA urgency triggered a wave of ground-up speculative lab development unlike anything the sector had seen. Developers who had never built a laboratory began entering the market. The shift was also driven by the changing needs of the industry itself: increasingly complex genetic and protein-based drug investigations required purpose-built space with specialized infrastructure that converted office buildings simply could not provide—higher floor-to-floor heights, chemical exhaust systems, vibration isolation, backup power, and loading dock access for large-scale equipment. The construction pipeline grew from a few million square feet nationally to a peak of more than 35 MSF under construction around 2023, representing roughly 15–20% of total tracked lab inventory. The vast majority of this new supply was concentrated in Boston-Cambridge and the SF Bay Area.
The Bust: Overbuilding Meets a Funding Cycle Downturn
The correction that followed was driven primarily by overbuilding—a pattern familiar across CRE asset classes but rarely this concentrated or this fast. This is the classic real estate cycle playing out in an emerging asset class: developers extrapolated from the extraordinary demand growth of 2019–2021, which was fueled by a confluence of forces unlikely to repeat simultaneously—pandemic urgency, record VC inflows, near-zero interest rates, and accelerating FDA approvals. When VC funding pulled back sharply from its 2020–2021 peak, the IPO window narrowed, and interest rates rose, demand growth decelerated at precisely the moment an unprecedented volume of new supply was delivering. Hybrid work also played a contributing role—while bench laboratory work must be performed on-site, significant portions of lab buildings are conventional office space dedicated to administrative functions, data analysis, writing, and meetings. Some of those functions migrated to remote or hybrid arrangements, reducing effective utilization even in occupied buildings. The result: vacancy in the Big 3 markets surged from roughly 5% in 2019–2022 to over 20% by 2024, with the SF Bay Area and Boston-Cambridge experiencing the most severe increases. This stands as one of the sharpest localized corrections in modern CRE history.
The Two-Track Market: Big 3 vs. Everyone Else
One of the defining features of this cycle is its extreme geographic concentration. The Big 3 markets—Boston-Cambridge, SF Bay Area, and San Diego—absorbed the vast majority of new construction and consequently the vast majority of the vacancy increase. Meanwhile, the other major U.S. lab markets (Raleigh-Durham, Philadelphia, New Jersey, Washington D.C.-Baltimore, Seattle, Los Angeles, Denver-Boulder) have collectively recorded positive net absorption since 2023, with occupied lab/R&D space reaching record levels. This bifurcation reflects both the concentration of speculative development in the Big 3 and the comparatively smaller, demand-driven buildouts in secondary markets. For investors, the implication is clear: “life sciences real estate” is not a single market—performance varies enormously by geography.
Current and Future Life Science Real Estate Landscape
The construction pipeline has largely emptied, falling from 35+ MSF to roughly 6 MSF by early 2026—the lowest level since 2019. If demand stabilizes near current levels, the basic supply-demand math turns favorable within 12–24 months as negligible new supply arrives. VC funding has begun recovering, and life sciences employment continues to set records.
But beyond the near-term cyclical recovery, the longer-term picture for life sciences real estate demand may be the most compelling in CRE. Demographic trends favor the industry powerfully: the massive baby boomer generation is entering its years of peak healthcare consumption (see Demographics: The U.S. Population), driving demand for novel therapeutics, diagnostics, and medical devices. Genetic and protein-based therapies are becoming increasingly sophisticated, requiring ever more specialized lab infrastructure. And the emerging era of AI-driven drug discovery—while raising legitimate questions about whether some laboratory functions could eventually be automated through computational simulation—represents a potentially enormous expansion of the total addressable market for R&D activity. The fundamental question is one of scale: what has a larger total addressable market than human health and longevity? The real estate needed to support that market may look different in ten years than it does today, but the direction of demand appears structurally favorable.
Sources
1. U.S. Bureau of Labor Statistics / FRED. Employment: Pharmaceutical & Medicine Manufacturing (NAICS 3254). Series: IPUEN3254W200000000. fred.stlouisfed.org
2. U.S. Bureau of Labor Statistics / FRED. Employment: Scientific Research & Development Services (NAICS 5417). Series: IPUMN5417W200000000. fred.stlouisfed.org
3. U.S. Bureau of Labor Statistics. Current Employment Statistics: Pharmaceutical & Medicine Manufacturing (CES). Series: CEU3232540001. data.bls.gov
4. U.S. Food & Drug Administration. CDER Novel Drug Approvals. Annual data 2000–2024. fda.gov
5. National Institutes of Health. Office of Budget: Historical Budget Tables. officeofbudget.od.nih.gov
6. CBRE Research. 2025 U.S. Life Sciences Outlook (February 2025). Market data, employment charts, supply/demand figures cited in general terms.
7. JLL Research. U.S. Life Sciences Property Report (June 2025). Market overview and trend analysis.
8. Cushman & Wakefield Research. U.S. Life Sciences Report (February 2026). Vacancy, rent growth, and construction pipeline data.
Methodology & Data Notes
Employment Data
Life sciences employment is proxied using two BLS/FRED series: NAICS 3254 (Pharmaceutical & Medicine Manufacturing) and NAICS 5417 (Scientific Research & Development Services). The combined total (~1.3 million in 2024) understates total industry employment, which CBRE estimates at approximately 2.1 million when including medical devices, diagnostics, and related subsectors not captured in these two NAICS codes. The comparison to total U.S. nonfarm employment uses FRED series PAYEMS (annual averages). NAICS 5417 is broader than life sciences alone—it includes physical sciences and other R&D—but is the closest publicly available proxy for the biotech R&D workforce.
FDA Approval Data
FDA novel drug approval counts reflect CDER (Center for Drug Evaluation and Research) approvals of new molecular entities (NMEs) and novel biologics. The 2024 figure (48) is through mid-December 2024. Era averages (25.1, 35.7, 49.4) are consistent with CBRE’s published analysis (Figure 15 of the 2025 LS Outlook). These figures should be verified against the FDA’s official annual tally on fda.gov.
NIH Budget Data
NIH budget figures represent total budget authority (enacted), excluding the one-time $10.4B ARRA supplement in 2009. Figures should be verified against the NIH Office of Budget historical tables.
Market Concentration & Supply Data
Market inventory and vacancy figures referenced in general terms are estimates derived from cross-referencing CBRE, JLL, and Cushman & Wakefield published reports. Specific brokerage figures are not reproduced; statements use approximate language (“roughly 45%,” “more than 35 MSF”) consistent with the range across sources. The companion Life Science Market Data spreadsheet contains detailed market-by-market comparisons and methodology notes.