▸ THIS SECTION INCLUDES PROPRIETARY DATA AND IS NOT AVAILABLE FOR PUBLIC USE
▸ This page is a reference source for the reader and appears in multiple property sections
Overview
The United States added 40 million people and roughly doubled its real GDP between 2007 and 2025.1,2,3 Each major commercial real estate asset type responded differently to that demand growth. To varying degrees, the resulting supply matched, exceeded, or fell short of the economy’s needs, resulting in today’s vacancy, rent, and investment returns across sectors. Below we compare cumulative inventory growth for office, industrial, retail, and multifamily against population and GDP benchmarks, then examine how supply growth translated into vacancy outcomes across asset types.
Chart: U.S. Real GDP, Population & CRE Inventory Growth (2007 = 100)
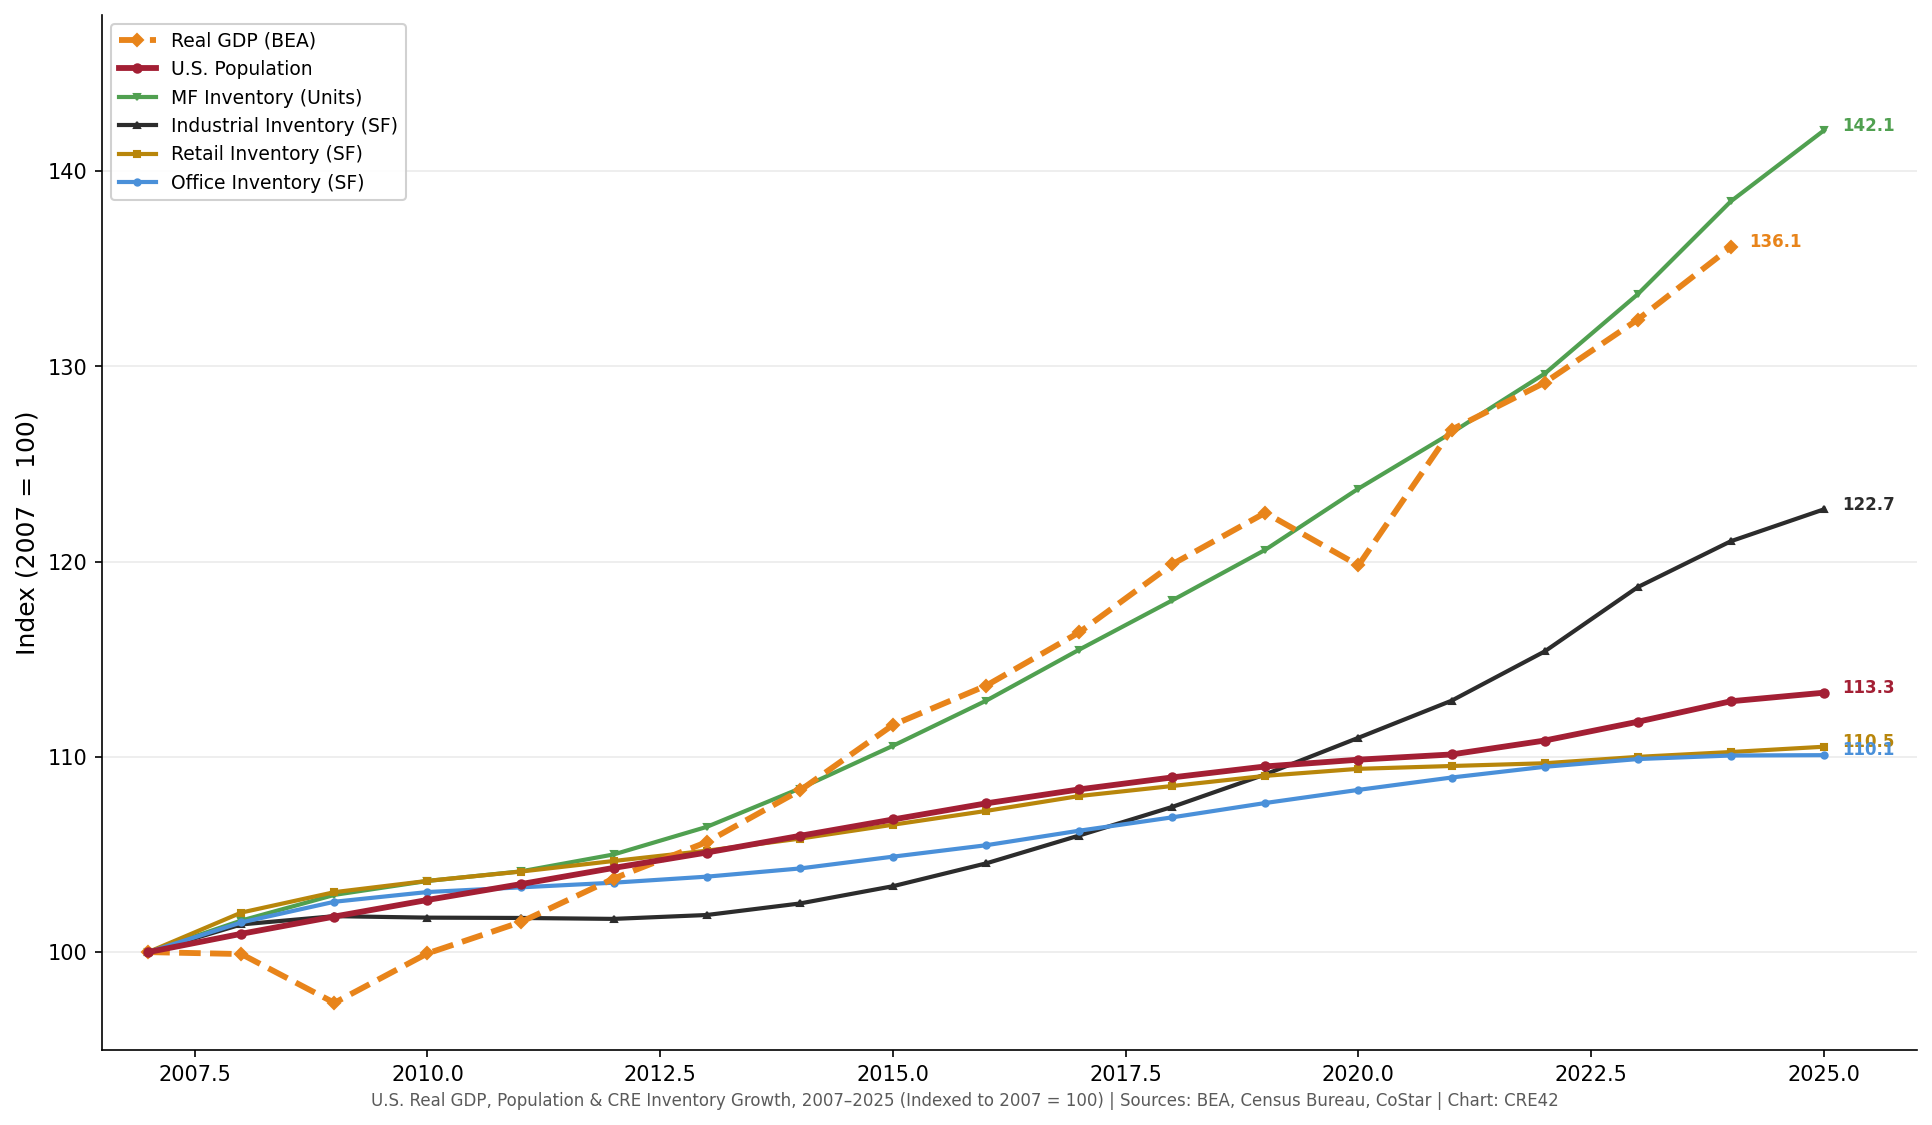
U.S. Real GDP, Population & CRE Inventory Growth, 2007–2025 (Indexed to 2007 = 100) | Sources: BEA (FRED: GDPA), U.S. Census Bureau, CoStar | Chart: CRE42
Real GDP line ends at 2024 (2025 full-year data not yet available). All other series through YE 2025. MF measured in units; all other inventories in square feet.
Chart: Supply Growth vs. Vacancy by Asset Type (2018–2025)
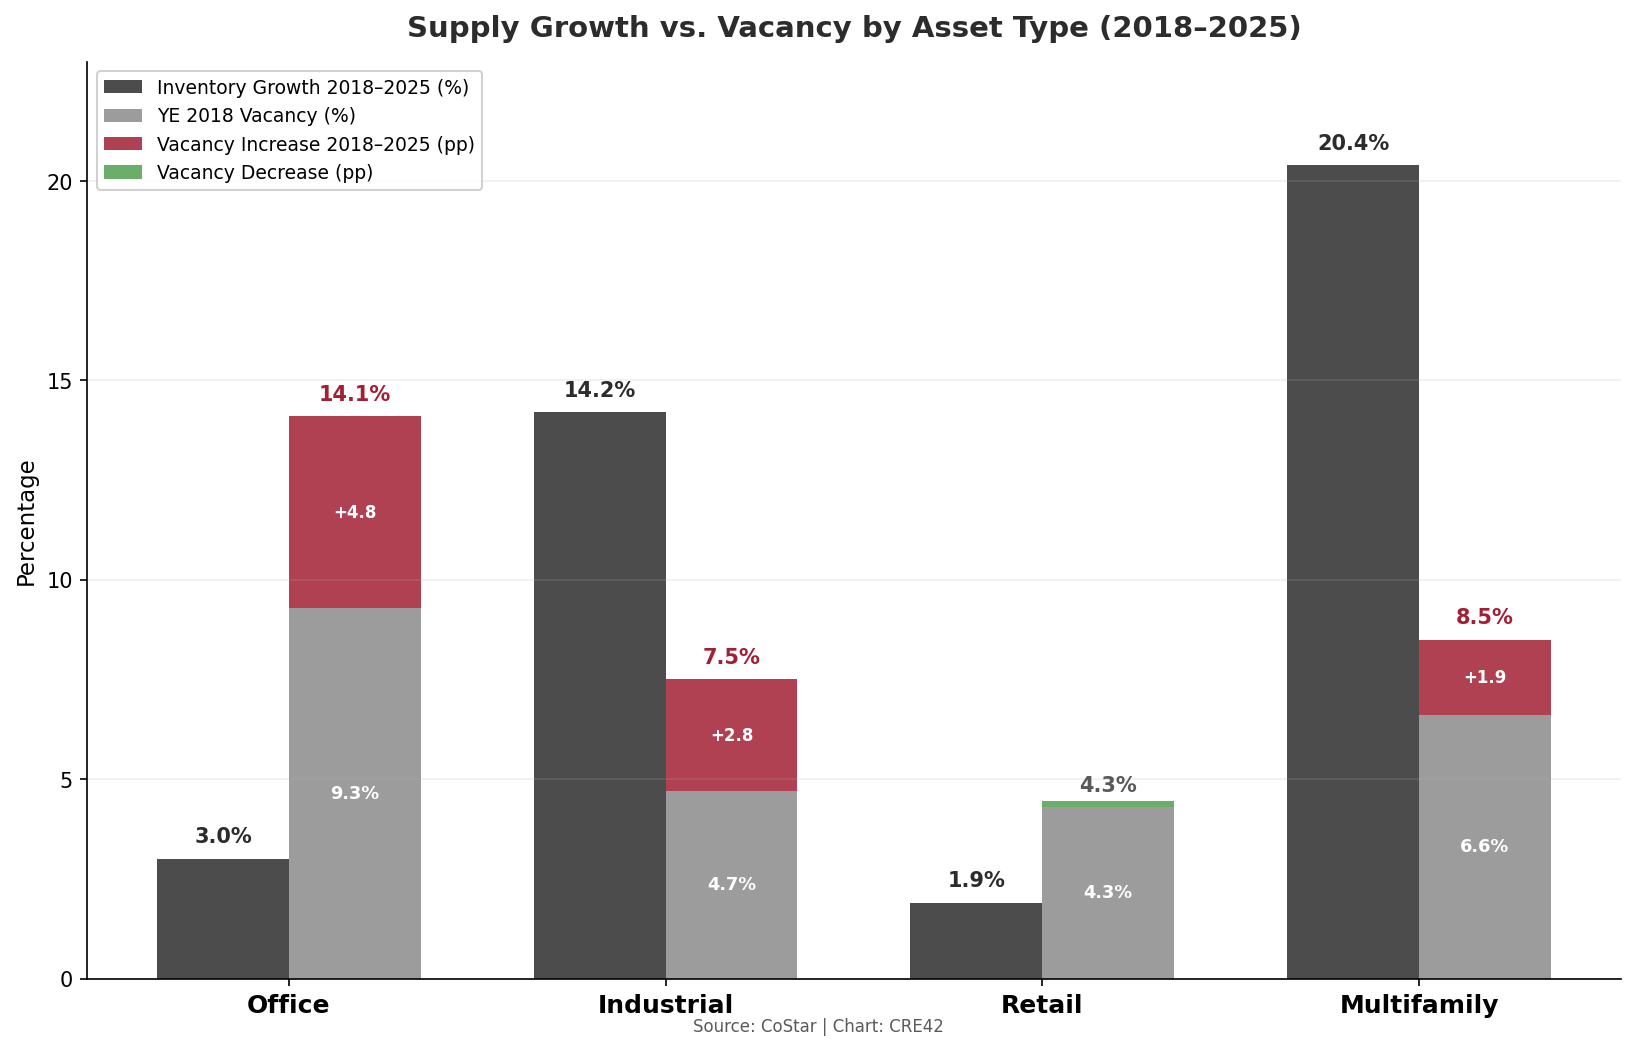
Inventory Growth vs. Vacancy Rate by Asset Type, 2018–2025 | Source: CoStar | Chart: CRE42
Left bar: cumulative inventory growth. Right bar: stacked vacancy — gray base is YE 2018 vacancy rate, colored segment is change to YE 2025.
Document Links
shared-national-cre-supply.xlsx — CoStar national statistics for all four asset types (2007–2025), indexed growth comparison, supply vs. vacancy analysis, state population data
Key Observations
Context & Discussion
Multifamily: Supply boom overshoots, especially in growth markets
Multifamily inventory grew from 14.5 million units in 2007 to 20.7 million in 2025, a 42% increase driven by delayed homeownership, rising housing costs, Millennial and Gen-Z household formation, and sustained domestic migration to growth metros.1,2 Vacancy fell steadily from 7.1% in 2007 to a trough near 4.5% in 2021 as construction was delayed and demand surged in 2021 and 2022.1 Annual rent growth exceeded 10% in many markets during this time period, attracting an enormous wave of new construction starts.1
Net deliveries reached a record 692,000 units in 2024 and 528,000 in 2025, the highest levels in modern records.1 This supply shock led to an increase in the national vacancy rate from 4.5% to 8.5%, with rent growth decelerating to under 1% nationally in 2025.1 But the national figures mask significant regional variation: growth metros like Austin, Nashville, Phoenix, Charlotte, and Dallas experienced extreme new levels of residential construction and are now working through oversupply, while mature coastal markets (New York, Boston, San Francisco) saw far less new construction and maintained tighter conditions.
Industrial: Post-GFC supply constraints lead to low vacancy, rising rents and new construction
Industrial inventory grew 23% from 15.7 billion SF to 19.2 billion SF, driven by e-commerce (which requires approximately three times the distribution space per dollar of sales compared to brick-and-mortar retail), pandemic-era supply chain restructuring that prioritized domestic inventory buffers over just-in-time efficiency, and early-stage nearshoring of manufacturing capacity enabled by federal industrial policy (CHIPS Act, IIJA, IRA).1 Vacancy fell from 7.8% in 2007 to a record low of 3.8% in 2022 before rising to 7.5% in 2025.1
Industrial developers delivered 516 million SF in 2023 alone, more than double the pre-pandemic average, only 11 years removed from a three-year period (2010–2012) in which national industrial deliveries actually went negative as obsolete industrial stock was demolished faster than new product was built.1 As with multifamily, the supply wave was geographically concentrated in Sunbelt and inland-logistics metros where land was available and entitlement timelines were short. Coastal markets with constrained land supply (Northern New Jersey, the Inland Empire, South Florida) generally maintained lower vacancy throughout the cycle.1 Deliveries have declined significantly to only 256 million SF in 2025, with many overbuilt growth metros hoping absorption will stabilize the market before the next round of development.
Retail: Volatile sentiment and tenant demand vs. low levels of new supply
National retail inventory grew 10.5%, the least of any major asset type and less than population growth.1,2 Average annual deliveries collapsed from 77 million SF (2007–2019) to 26 million SF (2020–2025).1 In 2025, the U.S. delivered 29 million SF of new retail space — 0.24% of existing inventory, less than half the long-term average and an all-time low.1 Vacancy fell from 5.7% in 2007 to 4.0% in 2023 and sits at 4.3% today — unchanged from its 2018 level despite a pandemic, 15,000 estimated store closures in 2025, and the continued growth of e-commerce from 3.3% to over 16% of total retail sales.1,8
The “retail apocalypse” narrative that dominated media and investor sentiment from roughly 2015 to 2019 — anchored by high-profile mall closures, department store bankruptcies, and projections that a quarter of U.S. malls would close — effectively shut down new retail construction.8 Lenders pulled back, developers pivoted to industrial and multifamily, and an estimated 400+ million SF of obsolete retail space has been demolished or converted over the past 15 years.1 The surviving inventory is tighter, better located, and generating higher rents: asking rents rose 34% from $19.28/SF to $25.84/SF over the period.1 Neighborhood and grocery-anchored centers are effectively full, while enclosed malls and certain big-box formats face continued obsolescence pressure.4,5,6 The national vacancy figure obscures this bifurcation.
Office: Demand reduction overrides reduced new supply
Office inventory grew 10.1% from 7.5 billion SF to 8.3 billion SF — roughly in line with retail and below population.1,2 Pre-pandemic, the office market was in late-cycle expansion: vacancy had compressed from 10.5% at the GFC peak to 9.3% by 2018, rents were rising, and under-construction pipelines were modest relative to inventory.1 Following the Covid-19 pandemic, remote and hybrid work patterns reduced office-using employment’s physical footprint, and vacancy surged to 14.1% by 2025 — a 4.8 percentage point increase on just 3.0% supply growth.1 No other asset type experienced a vacancy increase of this magnitude.
Net supply actually turned negative in 2024 for the first time in modern records, as demolitions and conversions to residential, lab, and hotel uses exceeded new completions.1,7 New spec construction starts are now exceedingly rare across the country, while aggregate demand for office space remains one of the great uncertainties of the coming years.
The Geographic Dimension
A pattern common to multifamily, industrial, and to a lesser extent retail is the geographic concentration of new construction in growth metros.1 In addition to favorable demographic trends, builders tend to build where they can build.2 Sunbelt and interior markets enjoy lower land costs, shorter entitlement timelines, fewer regulatory barriers, and pro-development local governments, and consequently attract a disproportionate share of new development. The result is a familiar cycle: growth metros experience supply surges which push vacancy above national averages, while supply-constrained coastal markets maintain lower vacancy and higher rents.1 Metro-level data on multifamily and industrial regional patterns explore this geographic dimension in detail.
Detailed Supply Charts: Total Inventory & Net Deliveries by Asset Type (SF)
The charts below present total inventory and annual net deliveries in square feet for all four major CRE asset types. Multifamily units have been converted to estimated square feet using 900 SF per unit, the approximate national average apartment size from 2007 to 2024 per RentCafe/Yardi Matrix annual surveys.9 This conversion enables direct cross-asset comparison of construction volume on a common scale.
Net Deliveries — 5-Year Period Totals
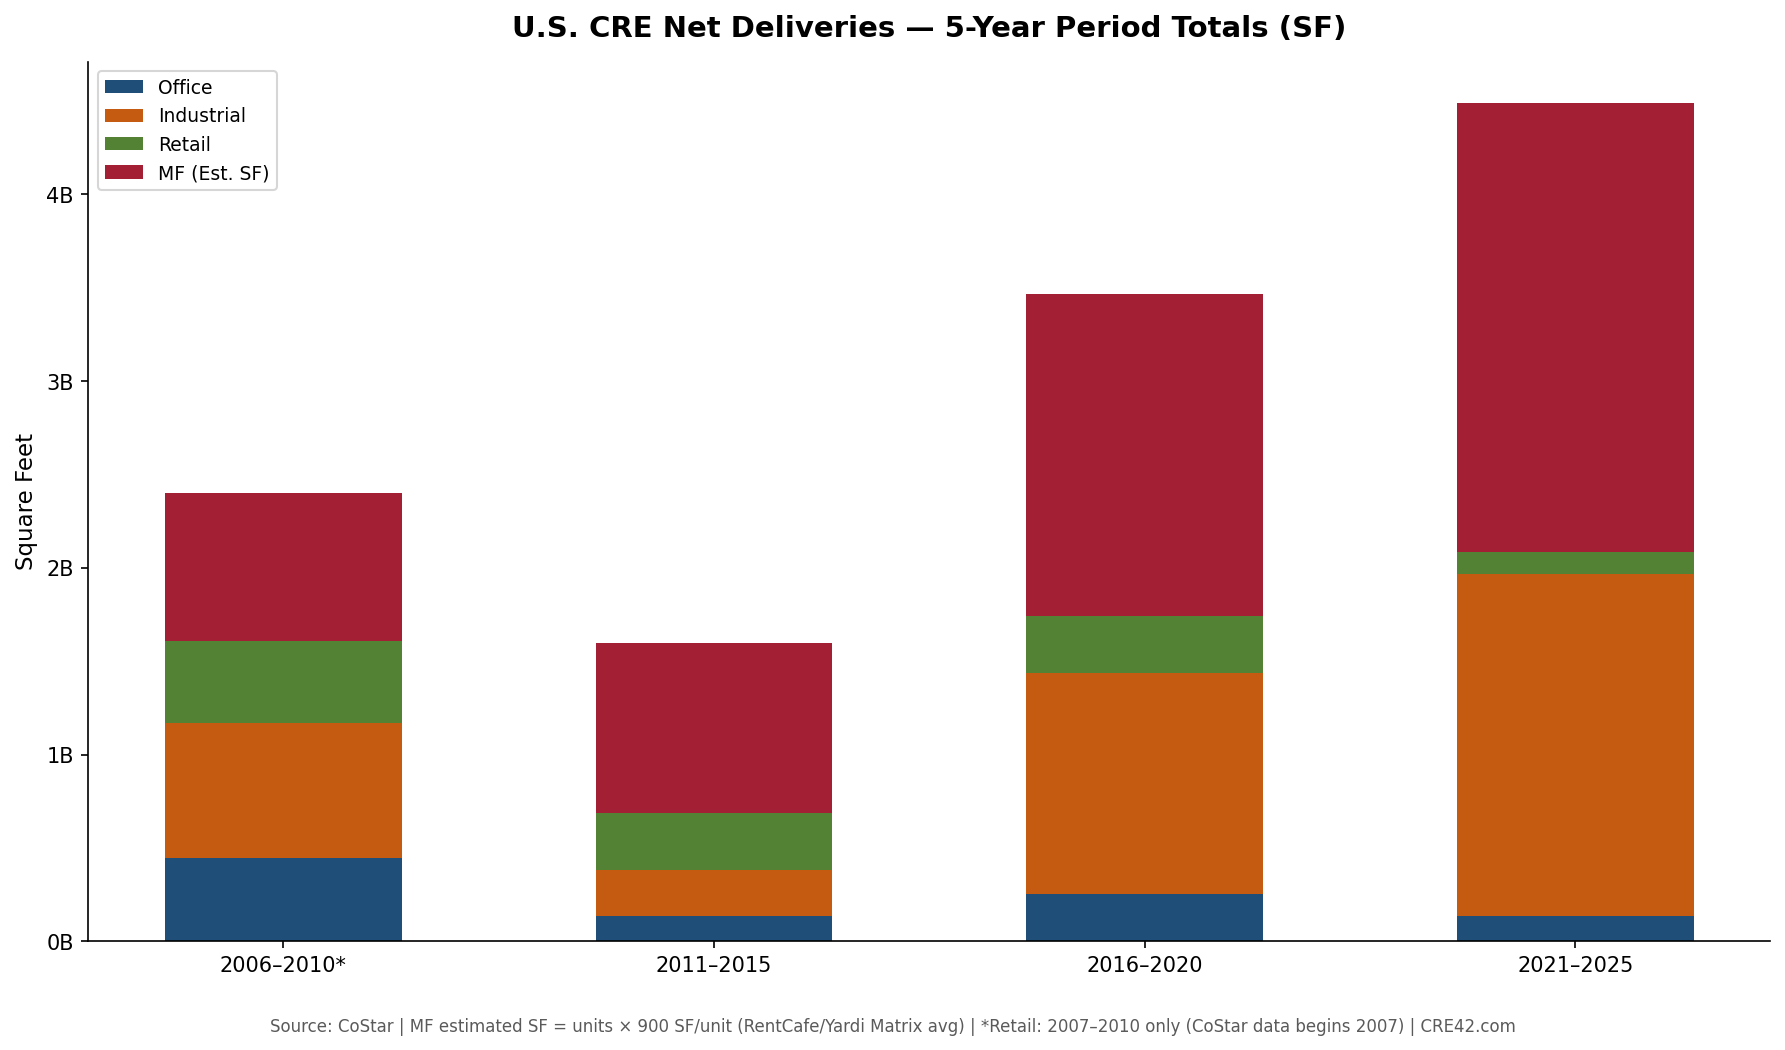
U.S. CRE Net Deliveries — 5-Year Period Totals (SF) | Source: CoStar; MF estimated at 900 SF/unit | Chart: CRE42
Multifamily and industrial construction increasingly dominated U.S. CRE development, especially following the GFC and Covid-19 pandemic when retail and office supply (respectively) collapsed.
Net Deliveries — Annual Trend (2007–2025)
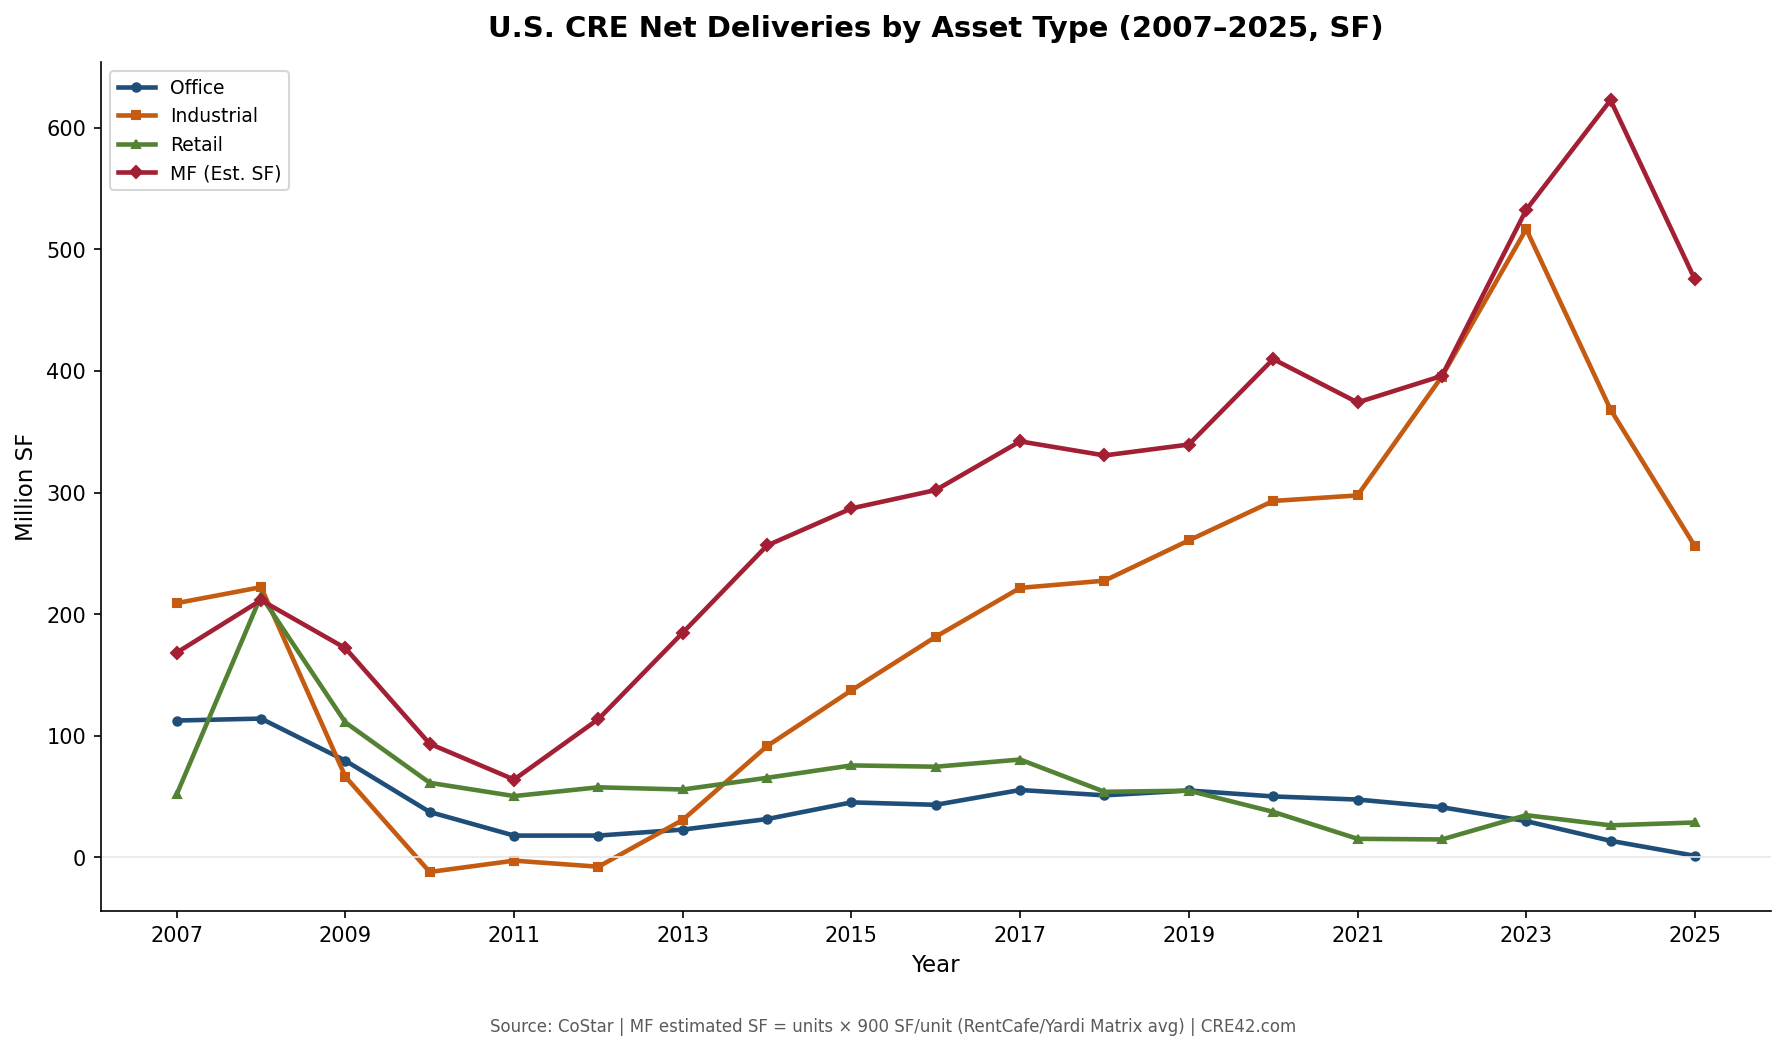
U.S. CRE Net Deliveries by Asset Type, 2007–2025 (SF) | Source: CoStar; MF estimated at 900 SF/unit | Chart: CRE42
The post-GFC collapse in deliveries was broad-based, but the recovery was sector-specific: industrial and multifamily surged to record levels while office and retail never regained pre-recession construction volumes.
Total Inventory — Annual Trend (2007–2025)
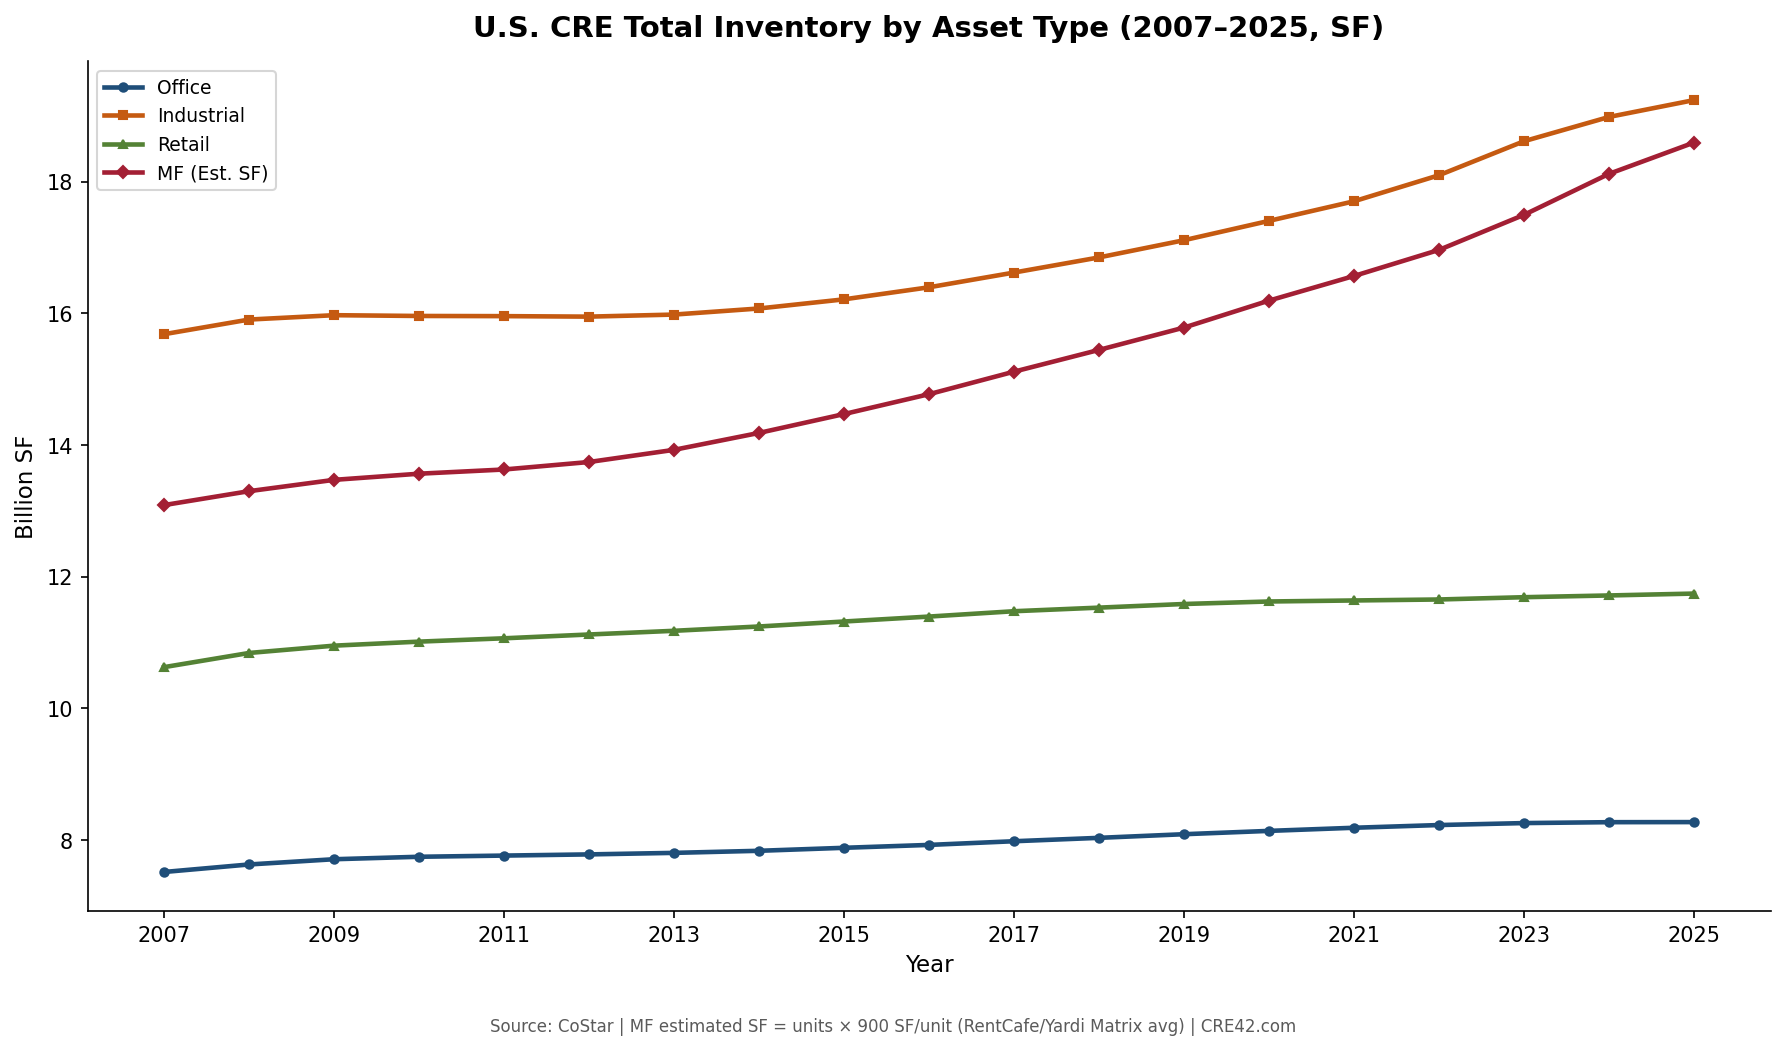
U.S. CRE Total Inventory by Asset Type, 2007–2025 (SF) | Source: CoStar; MF estimated at 900 SF/unit | Chart: CRE42
Industrial remains the largest CRE asset class by square footage, but multifamily — measured on a comparable SF basis — has been closing the gap steadily since the mid-2010s and now rivals industrial in total physical footprint.
Total Inventory — 5-Year Snapshots
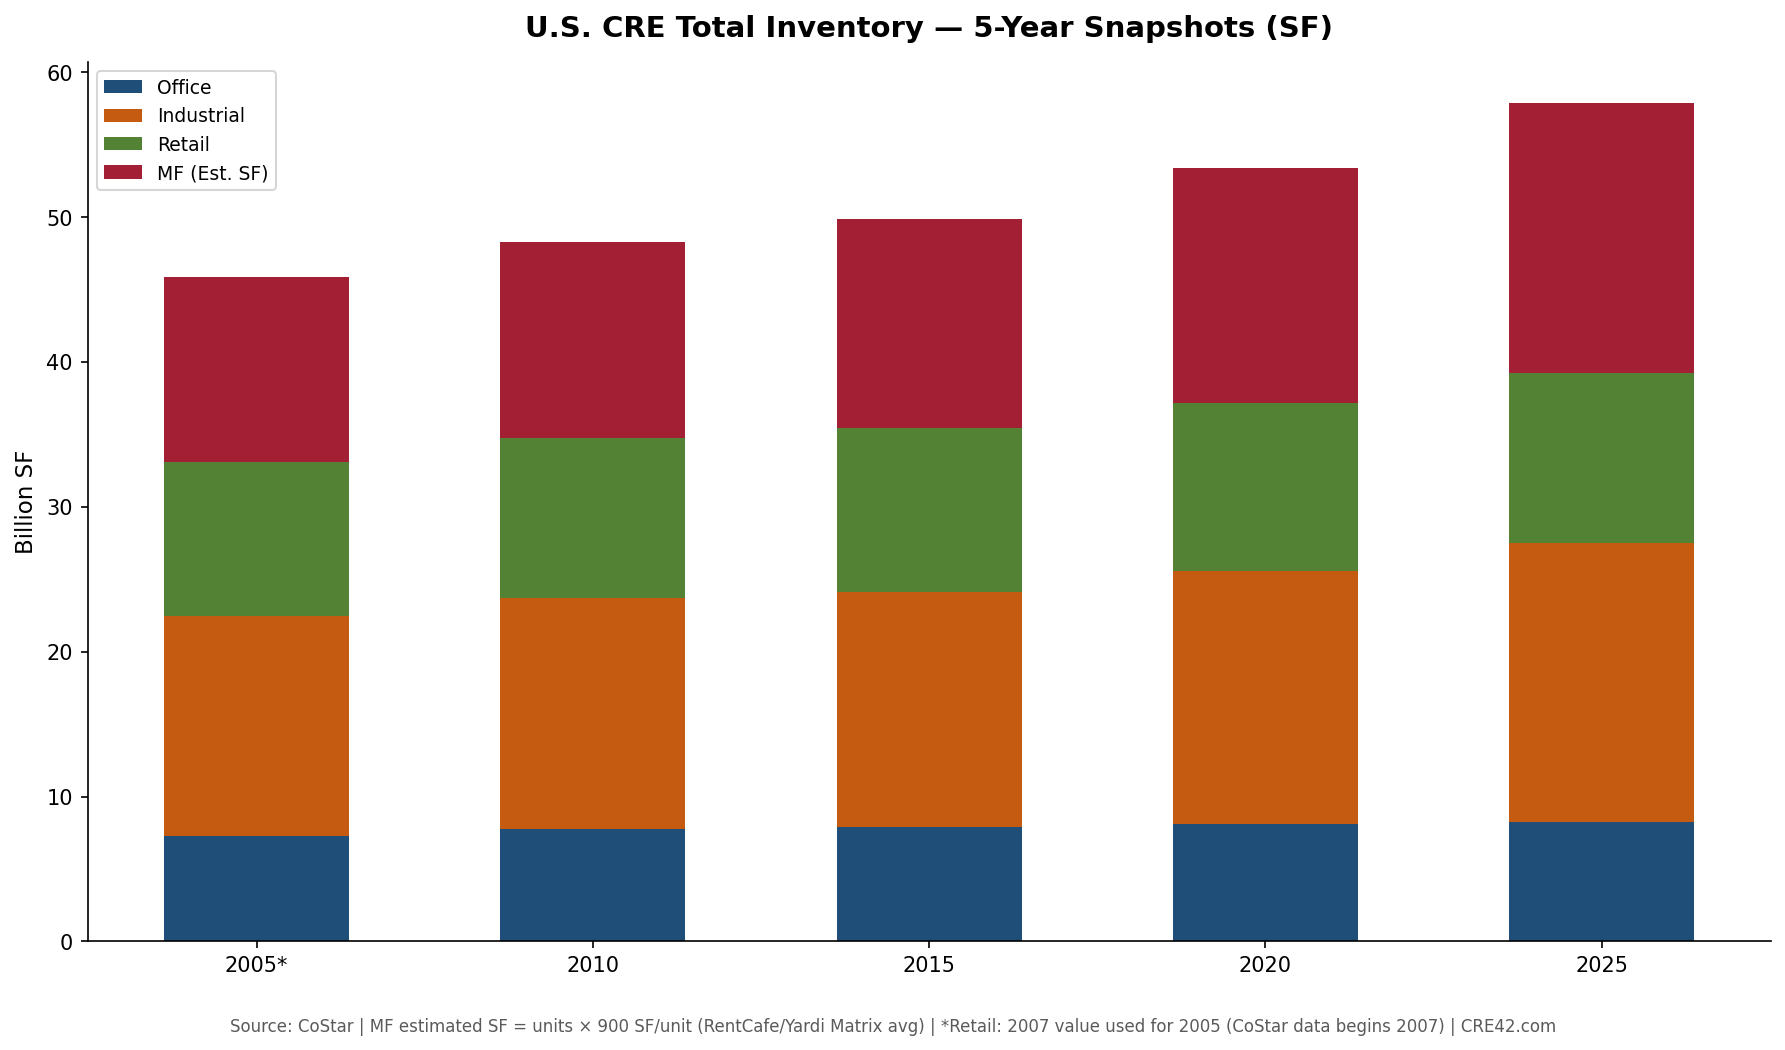
U.S. CRE Total Inventory — 5-Year Snapshots (SF) | Source: CoStar; MF estimated at 900 SF/unit | Chart: CRE42
Total U.S. CRE inventory across the four major asset types grew from roughly 46 billion SF in 2005 to 58 billion SF in 2025 — a 26% increase — with industrial and multifamily contributing virtually all of the net growth.