Overview
The United States has more retail space per capita than any other developed nation — roughly 23.5 square feet per person by the late 2000s, compared to 5.0 in the United Kingdom and 1.7 in Japan.[1] The “retail apocalypse” narrative that dominated investor sentiment throughout the 2010s was correct in that the U.S. was massively oversupplied in certain formats (e.g. secondary malls and department stores), but was overly pessimistic with respect to others, including open air centers (especially grocery anchored) and single tenant NNN leased properties (see Retail Format Divergence: Seven Asset Classes Under One Label). Physical retail still accounts for approximately 84% of total U.S. retail sales,[2] which themselves have more than doubled since 2000 to over $7 trillion.[3] Meanwhile, investor flight from the sector halted new construction, more than 400 million square feet was demolished,[4] and vacancy rates fell to 20-year lows by 2024.[5]
E-Commerce as % of Total U.S. Retail Sales (2000–2024)
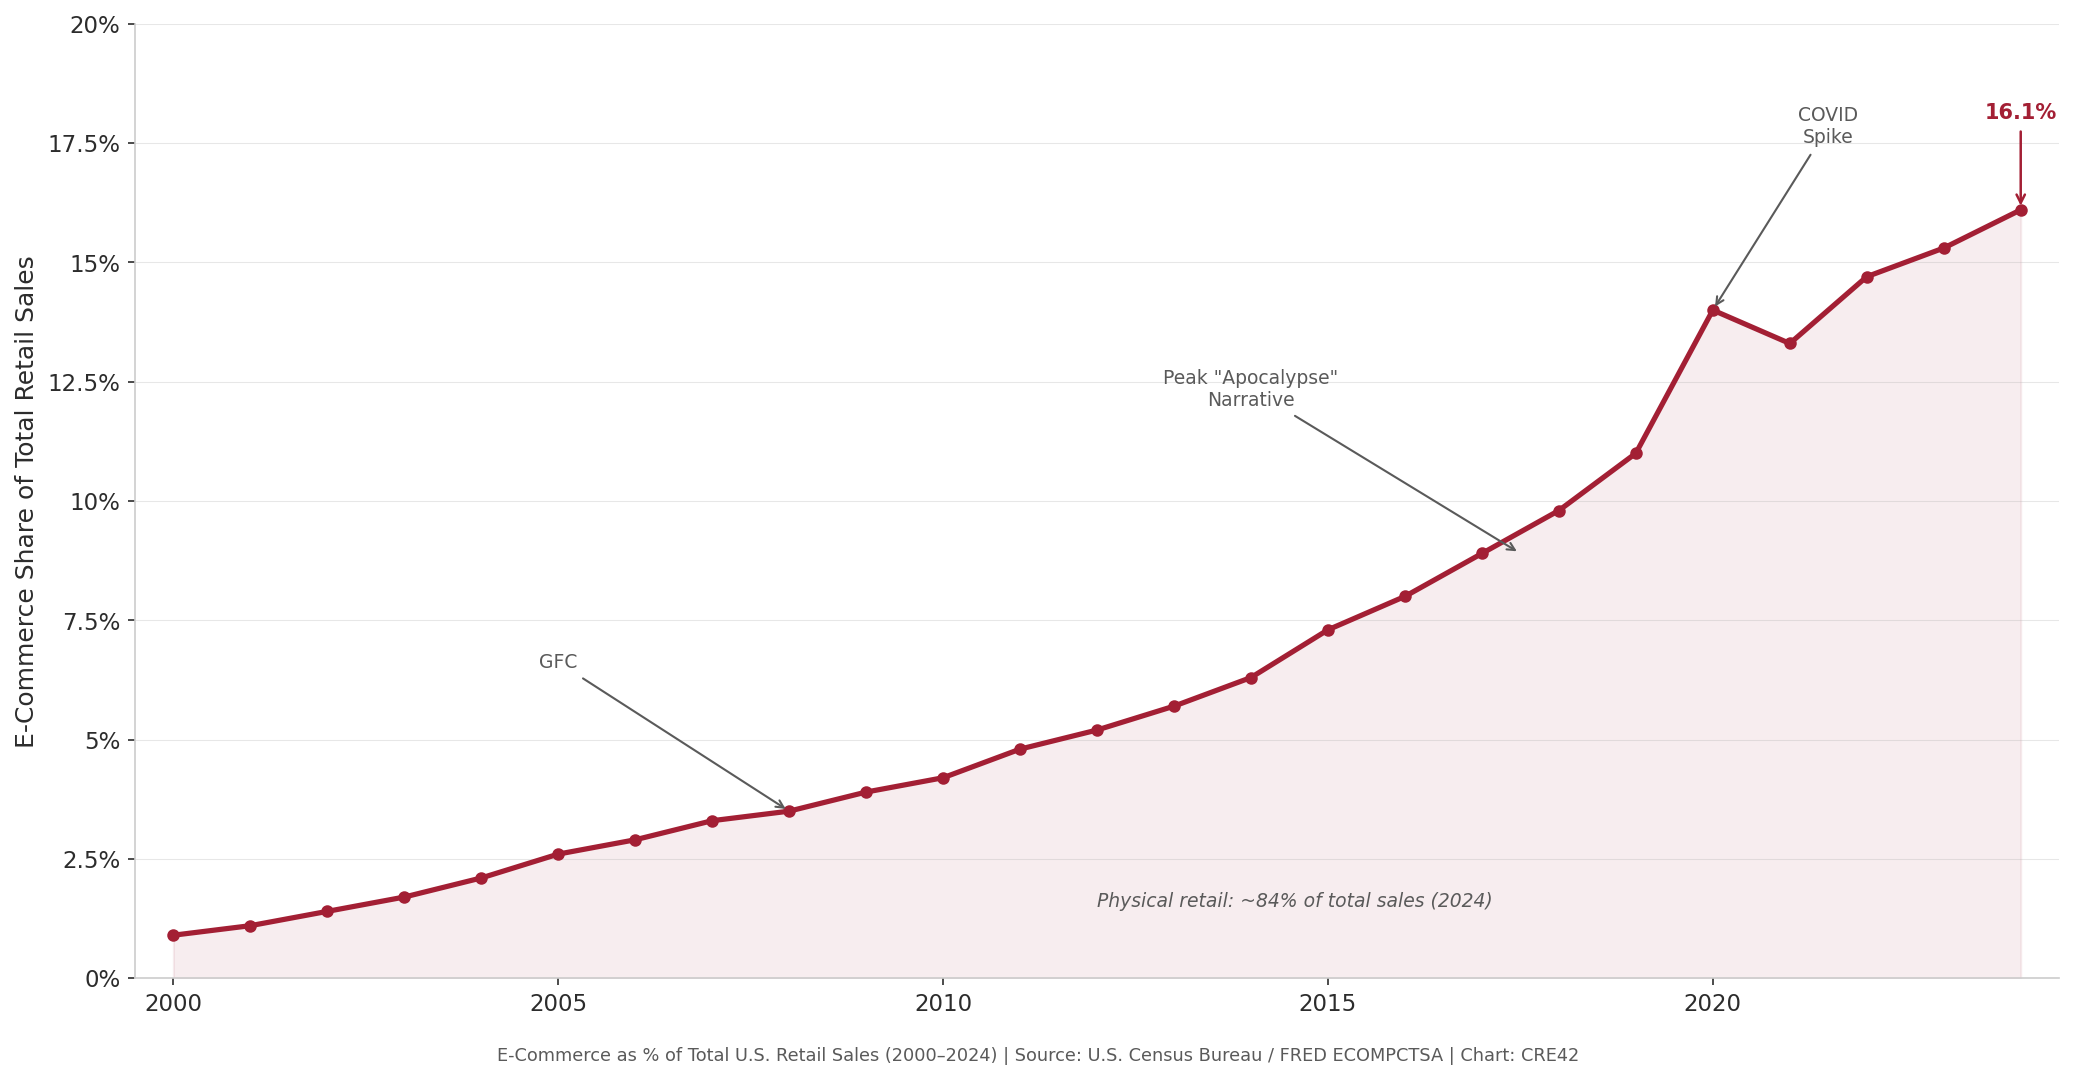
E-Commerce as % of Total U.S. Retail Sales (2000–2024) | Source: U.S. Census Bureau / FRED ECOMPCTSA
Retail Square Feet Per Capita — International Comparison
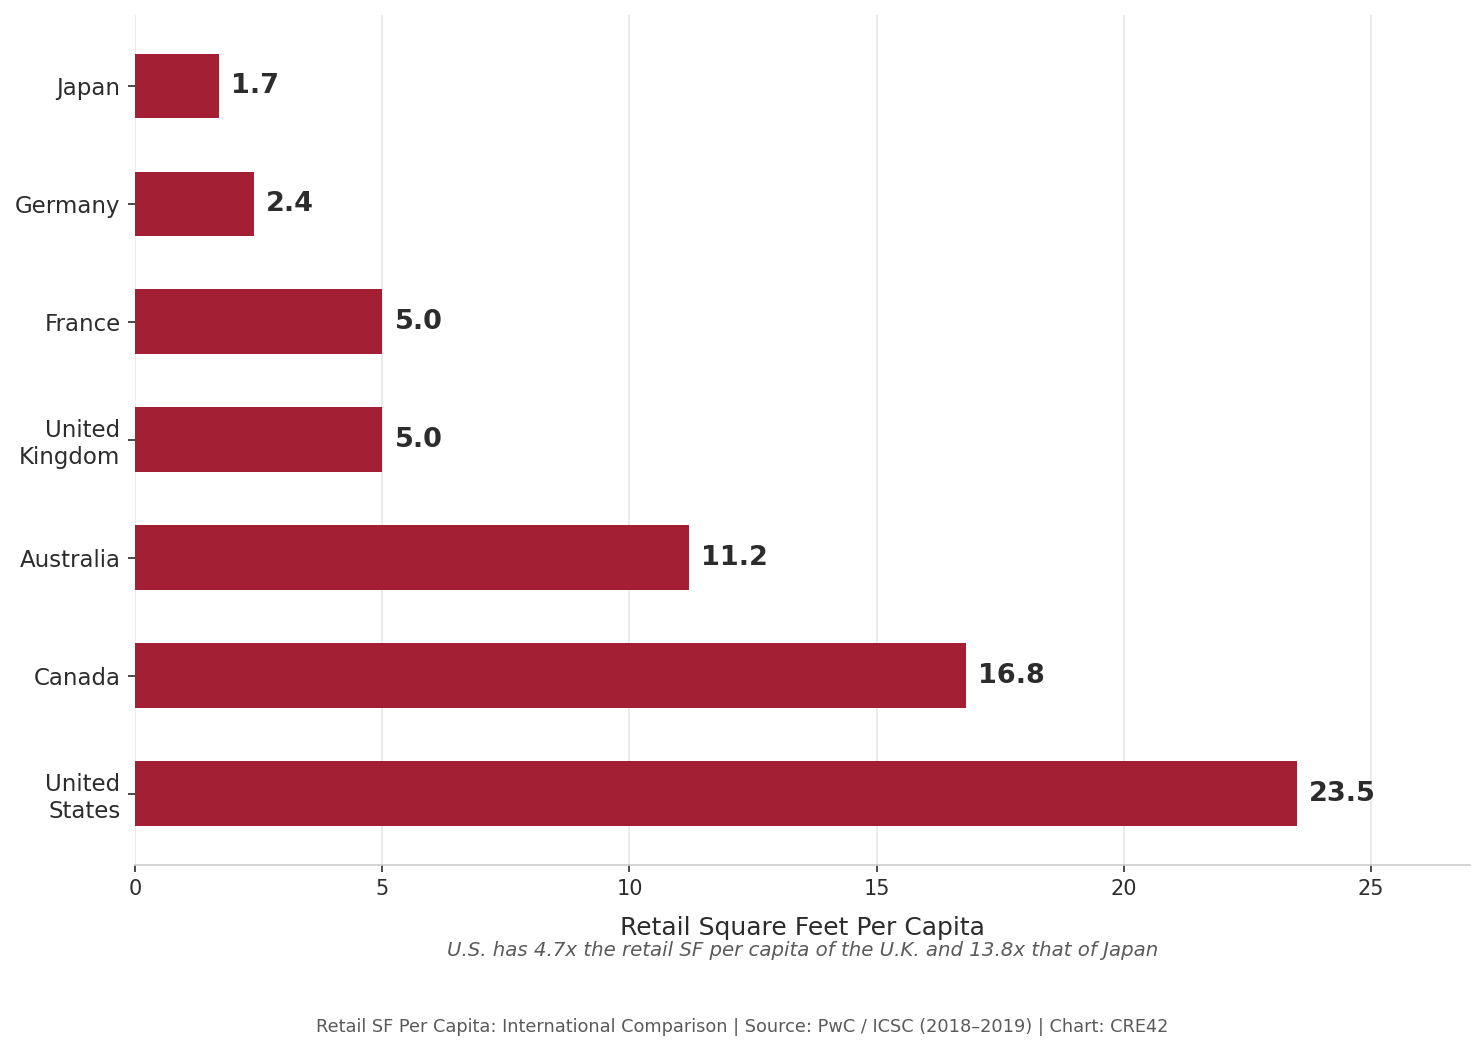
Retail SF Per Capita: International Comparison | Source: PwC / ICSC (2018–2019)
Note: Covers leasable shopping center space. Data vintage 2018–2019; the U.S. figure has likely declined modestly since then due to demolitions and limited new construction.
Total U.S. Retail Sales — Physical Retail & E-Commerce (2000–2024)
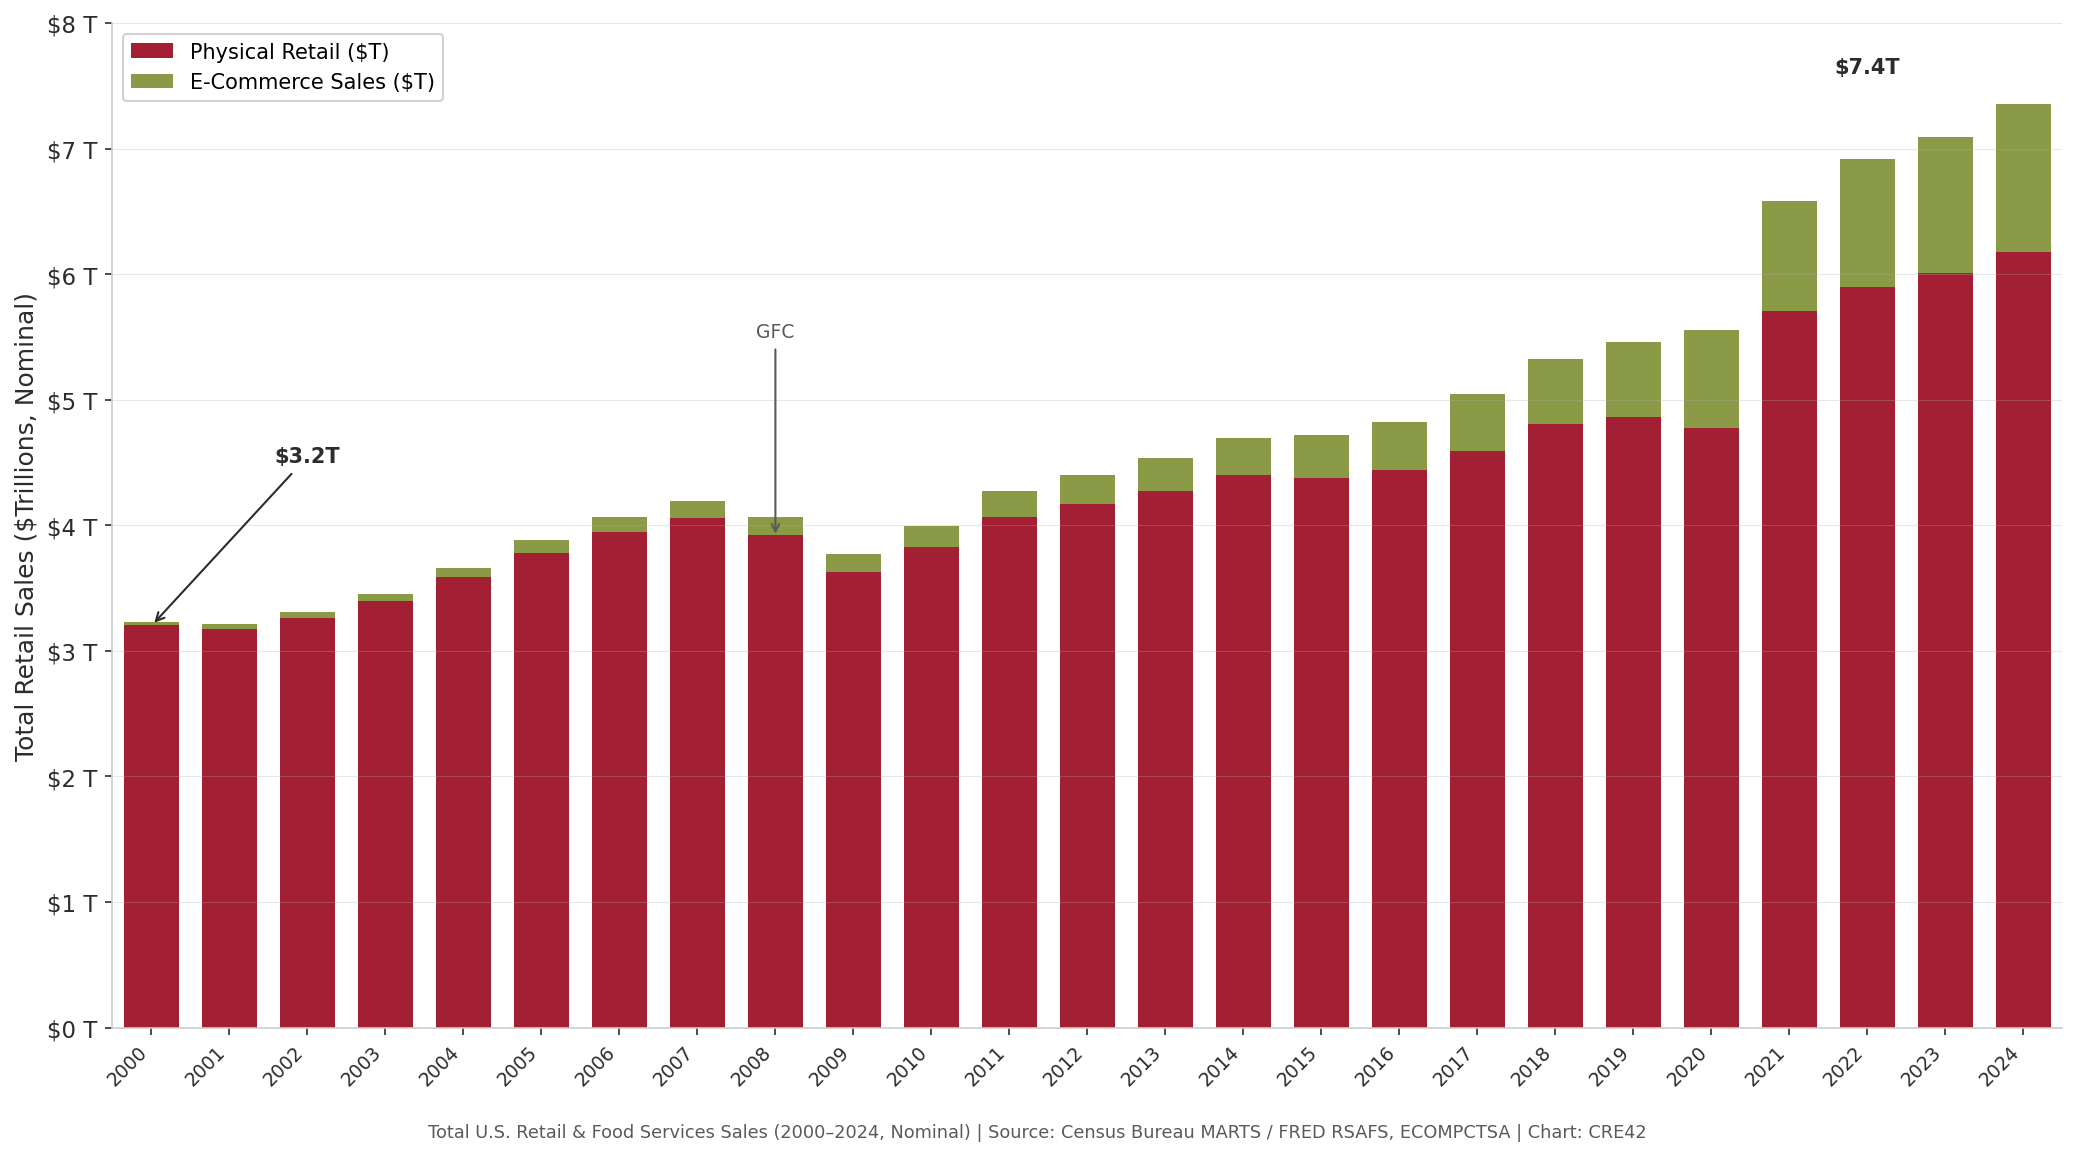
Total U.S. Retail & Food Services Sales (2000–2024, Nominal Dollars) | Source: Census Bureau MARTS / FRED RSAFS, ECOMPCTSA
Note: Nominal dollars (not inflation-adjusted). Real growth is more modest but still positive. 2024 figure is preliminary.
Document Links
retail-ecommerce-apocalypse.xlsx — E-commerce penetration, total retail sales, international SF comparison, vacancy history, rents, transaction volume, and construction data
🔗 CBRE Investment Management: “U.S. Retail’s Renaissance?” (May 2025) — Overview of retail sector supply dynamics and investment thesis
🔗 Richmond Fed: “The Economic History of the Shopping Mall” (2022) — Historical context on U.S. mall construction and suburban retail expansion
More granular market-level data — including metro-level vacancy, rent, and absorption by retail subtype — is available in the companion page, which includes restricted third-party data available only to students of MIT Center for Real Estate course 11.S969.
Key Observations
Context & Discussion
U.S. Retail Supply Boom
The U.S. retail building boom accelerated in the 1970s and 1980s, when enclosed mall construction averaged roughly 60 new malls per year through the late 1970s.[9] By the early 2000s, the country had accumulated over 1,500 enclosed malls and billions of square feet of shopping center, power center, and strip retail space. From 2000 to 2008, annual retail supply growth ran 2.0%–2.7%, roughly double the rate of population growth, and retail space per capita rose from approximately 52 to 57 square feet.[4] Suburban expansion, particularly in fast-growing Sunbelt markets, drove much of this growth. Jefferies analyst Randal Konik estimated that of roughly 1,350 enclosed malls in the U.S., only 200 to 400 were economically necessary.[10] PwC’s Byron Carlock suggested that convergence toward Canadian levels (~16 SF per capita) would imply a reduction of roughly 30% of U.S. retail space.[1]
E-Commerce — Gradual Disruption
Amazon was founded in 1995. E-commerce accounted for approximately 1% of total retail sales by 2000 and grew steadily — to 3.5% by 2008, 11% by 2019, and 16.1% by 2024.[2] The COVID-19 pandemic produced a spike to roughly 14% in 2020 as lockdowns shifted purchasing online, but the reversion was swift: by 2021, the share had partially pulled back, and by 2022–2024 it resumed its pre-pandemic linear trend. The 25%+ e-commerce share that many analysts projected during COVID has not materialized. Categories like groceries, restaurants, personal services, fitness, and healthcare have proven resistant to online substitution. Total U.S. retail and food services sales grew from $3.2 trillion in 2000 to $7.4 trillion in 2024.[3] E-commerce captured a growing share of a growing pie — but the pie itself continued to expand, and physical retail sales grew from roughly $3.2 trillion to $6.2 trillion over the same period.[2][3]
The Sentiment Overshoot (2015–2020)
The “retail apocalypse” narrative built steadily following the Great Financial Crisis. Coresight Research tracked approximately 7,000 store closures in 2017 — a record at the time — followed by roughly 9,300 in 2019 and an estimated 10,000 in 2020 during COVID.[6] Credit Suisse predicted in 2017 that 25% of U.S. malls would close by 2022. Green Street Advisors projected 15%. Urban Outfitters CEO Richard Hayne compared the sector to the pre-crisis housing market in early 2017, calling the overbuilding of the 1990s and 2000s a bubble that had burst. Hedge funds shorted retail REITs. CoStar reported a record 145 million SF of retail space vacated in 2018. Sears and Kmart filed for bankruptcy in October 2018. The narrative was not entirely wrong: secondary enclosed malls, department store anchors, and commodity apparel chains were structurally impaired. But the narrative failed to distinguish between formats, overstated the timeline, and — most critically for CRE investors — did not account for the supply-side response.
New Supply Collapse
Development capital shifted to multifamily, industrial, and later data centers. Retail construction fell to roughly 0.5% of inventory annually from 2009 through 2024.[4] Over 400 million SF of retail space was demolished during this period, with much of the land redeveloped into multifamily housing.[4] By 2025, annual deliveries fell to 10.2 million SF, an all-time low, and retail space per capita declined and is projected to continue falling.[4]
Construction remains suppressed in 2026 despite improved fundamentals. Construction costs rose roughly 40–45% from 2019 to 2024 across commercial building types. Financing costs remain elevated. The best retail locations — high-traffic intersections, grocery-anchored pads, dense suburban corridors — are often already built out, and remaining developable sites tend to be secondary locations or complex infill parcels. Lenders remain cautious, carrying institutional memory from the retail distress cycle.
Where Retail Stands Today (Q4 2025)
Vacancy rates are near 20-year lows. Cushman & Wakefield reported 5.7% for shopping centers in Q4 2025, up 40 basis points year-over-year from a 5.3% trough but still well below the ~7% pre-pandemic norm.[5] JLL and Colliers, using CoStar’s broader all-retail national index (which includes malls and freestanding retail), reported 4.3%.[7][8][11] Colliers’ subtype breakdown shows malls at 8.5% vacancy and shopping centers at 5.2%, both down 10 basis points from Q3.[8] National asking rents ranged from $25.29/SF (C&W)[5] to $26.13/SF (Colliers),[8] all trending upward. Retail investment transaction volume reached $60 billion in 2025, up 27% year-over-year, with institutional investors accounting for approximately 20% of total retail investment — their highest share in a decade.[7] The under-construction pipeline of 12.7 million SF is the strongest in five years but still represents just 0.3% of existing inventory, half the long-term average.[5]
Notes
[1] PwC U.S. Real Estate Practice / ICSC. Retail Square Feet Per Capita: International Comparison (2018–2019). ↩
[2] U.S. Census Bureau. Quarterly Retail E-Commerce Sales (FRED: ECOMPCTSA). fred.stlouisfed.org/series/ECOMPCTSA ↩
[3] U.S. Census Bureau. Monthly Retail Trade Survey — MARTS (FRED: RSAFS). fred.stlouisfed.org/series/RSAFS ↩
[4] CBRE Investment Management. “U.S. Retail’s Renaissance?” (May 30, 2025). cbreim.com/insights/articles/us-retails-renaissance ↩
[5] Cushman & Wakefield. U.S. Retail MarketBeat, Q4 2025. ↩
[6] Coresight Research. Store Tracker Annual Reviews (2017–2025). coresight.com ↩
[7] JLL Research. Retail Market Dynamics, United States, Q4 2025. ↩
[8] Colliers Research / CoStar Analytics. U.S. Retail Market Statistics, 4Q25. ↩
[9] Federal Reserve Bank of Richmond. “The Economic History of the Shopping Mall” (2022). richmondfed.org ↩
[10] Jefferies (Randal Konik). U.S. Mall Excess Capacity Estimate (cited in multiple financial press reports, 2017). ↩
[11] The difference between the C&W and JLL/Colliers vacancy figures reflects methodology, not disagreement: C&W’s universe covers shopping centers only and excludes malls and freestanding retail. ↩
Methodology & Data Notes
E-Commerce Data
Annual e-commerce share figures are Q4 seasonally adjusted values from FRED ECOMPCTSA, used as proxy for full-year share. The Census Bureau’s full-year 2024 estimate is 16.1%. Minor definitional differences exist across Census publications regarding the inclusion of food services in the denominator.
Total Retail Sales
Total U.S. retail and food services sales from Census Bureau MARTS / FRED RSAFS. Figures are nominal (not inflation-adjusted). The 2024 figure is a preliminary estimate based on monthly data through December 2024. Real (constant-dollar) retail sales growth is more modest — approximately 40–50% over the 2000–2024 period vs. 128% in nominal terms.
SF Per Capita
PwC/ICSC data from 2018–2019 studies. The 23.5 SF/capita figure covers leasable shopping center space. Some sources cite approximately 46 SF/capita when including all retail formats (non-leasable, freestanding, etc.). International comparisons use the leasable metric for consistency. No updated international comparison from PwC/ICSC has been published since 2019.
Vacancy Rate Differences
Cushman & Wakefield (5.7%, Q4 2025) covers shopping centers only: community/neighborhood, power/regional, and strip centers. This universe excludes enclosed malls, outlet centers, and freestanding retail. JLL and Colliers (4.3%) use CoStar’s national index, which covers all retail formats including malls and freestanding. The lower JLL/Colliers figure reflects the inclusion of freestanding retail (general retail), which has extremely tight vacancy (~2.6%). These are methodological differences, not disagreements about market conditions.
Historical Data Quality
Vacancy and rent figures before 2022 in the accompanying spreadsheet include approximate values read from chart visuals in brokerage reports, interpolated between known data points, or sourced from secondary press coverage. These are flagged with asterisks (*) in the spreadsheet. Figures from 2022 onward are exact, taken from report text and data tables.
CBRE Investment Management Data
The CBRE IM article “U.S. Retail’s Renaissance?” (May 2025) is cited for general trend descriptions — e.g., construction averaged roughly 0.5% of inventory annually, over 400 million SF demolished, retail space per capita peaked around 57 SF. Specific proprietary data tables from CBRE IM are not reproduced. The CBRE IM Figure 1 chart (annual supply growth and retail SF per capita) uses CoStar data licensed to CBRE IM.