Overview
The U.S. office market experienced the deepest and most prolonged correction in modern commercial real estate history between 2020 and 2024, driven by the structural adoption of remote and hybrid work. National vacancy rose approximately 710 basis points — from 12.5% in early 2019 to 19.6% by the end of 2025 — while the construction pipeline collapsed 87% from its pre-pandemic peak. This page synthesizes Q4 2025 reports from CBRE, JLL, Colliers, and Cushman & Wakefield into a market-capitalization-weighted composite (the “CRE42 Composite”), tracking vacancy, net absorption, construction, and rents quarterly from Q1 2019 through Q4 2025.
Chart: CRE42 Composite — Net Absorption & Vacancy Rate
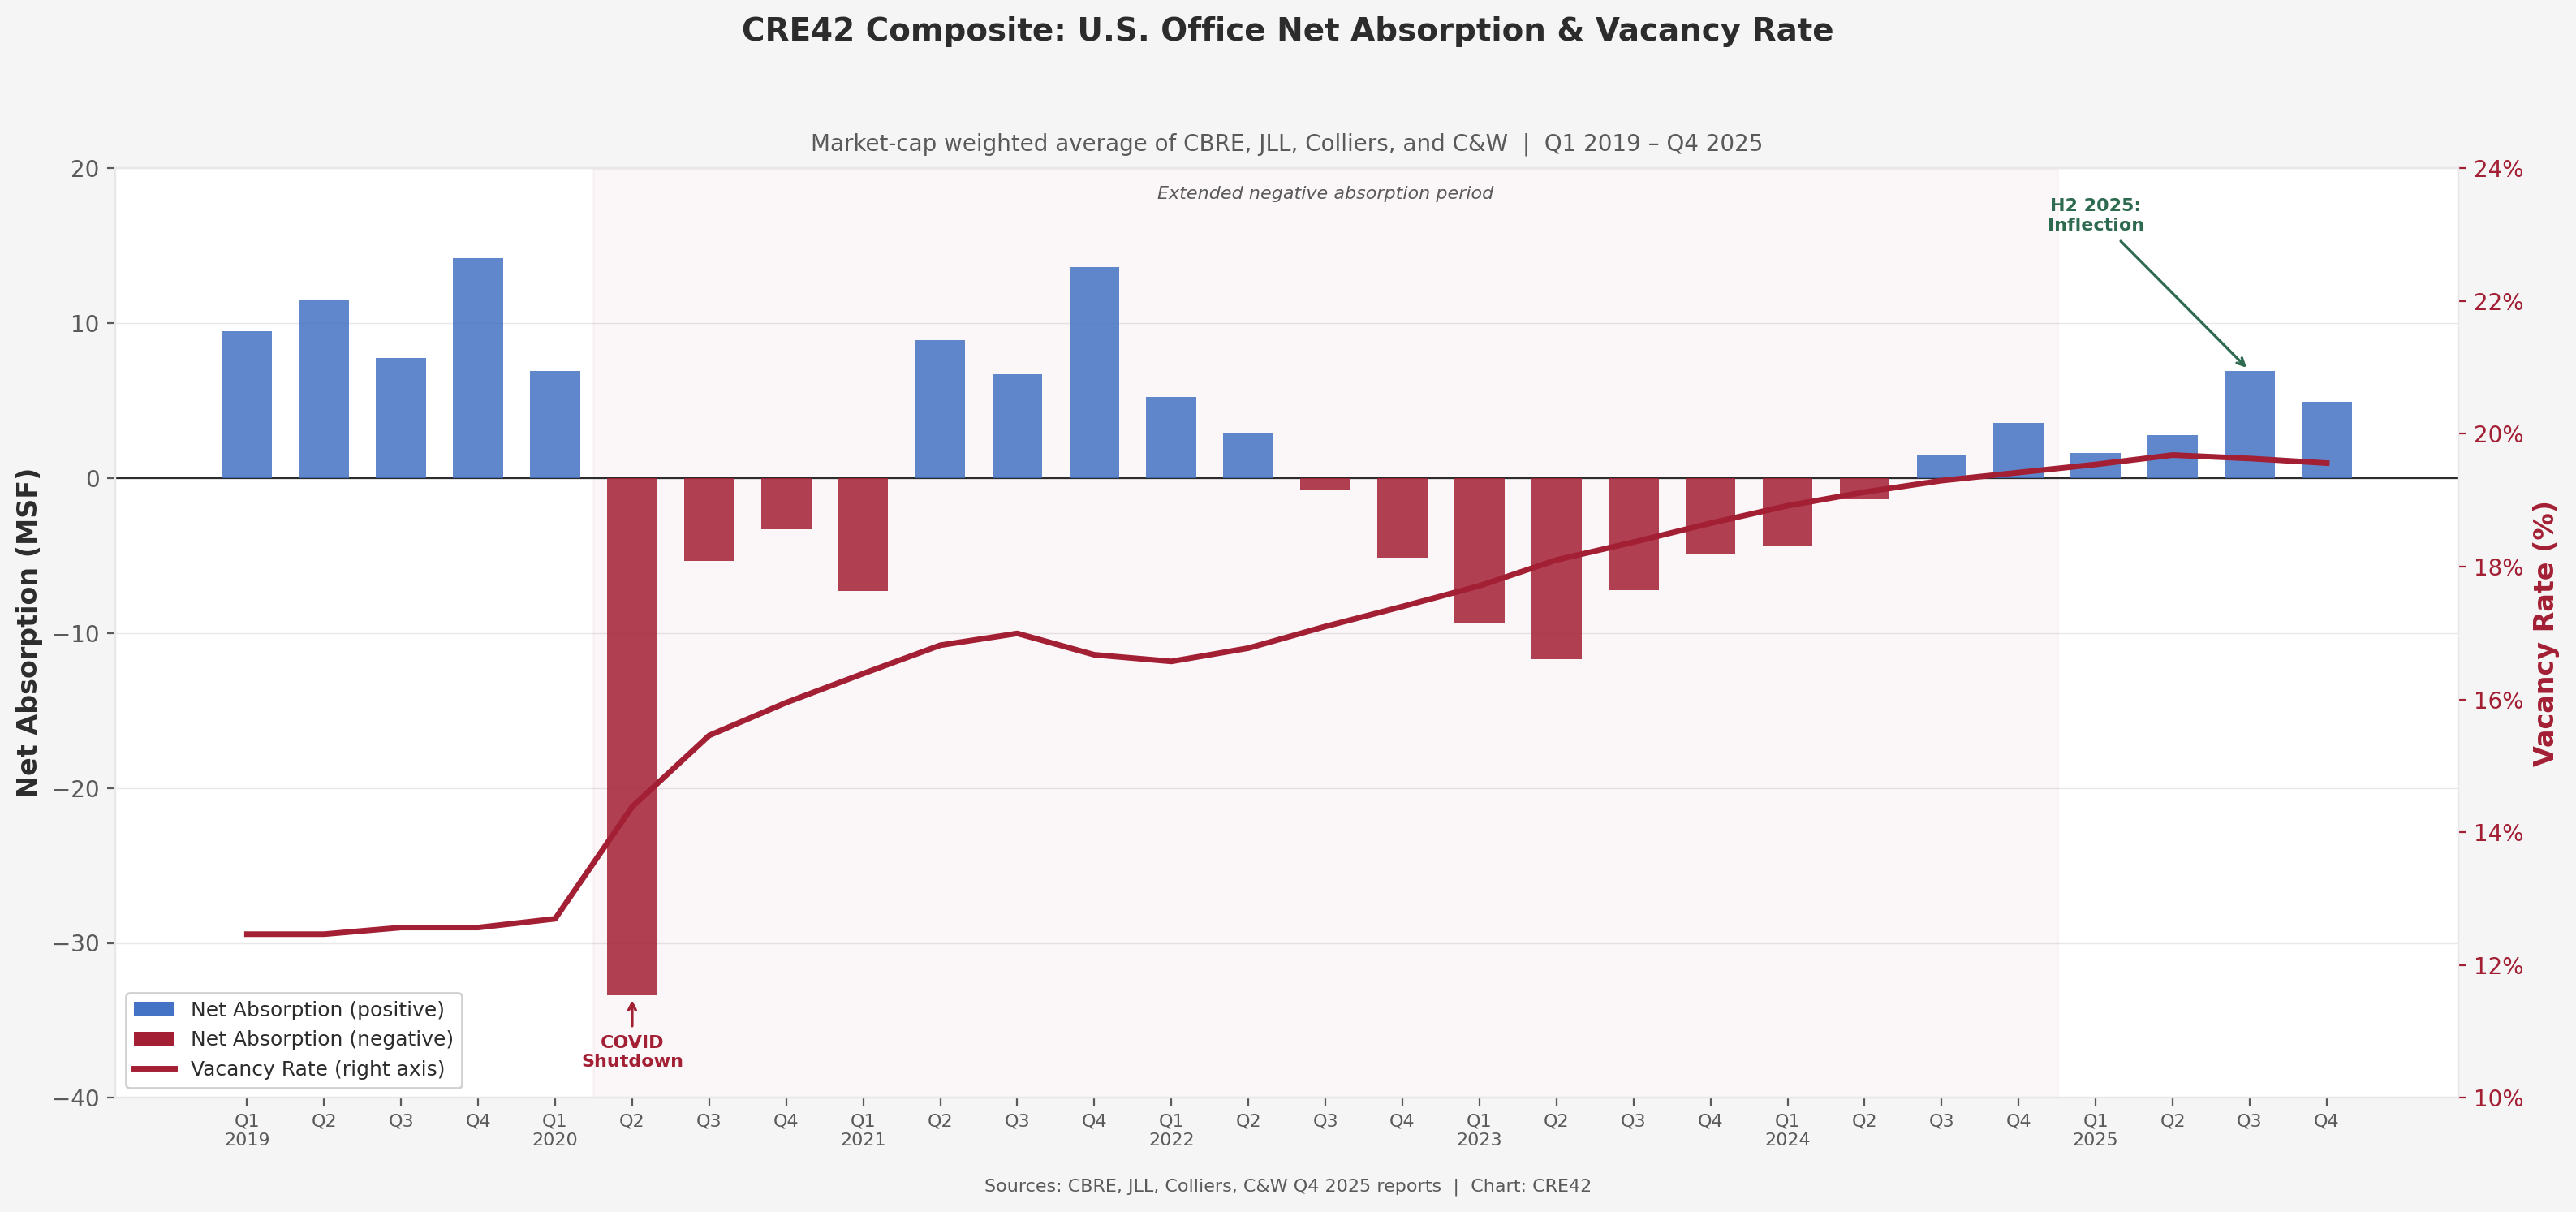
CRE42 Composite: U.S. Office Net Absorption & Vacancy Rate, Q1 2019 – Q4 2025 | Source: CBRE, JLL, Colliers, C&W | Chart: CRE42
Market-cap weighted average (CBRE 63%, JLL 22%, Colliers 10%, C&W 5%). Pre-Q4 2024 values estimated from published charts; Q4 2024–Q4 2025 from reported tabular data.
Chart: U.S. Office Supply Dynamics — Completions vs. Removals
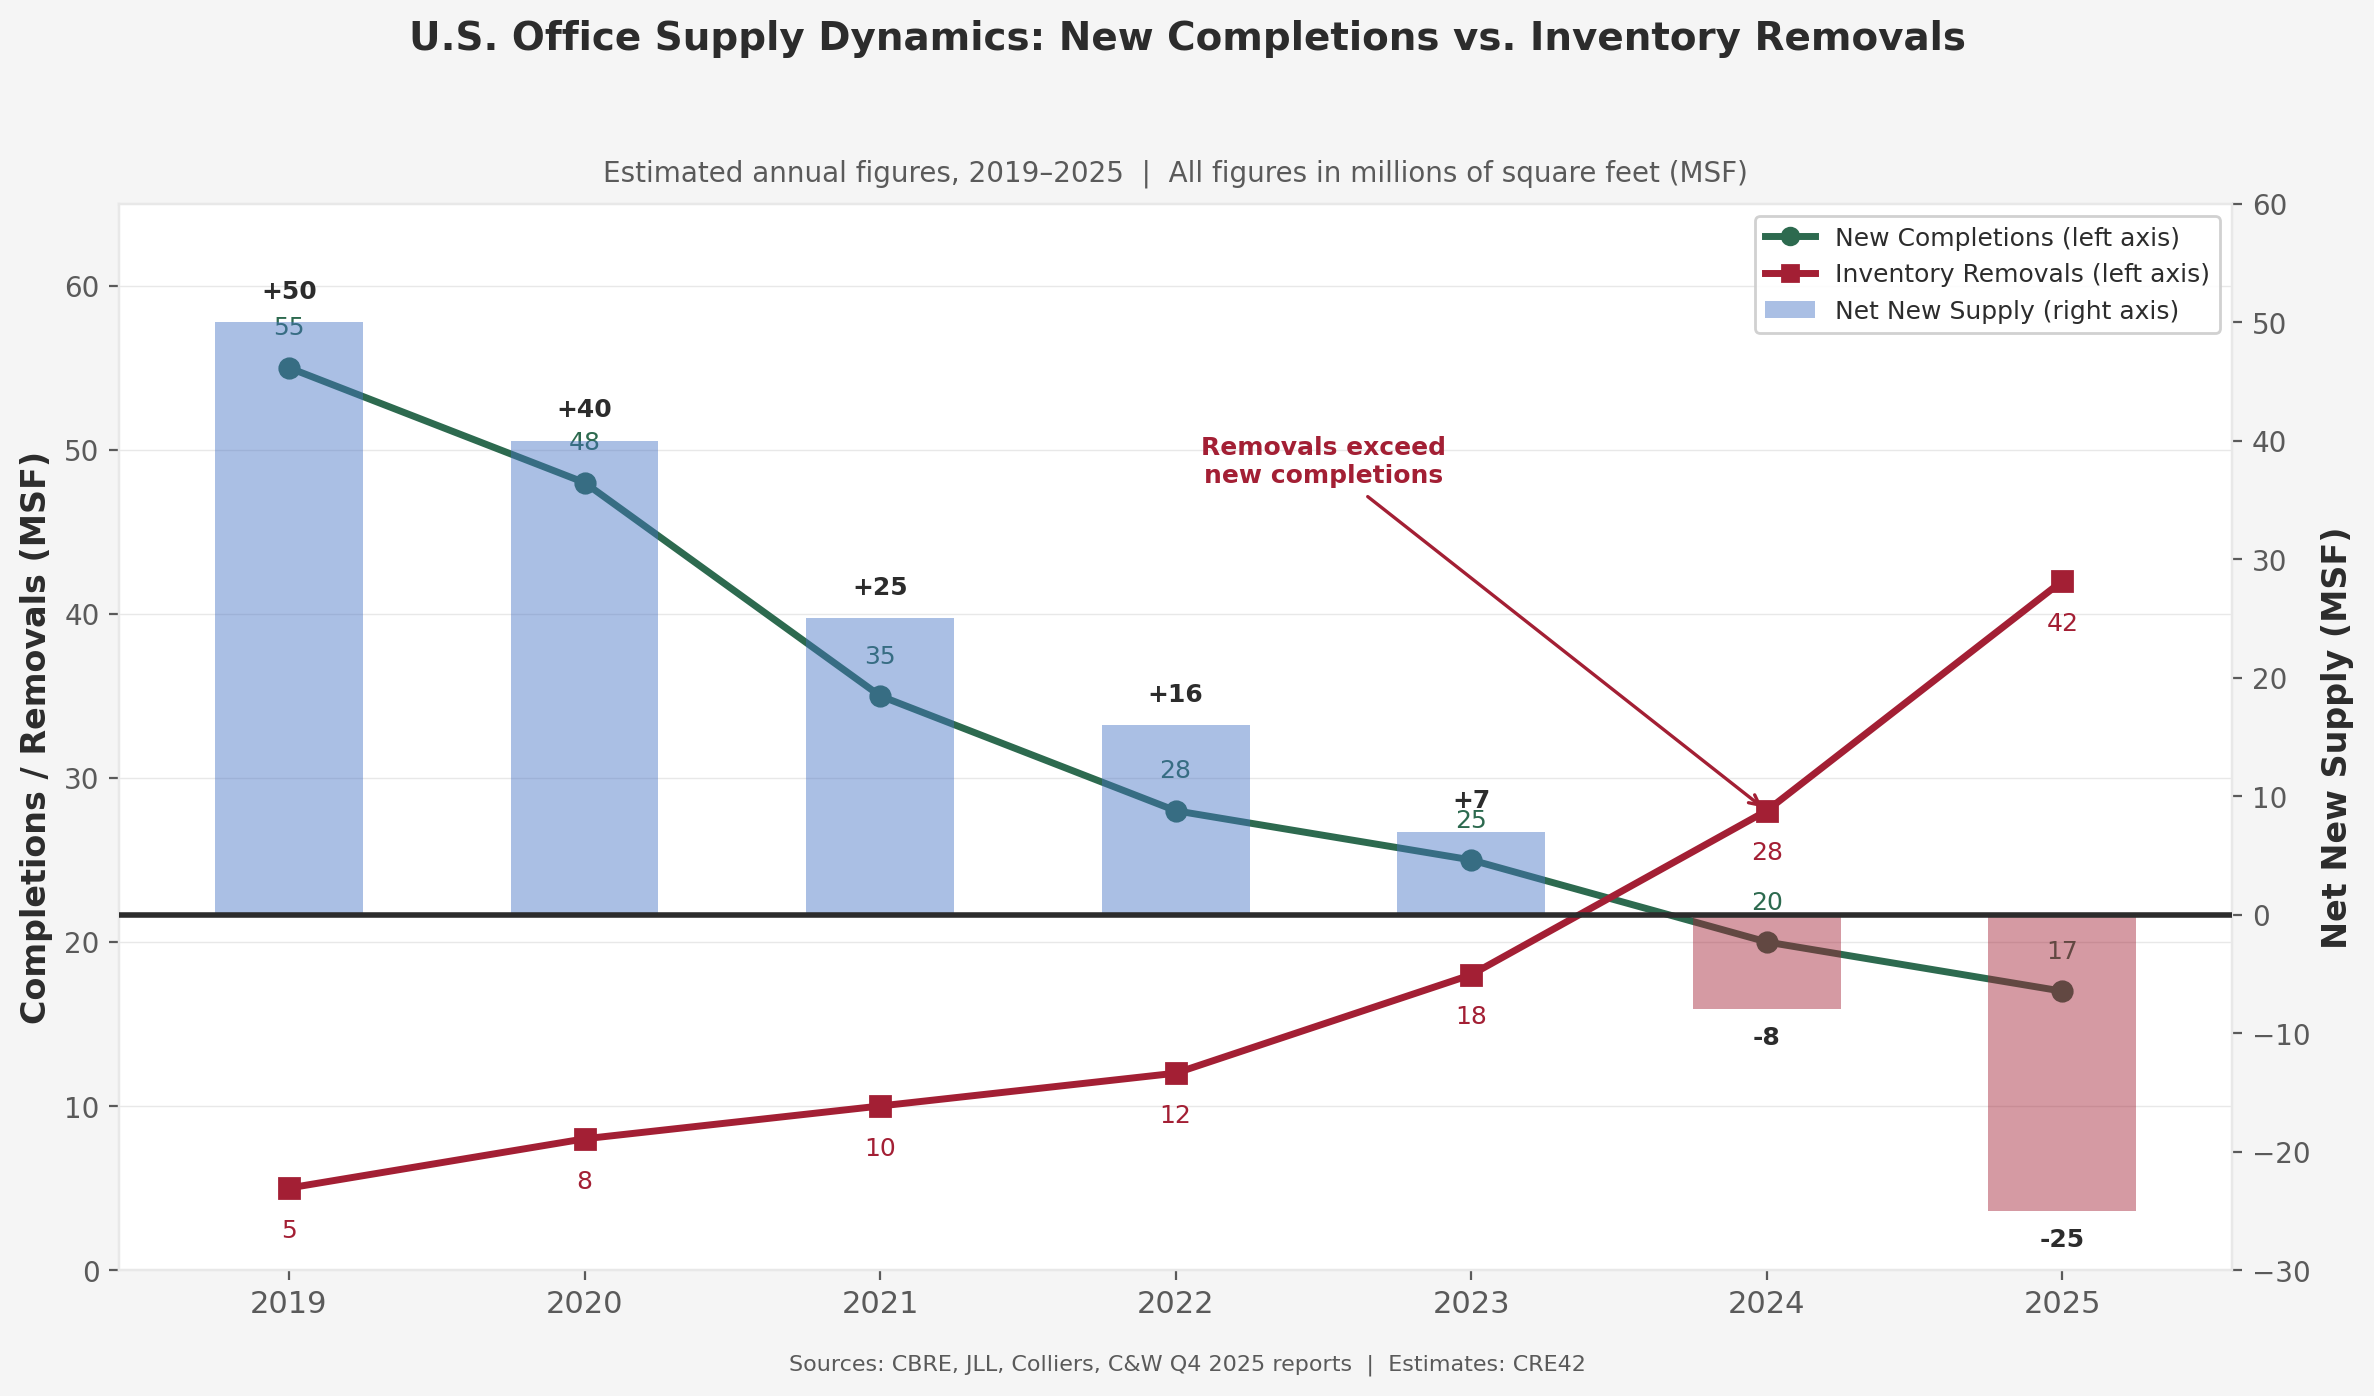
U.S. Office Supply Dynamics: New Completions vs. Inventory Removals, 2019–2025 | Source: CBRE, JLL, Colliers, C&W | Estimates: CRE42
Removals include demolitions and conversions to residential, lab, hotel, and other uses. Net new supply turned negative in 2024 for the first time in modern records.
Document Links
office-us-market.xlsx — Complete quarterly composite data, individual brokerage detail, Q4 2025 cross-brokerage snapshot, supply dynamics, C&W metro-level absorption, methodology
Key Observations
Context & Discussion
Pre-Pandemic U.S. Office Market (2019)
In late 2019, the U.S. office market was in the final stages of a decade-long expansion. National vacancy stood at approximately 12.5% (CRE42 Composite), annual net absorption averaged 40–50 MSF, and over 130 MSF of new space was under construction. Work-from-home and hybrid arrangements existed, particularly in the technology sector, but remained a small fraction of overall office usage — the vast majority of tenants operated on a five-day, fully in-office basis. Construction was near cycle highs, and coworking operators, led by WeWork, had become among the largest tenants in several gateway markets, introducing an element of speculative demand that would later unwind.
Pandemic-Driven Correction (2020–2024)
Remote work adoption emptied office buildings in Q2 2020, and unlike prior recessions, tenants did not simply pause leasing — they actively shed space. Companies that had expanded through 2019 reduced footprints by an estimated 9% on average even as headcount grew roughly 5% (JLL), a structural shift that played out over several years rather than a single quarter. Sublease inventory surged to record levels as tenants marketed space they no longer intended to occupy. The correction was compounded by a construction pipeline that continued delivering 30–50 MSF annually through 2021–2022 into rapidly weakening demand. Cumulative negative net absorption over the 2020–2024 period totaled roughly 80–120 MSF (range reflecting different brokerage methodologies), and vacancy rose approximately 700 basis points from its pre-pandemic level.
Recovery Signals (H2 2025)
Net absorption turned positive in Q3 and Q4 2025 at a meaningful scale, with the CRE42 Composite showing approximately +16 MSF for the full year. Sublease availability declined 20–30% from peak, and the pace of vacancy increases slowed to its smallest increment since 2020. Several factors converged: return-to-office mandates became near-universal among large employers, with 97% of Fortune 100 companies requiring hybrid or full-time attendance (JLL); companies that over-reduced space during the pandemic began re-expanding to match actual headcounts; and the construction pipeline dried up so completely that even modest demand gains started to move fundamentals. Fifty markets posted positive full-year absorption, up from 33 in 2024, and gateway cities — Manhattan, San Francisco, Boston — led with 21–31% year-over-year leasing growth.
U.S. Office Market: 2026 and Beyond
Leasing volume appears to be finding a floor in the 200–225 MSF annual range, roughly 3% below 2019 levels (CBRE). The recovery, however, is uneven. Class A and trophy properties are seeing rising rents and tightening availability, with leases above $100/SF at record volume in gateway CBDs (JLL). Class B and C space continues to struggle — transaction counts are up 26% from 2019 but average deal size is down 23% (CBRE), and leases above 100,000 SF remain approximately 40% below pre-pandemic levels. Office-using employment declined 0.3% in 2025, meaning the demand recovery is driven primarily by occupancy expansion rather than net new hiring — a dynamic with limited remaining runway if hiring does not resume. On the supply side, new completions in 2025 totaled approximately 17 MSF while demolitions and conversions removed an estimated 42 MSF, producing a net inventory reduction of roughly 25 MSF. This was the second consecutive year of negative net new supply. The construction pipeline stands at approximately 17 MSF (CRE42 Composite), down 87% from 2019 levels, and new groundbreakings totaled just 7.4 MSF in 2025 — nearly half from three New York City projects (JLL). Developers require near-record rents and substantial preleasing before breaking ground, and institutional lenders remain largely unwilling to fund new office construction.
Sources
1. CBRE Research. U.S. Office Figures, Q4 2025. Vacancy, absorption, completions, rents, sublease, construction pipeline, prime vs. non-prime data. cbre.com/insights
2. JLL Research. United States Office Market Dynamics, Q4 2025. Vacancy, absorption, deliveries, rents, employment, property clock, Fortune 100 attendance data. jll.com
3. Colliers. U.S. National Office Outlook, Q4 2025. Vacancy, absorption, rents, construction pipeline, sublease, investment volume, regional data. colliers.com/research
4. Cushman & Wakefield. MarketBeat: United States Office, Q4 2025. Vacancy, absorption, rents, construction, inventory by approximately 90 markets. cushmanwakefield.com
5. Colliers. U.S. Office Market Statistics, Q4 2025. Summary infographic: vacancy, absorption, construction, Class A rents. colliers.com/research
6. U.S. Bureau of Labor Statistics. Office-using employment data, 2017–2025. bls.gov
Methodology & Data Notes
CRE42 Composite
The CRE42 Composite is a market-capitalization-weighted average of metrics reported by the four largest publicly traded U.S. commercial real estate brokerages: CBRE (NYSE: CBRE), Jones Lang LaSalle (NYSE: JLL), Colliers International (NASDAQ: CIGI), and Cushman & Wakefield (NYSE: CWK). Weights are based on approximate end-of-2025 market capitalizations: CBRE ~$47B (63.3%), JLL ~$16B (21.6%), Colliers ~$7.5B (10.1%), C&W ~$3.7B (5.0%).
Why Market-Cap Weighting?
Market capitalization reflects the market’s assessment of each firm’s scale, data quality, market coverage, and analytical capabilities. CBRE’s dominant weight (~63%) is appropriate given their position as the world’s largest CRE services firm by revenue and their extensive property-level data collection. Equal weighting would give C&W (which reported −6.7 MSF annual absorption due to its methodology for counting demolished occupied space) the same influence as CBRE (which reported +21.0 MSF). Weights are fixed annually to avoid rebalancing noise.
Why Metrics Differ Across Brokerages
Each brokerage tracks a different universe of U.S. office properties: Colliers tracks the broadest set at approximately 6.1 billion SF (including buildings as small as 10,000 SF), C&W tracks approximately 5.4 billion SF, JLL tracks approximately 4.8 billion SF, and CBRE tracks an estimated 4.5 billion SF of larger competitive properties. Differences in building inclusion criteria, owner-occupied exclusions, government buildings, and R&D/flex classification account for most metric variation. JLL reports both “total vacancy” (22.2%, including occupied sublease) and “direct vacancy” (20.1%); this composite uses JLL’s total vacancy for consistency.
Data Quality
For Q4 2024 through Q4 2025, all four firms provide tabular data extracted directly from reports. For Q1 2019 through Q3 2024, values are estimated by reading published quarterly charts. Chart-estimated values are approximate (±1–2 percentage points for vacancy, ±3–5 MSF for absorption) and are indicated with italic formatting and yellow highlight in the Excel spreadsheet.
Supply Dynamics Estimates
The supply dynamics chart estimates annual new completions and inventory removals (demolitions + conversions) by synthesizing figures from all four brokerage reports. Systematic tracking of inventory removals began around 2023 as conversions accelerated; earlier estimates are rougher. Key reference points: JLL reports approximately 40 MSF removed in 2025; C&W reports 20.7 MSF removed over 6 quarters ending Q4 2025; Colliers cites 100+ MSF in cumulative office removals since 2020.
Net Absorption Spread
The 28 MSF spread between CBRE (+21.0 MSF) and C&W (−6.7 MSF) in full-year 2025 absorption is primarily driven by how each firm accounts for approximately 40 MSF of demolished or converted inventory. When occupied space is demolished, C&W counts the lost occupancy as negative absorption; CBRE may remove the building from its tracked inventory without recording negative absorption. Neither approach is incorrect — they answer different questions about market health.