Overview
The U.S. population aged 75 and older — the primary demand driver for senior living facilities — is projected to grow from 27.4 million in 2025 to 44.8 million by 2045, a 64% increase over two decades. This growth is driven almost entirely by the Baby Boomer generation (born 1946–1964) aging into the 75+ bracket, with the peak cohorts (born 1957–1961) turning 75 between 2032 and 2036.
U.S. Population Aged 75+: 2022–2045
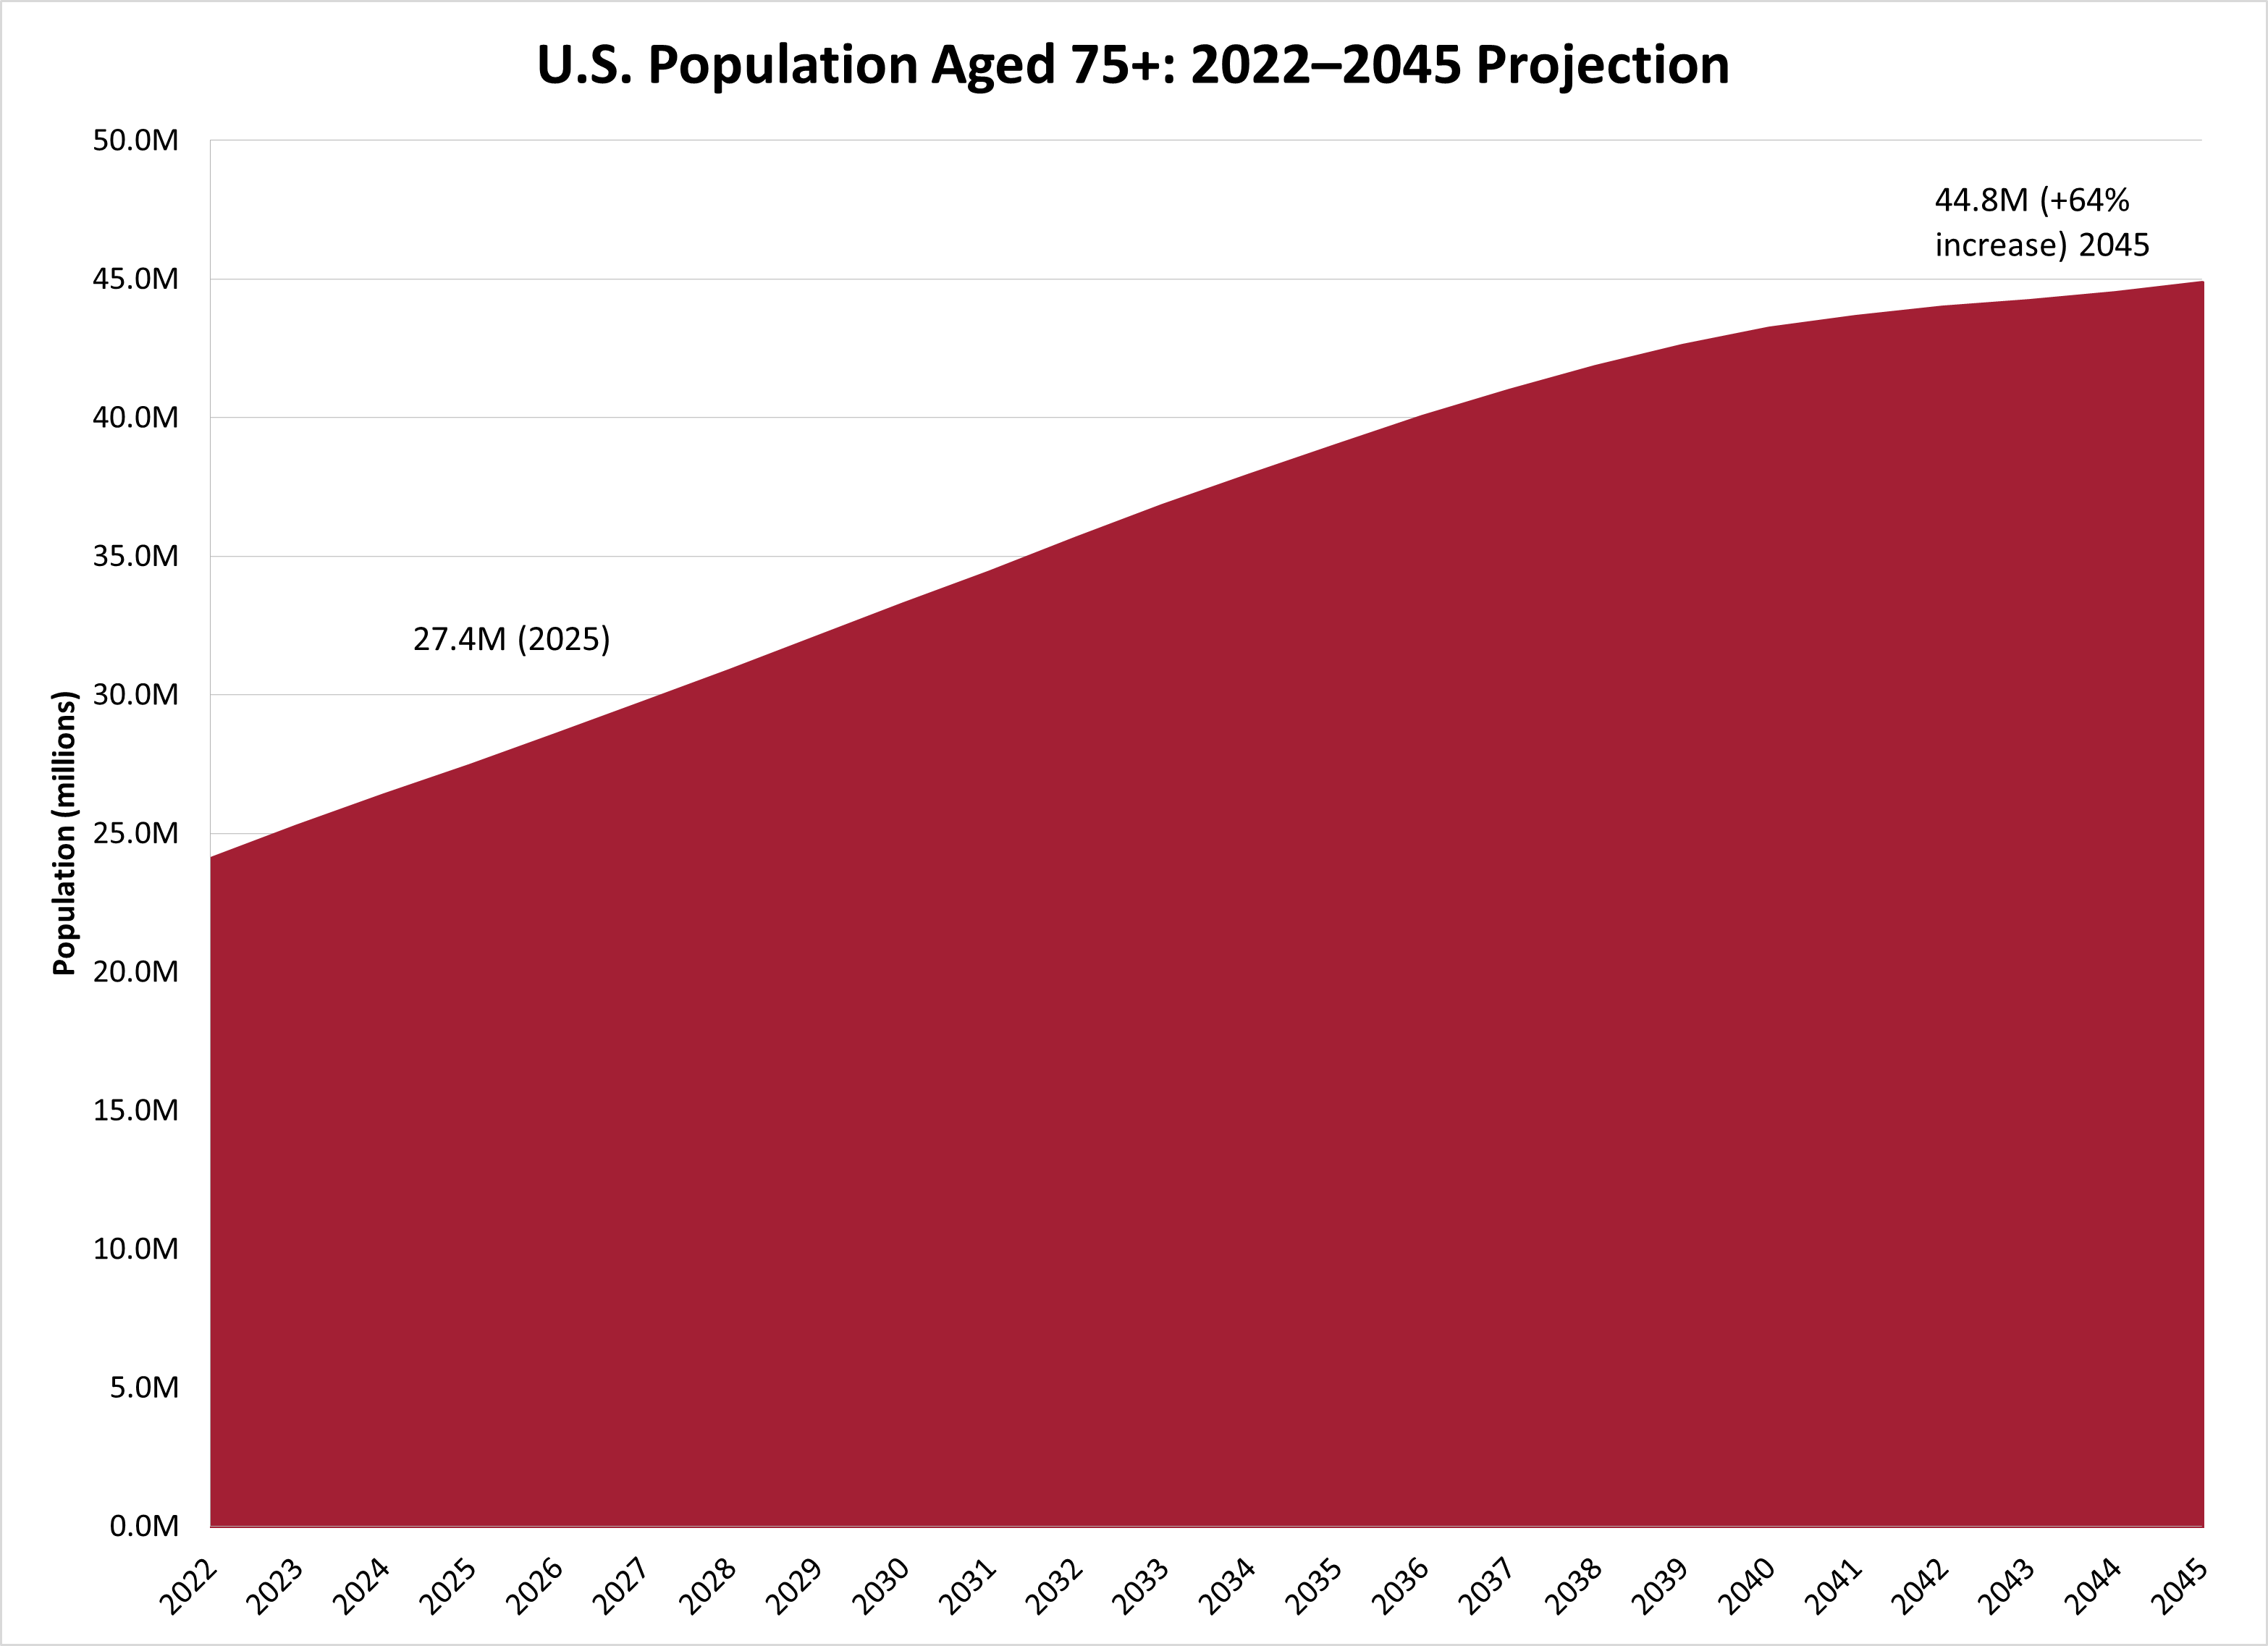
U.S. Population Aged 75+: 2022–2045 Projection
Source: U.S. Census Bureau, 2023 National Population Projections (NP2023-D1, middle series)
The 75+ population grows from 27.4 million in 2025 to 38.9 million by 2035 — a 42% increase in just ten years. Growth continues through 2045, reaching 44.8 million (+64% from 2025), though the rate of increase moderates after 2040 as the trailing edge of the Boomer generation passes through. The steepest acceleration occurs in the late 2020s and early 2030s, when the largest Boomer birth cohorts (4.2–4.3 million births per year in 1957–1961) begin turning 75.
Ages 65–74 vs. 75+
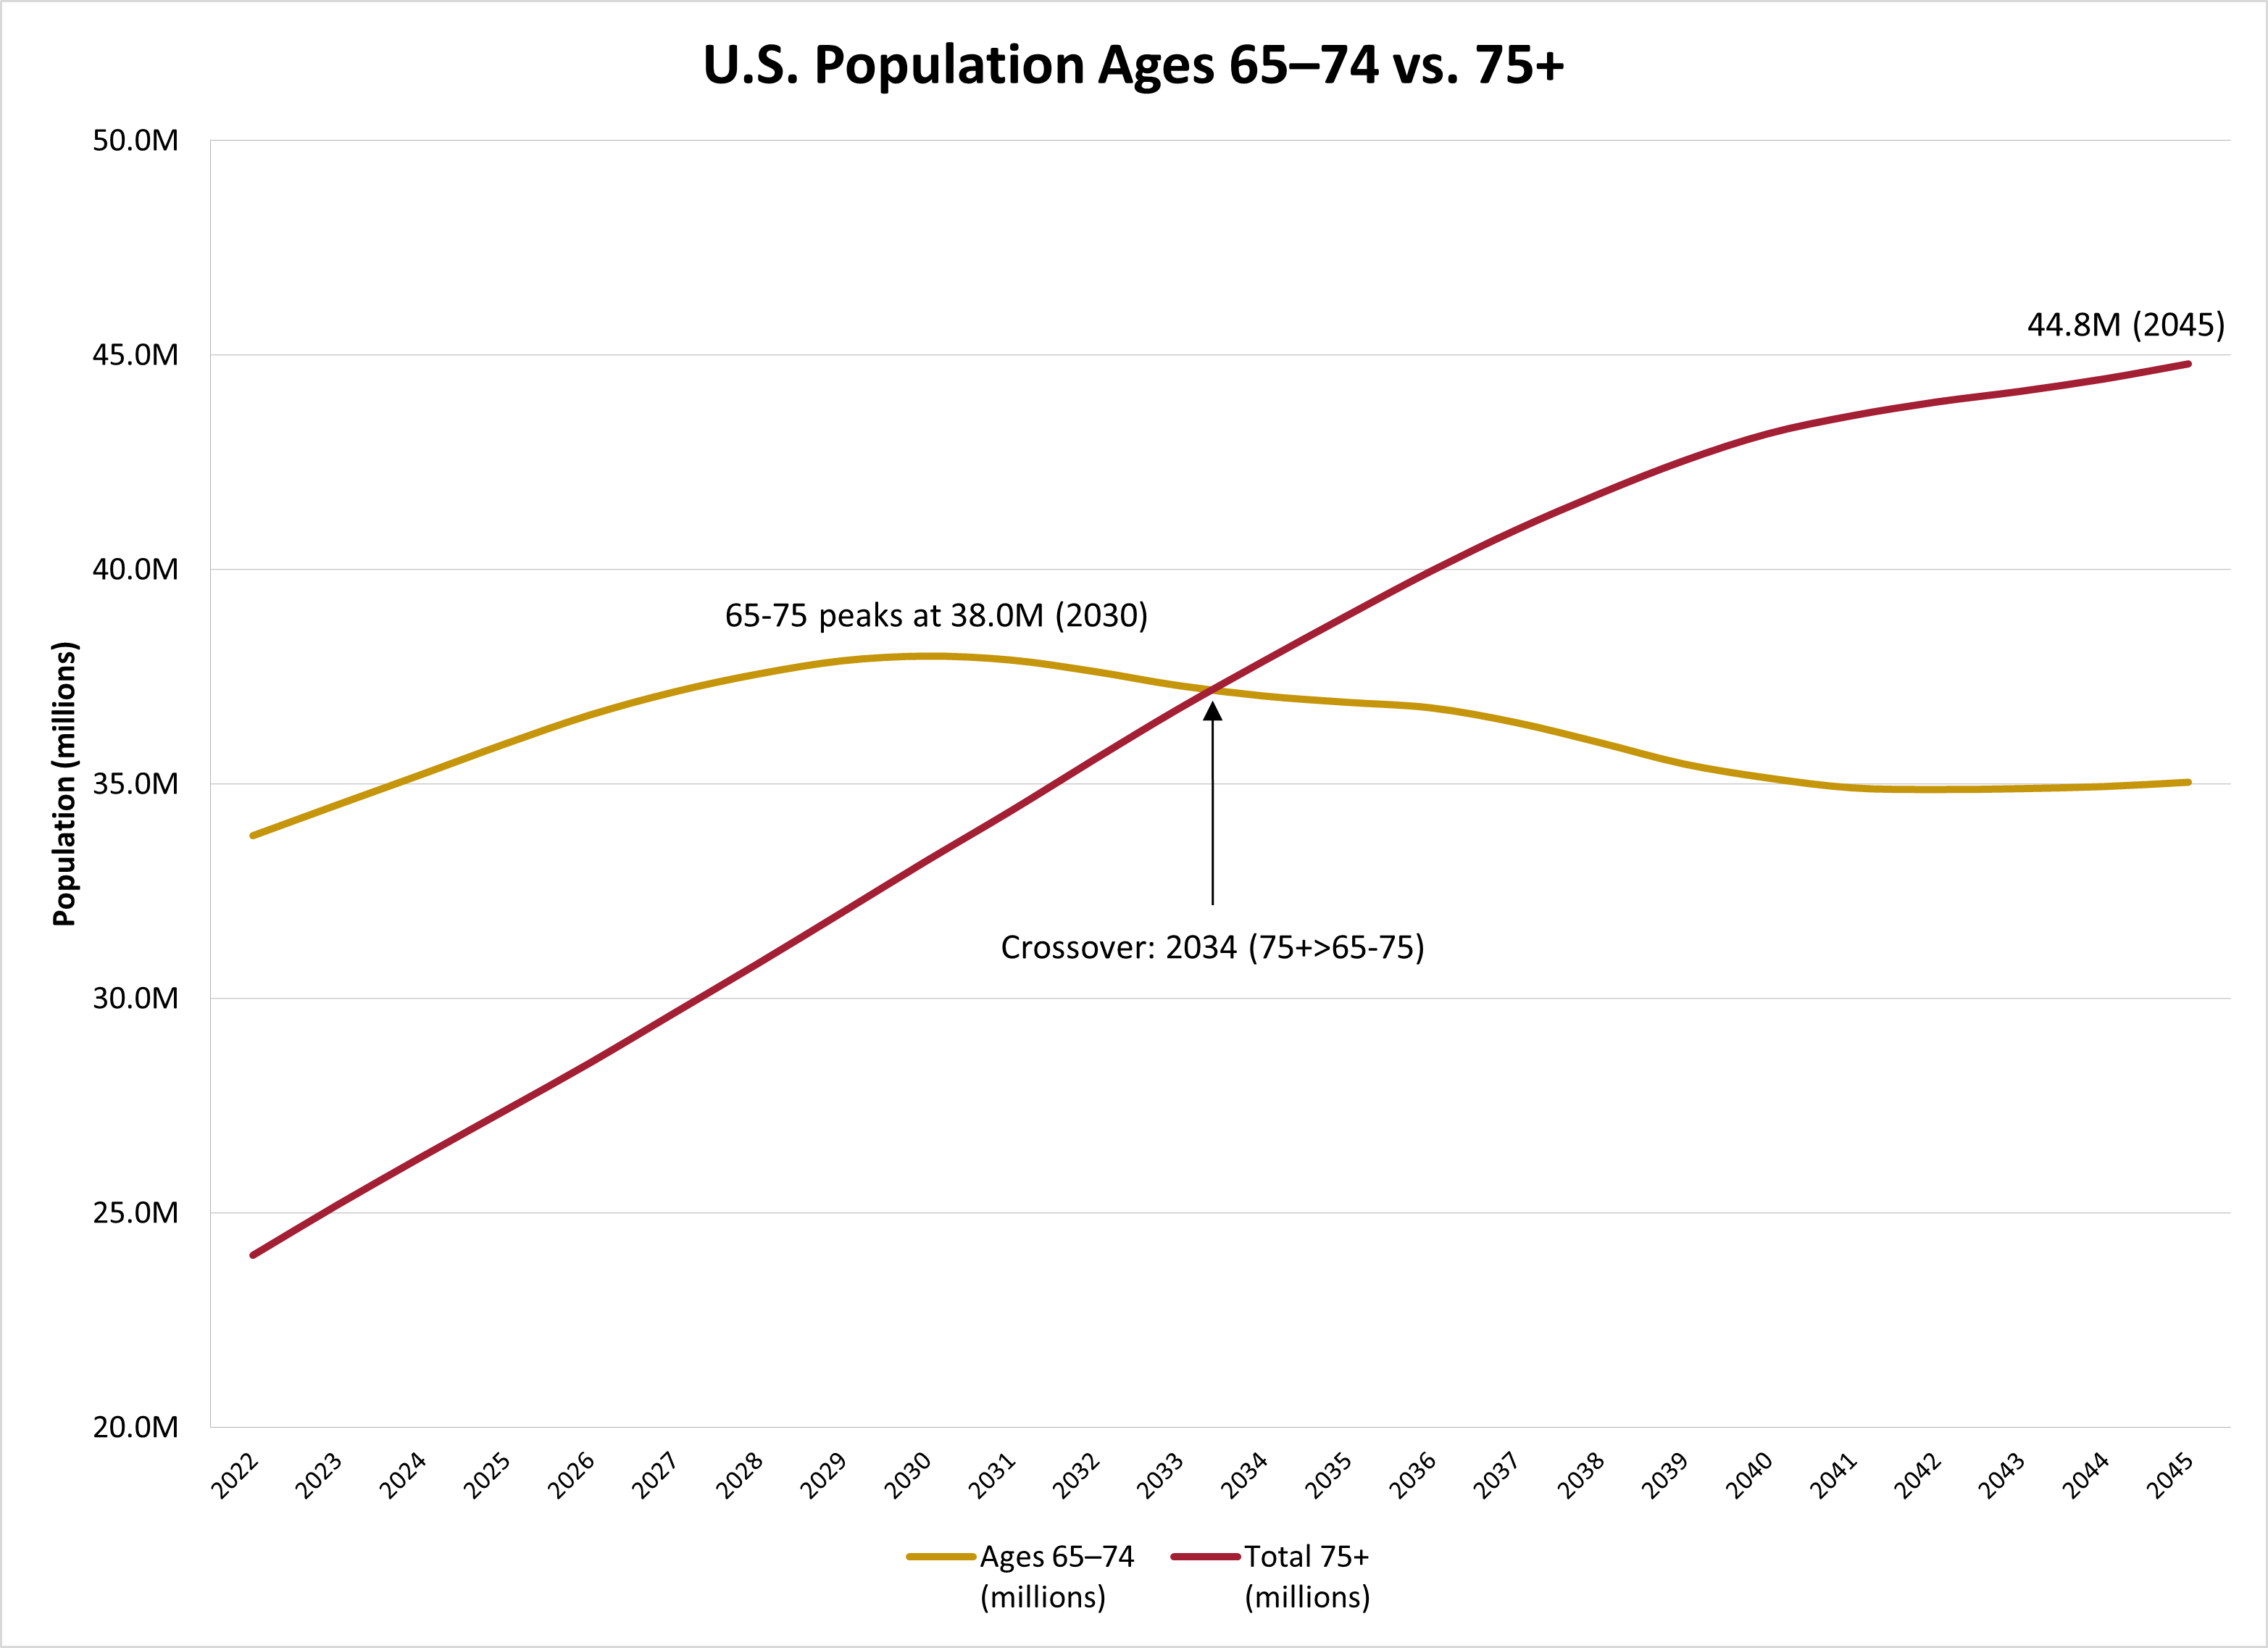
U.S. Population Ages 65–74 vs. 75+
Source: U.S. Census Bureau, 2023 National Population Projections (NP2023-D1, middle series)
The 65–74 age group peaks at 38.0 million in 2030 and then gradually declines as more Boomers age past 74. The 75+ population, meanwhile, rises steadily on a steeper trajectory. The two lines cross in 2034, when the 75+ population surpasses the 65–74 group for the first time. This crossover marks a structural shift: from that point forward, there are more Americans in the age brackets most associated with assisted living and memory care demand than in the “active adult” segment. The 65–74 group stabilizes near 35 million through the mid-2040s as Generation X enters the bracket.
Ages 75–84 vs. 85+: Care-Level Demand
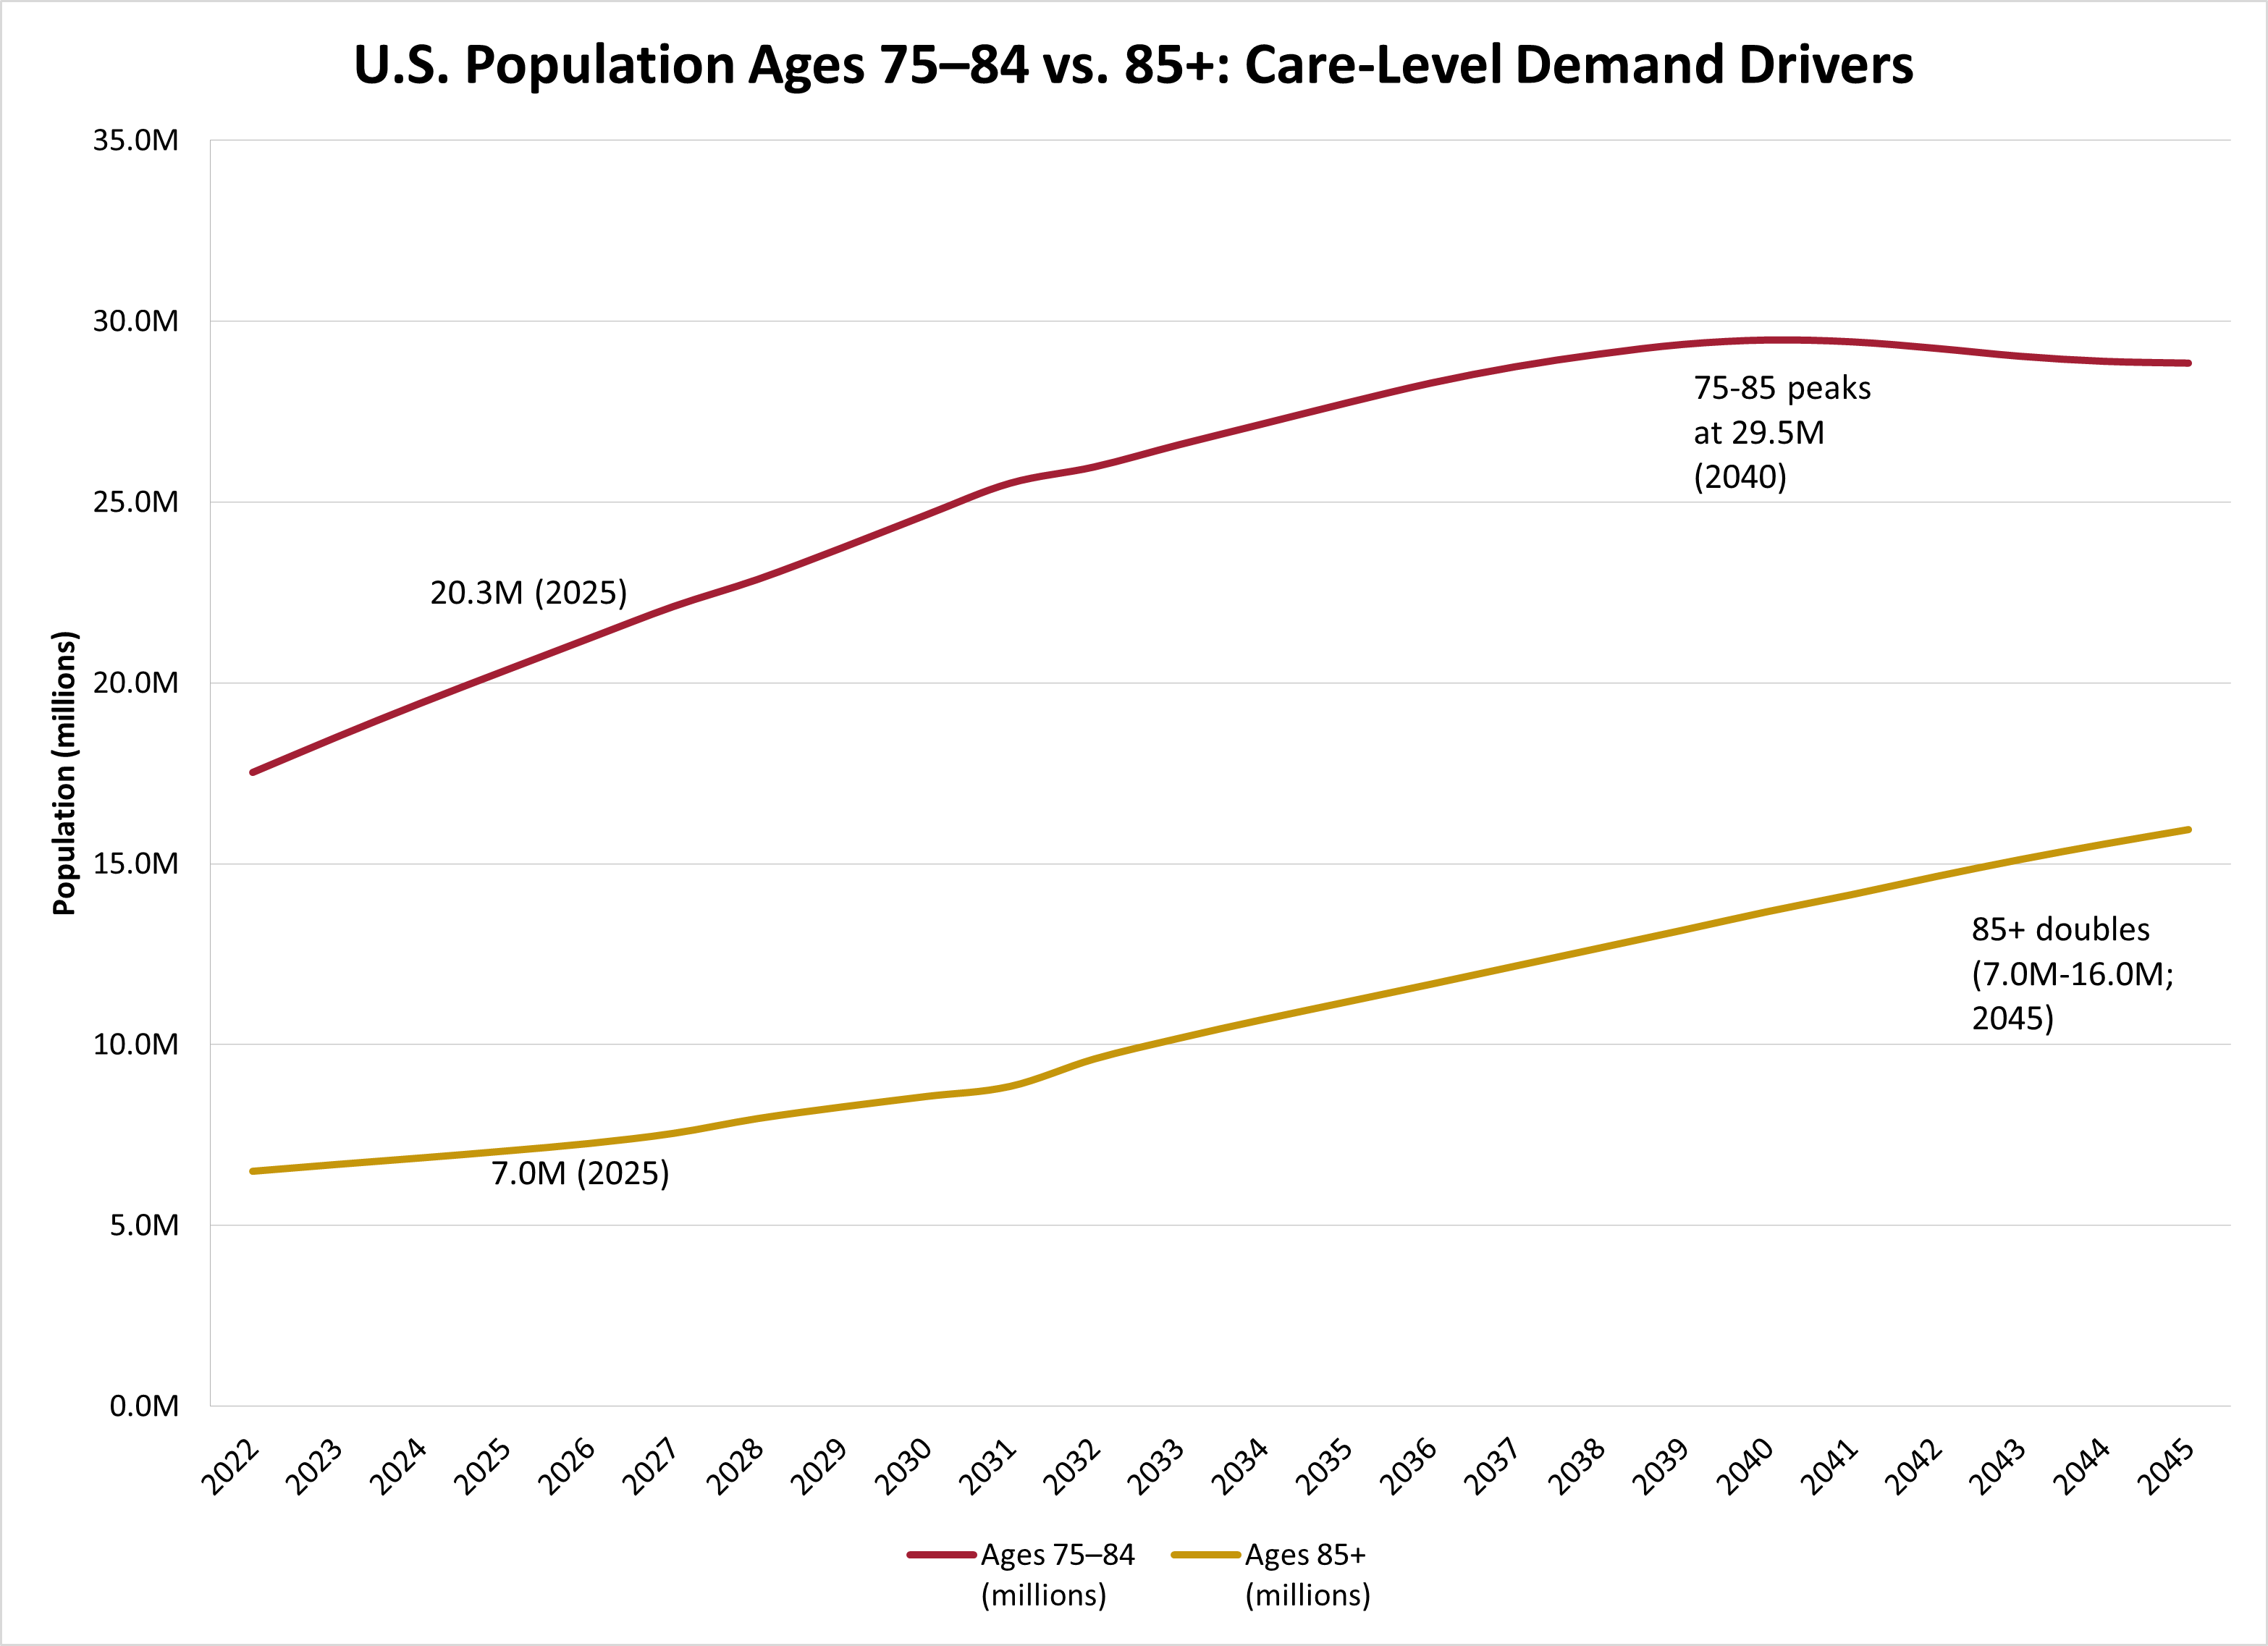
U.S. Population Ages 75–84 vs. 85+: Care-Level Demand Drivers
Source: U.S. Census Bureau, 2023 National Population Projections (NP2023-D1, middle series)
Within the 75+ population, the care-level mix shifts significantly over the projection period. The 75–84 age group — the primary market for assisted living — grows from 20.3 million in 2025 to a peak of 29.5 million in 2040 before declining slightly. The 85+ population — which drives demand for memory care and skilled nursing — more than doubles from 7.0 million in 2025 to 16.0 million by 2045, a 126% increase. This means the highest-acuity, most capital-intensive segment of senior housing demand grows the fastest and shows no sign of peaking within the projection window.
Documents & Data
demographics-senior-living-demand.xlsx — Complete year-by-year projections 2022–2045, Boomer cohort detail, senior housing market overview, and methodology
🔗 Census Bureau 2023 National Population Projections — Source dataset (NP2023-D1 and NP2023-T3)
Key Observations
Context & Discussion
Generations — Gen Z, Millennials, Baby Boomers
The Delayed Family Formation page examines the younger end of the demographic spectrum, illustrating how the prime rental-age cohort (20–39) peaks around 2030 and then declines — a story of demand softening. The senior end of the demographic spectrum shows sustained, accelerating growth with no meaningful peak within the next two decades. For commercial real estate investors, these are two sides are related to the baby boomer generation that drove suburban homebuilding and family formation in the 1980s and 1990s is now driving senior housing demand in the 2030s and 2040s.
Levels of Care
The practical implications differ by care level. Independent living and active adult communities primarily serve the 65–74 bracket, which peaks in 2030 and then slowly contracts. Assisted living facilities primarily serve ages 75–84, a market that expands through 2040. Memory care and skilled nursing facilities serve the 85+ population, which grows consistently through the entire projection period. This sequential pattern suggests different risk profiles: independent living faces a demand plateau sooner, while higher-acuity facilities face growing demand but also growing operational challenges — particularly labor shortages and regulatory complexity.
Post-Covid Growth
The senior housing industry’s post-COVID recovery provides important context. Occupancy rates fell from pre-pandemic levels near 88% to roughly 78% in early 2021, and have since recovered to approximately 87% as of mid-2025 (NIC MAP Data Service). However, this recovery occurred during a period of relatively modest 75+ population growth. The demographic acceleration visible in the charts — adding nearly 1 million people per year to the 75+ population from the late 2020s onward — will test the industry’s ability to add capacity at a pace it has never historically achieved.
Labor Constraints
Labor may prove to be the binding factor. Senior living facilities are among the most labor-intensive property types in commercial real estate, requiring trained caregivers at ratios that cannot easily be reduced through technology (at least not yet). Caregiver wages have risen sharply since 2020, and staffing shortages have become a primary constraint on new facility openings. Technology — including remote monitoring, AI-assisted diagnostics, and robotic assistance — may eventually ease some of these constraints, but is unlikely to fundamentally change the labor intensity of hands-on care for the 85+ population within the projection window.
Geographic Differences
Boomer retirees have concentrated disproportionately in Sun Belt states — Florida, Arizona, Texas, and the Carolinas — amplifying the national demographic wave in specific markets. This geographic concentration creates localized supply-demand pressures that can be significantly more acute than national averages suggest, and represents both an opportunity and a risk for CRE investors evaluating senior living exposure.
Methodology & Data Notes
Population Projection Source
U.S. Census Bureau, 2023 National Population Projections. Dataset NP2023-D1 (middle series): Projected Population by Single Year of Age, Sex, Race, and Hispanic Origin for the United States, 2022 to 2100. Released November 2023. This is the first projection series to incorporate results of the 2020 Census. URL: census.gov/data/datasets/2023/demo/popproj
Mortality in Projections
The Census Bureau projections already incorporate age-specific mortality assumptions internally using the cohort-component method. When Census projects 27.4 million people aged 75+ in 2025, that figure reflects the fact that many people born in the 1940s and 1950s have already died before reaching 75, and forward projections apply mortality improvement rates at each interval. Unlike the rental age projection on the Delayed Family Formation page — where CRE42 built up from raw CDC birth cohorts and subtracted cumulative mortality using life tables — this page uses Census Bureau finished output with mortality already incorporated.
Data Resolution
This page uses year-by-year data directly from Census Bureau Dataset NP2023-D1, which provides population projections by single year of age. Age groups (65–74, 75–84, 85+) are computed by summing the relevant single-year-of-age populations. No interpolation is required — every year from 2022 to 2045 is directly from the Census dataset.
Boomer Birth Cohort Data
Annual births by year from CDC National Center for Health Statistics, National Vital Statistics System. Birth counts represent live births in the United States; not adjusted for subsequent immigration, emigration, or mortality. Total Boomer births (1946–1964): approximately 75.8 million. Approximately ~70 million are still living as of 2025.
Immigration Sensitivity
Census middle series assumes ~1.1 million net immigration annually. Immigration has minimal impact on the 75+ cohort through 2045 because immigrants arriving today will not reach age 75 for decades. The 2025–2045 senior population trajectory is almost entirely determined by births that occurred 60–80+ years ago. Immigration sensitivity is far more relevant for the rental-age (20–39) cohort analyzed in the Delayed Family Formation page.
Senior Housing Market Data
Inventory, occupancy, and penetration rates from NIC MAP Data Service (National Investment Center for Seniors Housing & Care). Cost data from Genworth Financial Cost of Care Survey (2024). These are industry-standard sources; NIC data requires subscription access. Figures should be treated as approximate industry benchmarks.
Uncertainty Note
Population projections are inherently uncertain. Census Bureau provides high, middle, and low series (varying immigration assumptions); this page uses middle series throughout. For the 75+ cohort through 2045, virtually all individuals are already born, making the projection unusually robust — the primary uncertainty is mortality rates, not births or immigration.
Sources
1. U.S. Census Bureau. 2023 National Population Projections, Dataset NP2023-D1 (middle series): Projected Population by Single Year of Age, 2022–2100. Released November 2023. census.gov
2. U.S. Census Bureau. 2023 National Population Projections, Summary Table NP2023-T3: 5-year age groups at 5-year intervals. census.gov
3. CDC National Center for Health Statistics. National Vital Statistics System — historical birth data by year, 1946–1964. cdc.gov/nchs
4. NIC MAP Data Service (National Investment Center for Seniors Housing & Care). Senior housing inventory, occupancy, and construction data. nic.org (subscription required)
5. Genworth Financial. Cost of Care Survey (2024). Average costs for independent living, assisted living, memory care, and skilled nursing. genworth.com
6. Population Reference Bureau (PRB). Fact Sheet: Aging in the United States (2024). Summary of Census projections for 65+ population. prb.org
7. Cerulli Associates. U.S. High-Net-Worth and Ultra-High-Net-Worth Markets (2022). Intergenerational wealth transfer projections. Home equity component derived from Federal Reserve Z.1 Financial Accounts, Census homeownership rates by age, and Survey of Consumer Finances.
8. American Seniors Housing Association (ASHA). Senior housing penetration rate estimates. seniorshousing.org