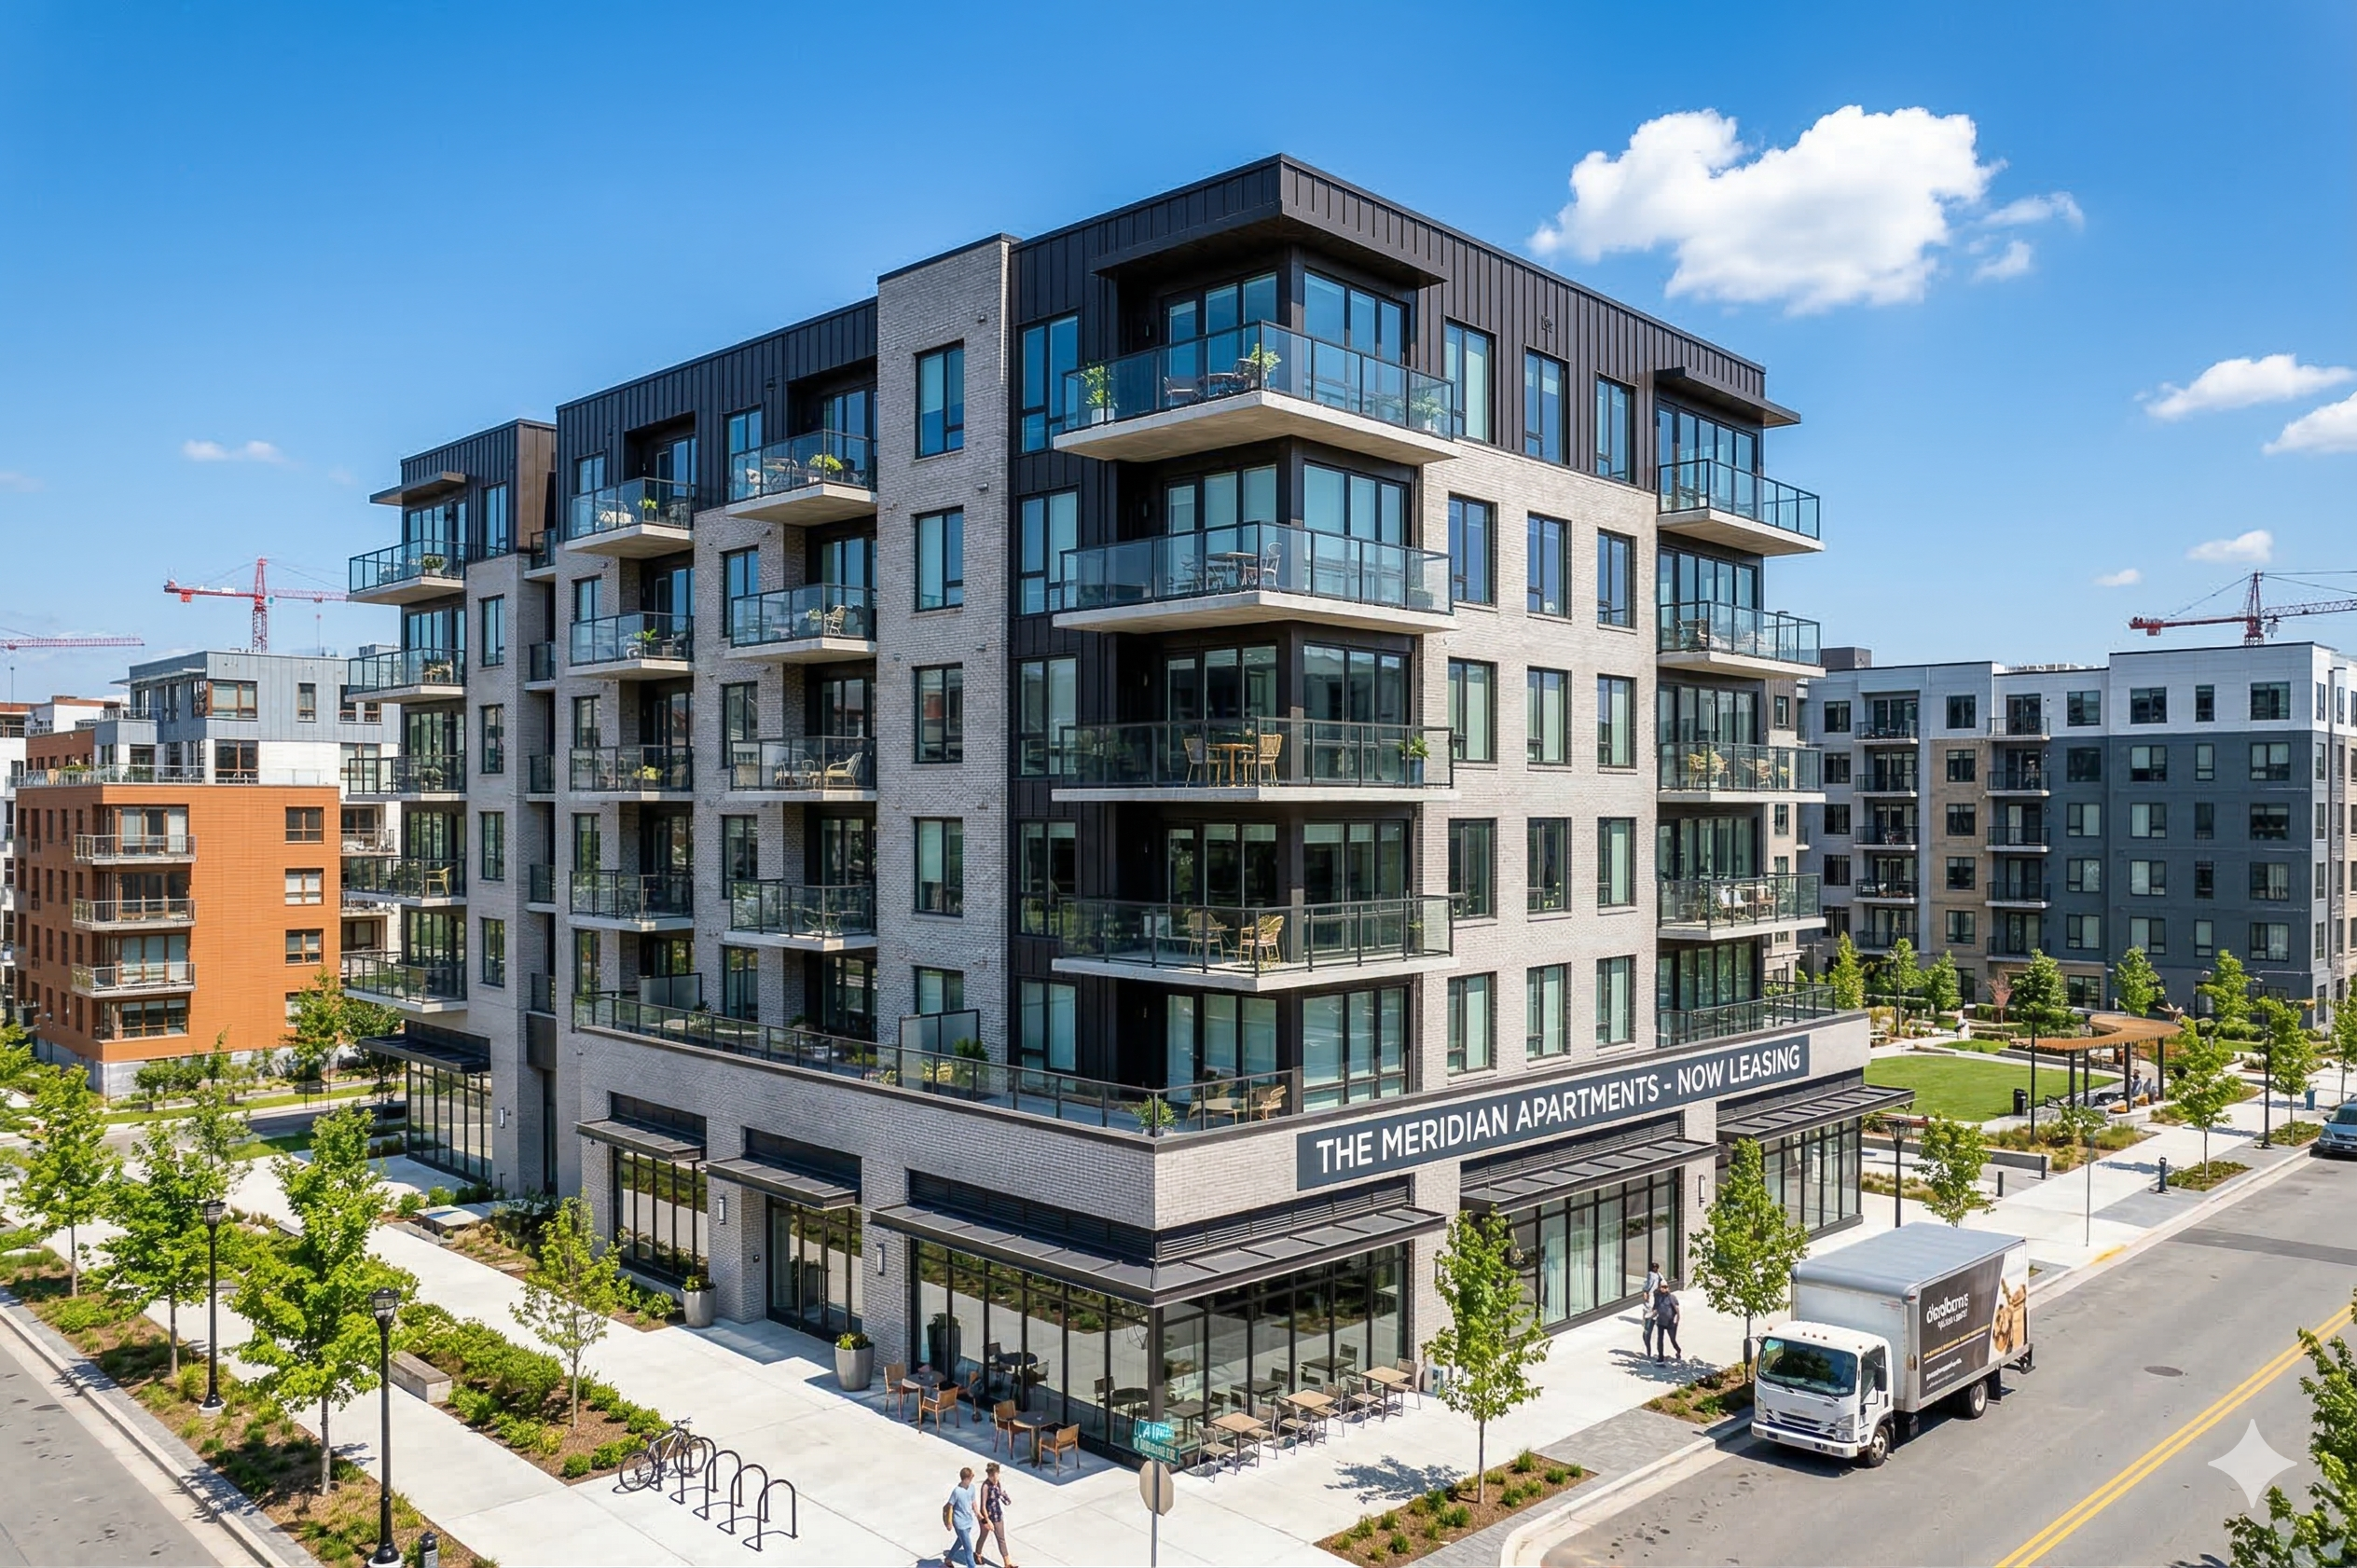
Multifamily & Senior Living

US housing prices have increased much more rapidly than inflation or wages since 2020, exacerbating an already affordability-challenged market for first time buyers. Rents have also increased nationally as the Millennial and Gen Z generations have graduated into adulthood in their prime rental and home buying years, although the recent apartment supply boom has alleviated some pricing pressures, especially in the high growth markets of the south.

It is not controversial to state that housing production has not kept pace with family formation or population growth since the Great Financial Crisis of the late 2000’s, but estimates vary widely with respect to size and scale of the actual deficit. Excess housing and apartment construction in the wake of the pandemic has led to oversupply in many southern growth cities, while mature coastal markets continue to grapple with chronic NIMBYism and supply constraints.

This section explores the U.S. housing shortage from a national and regional point of view, providing historical and numerical context around the unique moment in US housing history in which we currently reside.

Modern multifamily apartment building Aerial view of housing subdivision
U.S. Home Affordability Crisis
Median home prices rose 55% (2019–2024) while incomes lagged; mortgage lock-in effect, record price-to-income ratios, and declining affordability structurally support rental demand
National CRE Supply Trends vs. Population and GDP
GDP, population, and commercial real estate supply growth indexed from 2006; divergence patterns across property types
U.S. MF Supply Cycle: Boom, Bust, and the Construction Cliff
Record 692,000 MF units delivered in 2024; starts collapsed 51% from 2022 peak; vacancy rose to 8.6%; rent growth near zero — the construction cliff and what it means for 2027–2028
U.S. MF Regional Divergence: South vs. Supply-Constrained Markets
South delivered 49% of MF units among 75 major markets; vacancy gap of 660 bps between Northeast (4.7%) and South (11.3%); 20 of 30 Southern markets have negative rent growth
Quantifying the U.S. Structural Housing Shortage
Nine major institutional estimates range from 1.2M to 8.0M units; methodology drives the range but directional conclusion is consistent — the U.S. is structurally undersupplied
Delayed Family Formation Impact on Housing Demand
Prime renter-age population (20–39) peaks ~2028 then declines; $84–105T wealth transfer bifurcating the housing market; 30-somethings outnumber 20-somethings by ~2033 without net immigration — multifamily demand implications through the 2030s
U.S. Senior Population Growth and Senior Living Demand
75+ population grows from 27.4M to 44.8M by 2045 (+64%); peak Boomer cohorts turn 75 in 2032–2036; 85+ doubles to 16M; care-level demand drivers and supply-demand gap implications
Senior Living Asset Types: A CRE Explainer
Independent living, assisted living, memory care, and skilled nursing compared: operating models, cost structures, occupancy trends, and investment characteristics
Affordable Senior Housing Programs
HUD Section 202 and Medicaid HCBS: the federally subsidized programs that provide affordable independent living and in-home care for low-income seniors, with a Massachusetts focus

Key Data Sources & Research

U.S. Census Bureau
www.census.gov - American Housing Survey, housing starts, population estimates
Federal Reserve (FRED)
fred.stlouisfed.org - Housing units, home prices, mortgage rates
Zillow Research
www.zillow.com - Housing deficit estimates, rent data, market trends
CoStar
www.costar.com - Multifamily deliveries, rents, vacancy, construction starts
National Association of Realtors
www.nar.realtor - Homebuyer profiles, affordability data
Freddie Mac Housing Research
www.freddiemac.com - Housing shortage estimates, market outlook