Overview
“Senior living” encompasses at least six distinct property types ranging from age-restricted apartment communities with no care component to licensed skilled nursing facilities operating under federal oversight. Senior living categories have different target demographics, revenue models, operating cost structures, regulatory exposure, and risk-return profiles.
The U.S. senior housing inventory totals approximately 3.2 million units across all segments (NIC MAP Data Service, 2025). This section combines with the Senior Living Demographics page to create a format for understanding the baseline supply/demand economics for various senior living formats both now and over the coming years and decades.
Occupancy Recovery by Segment
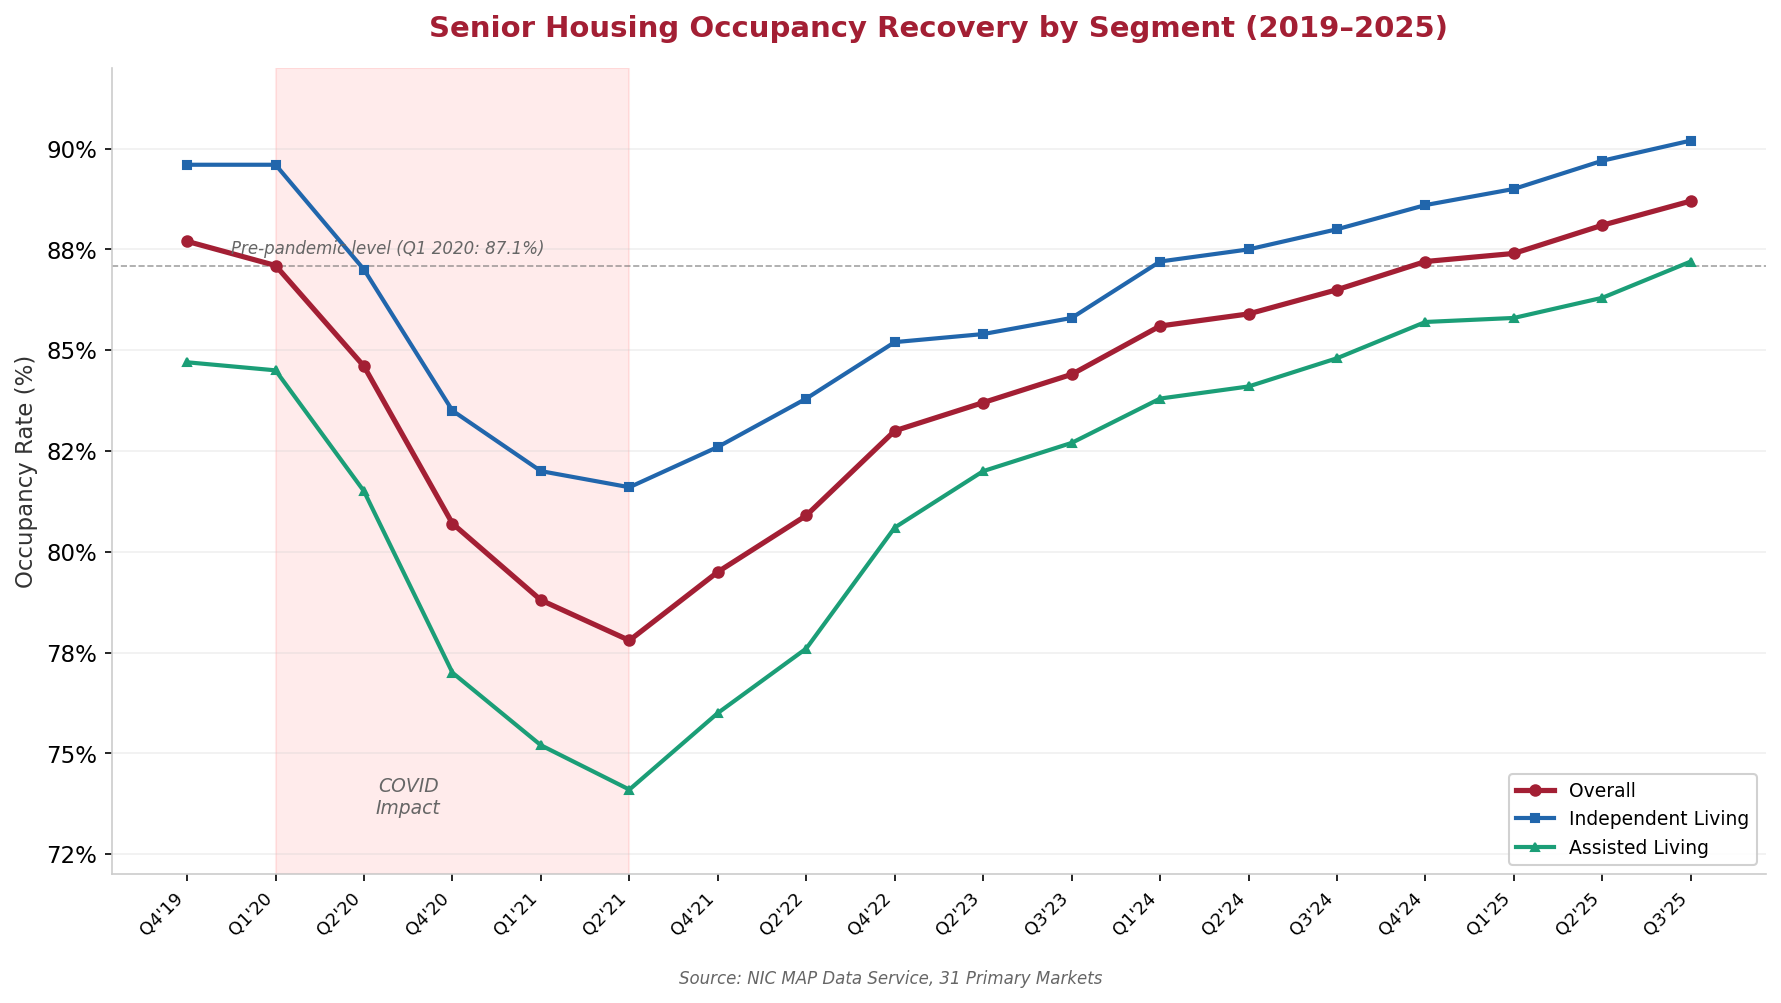
Senior Housing Occupancy Recovery by Segment, Q4 2019 – Q3 2025 | Source: NIC MAP Data Service, 31 Primary Markets | Chart: CRE42
Senior housing occupancy increased for 17 consecutive quarters through Q3 2025, recovering from a pandemic low of 77.8% (Q2 2021) to 88.7%. Independent living reached 90.2% — the first time above 90% since 2019. Assisted living reached 87.2%, having recovered faster than independent living from deeper pandemic losses, likely reflecting the more needs-driven nature of its demand. NIC projects the overall senior housing occupancy rate will surpass 90% by the end of 2026 (NIC MAP Data Service, Q3 2025).[1]
The Care Continuum
Senior living property types are organized along a continuum from lowest to highest care intensity. Each step up the continuum adds operational complexity, staffing requirements, regulatory burden, and cost — but also serves an older, more needs-driven resident base with fewer housing alternatives.
Active Adult
Age-restricted rental communities (typically 55+ or 62+) with resort-style amenities and no care services. Active adult was formally defined as a distinct sector by the National Investment Center for Seniors Housing & Care (NIC) in 2022. These properties compete more directly with conventional multifamily than with traditional senior housing. The typical resident is in their upper 60s or low 70s, has annual income of approximately $50,000 with at least $150,000 in non-housing assets, and is seeking socialization rather than care (NIC Active Adult Report, 2022). Communities typically employ 6–9 full-time staff — far fewer than any other senior living type. Average length of stay is 6–9 years with approximately 80% retention at stabilization, and resident turnover runs around 20%, compared with 50% for conventional multifamily. Active adult occupancy stood at 92.1% in Q3 2025 (NIC MAP). Cap rates are the lowest in the senior housing sector, averaging approximately 4.6% for Class A properties.
Independent Living (IL)
Congregate communities offering dining, housekeeping, transportation, and social programming, but no personal care assistance. Independent living represents the largest segment of traditional senior housing. Residents maintain their own daily routines but benefit from communal services that reduce the burden of home maintenance and social isolation. The primary market is adults ages 75–84. Average monthly cost ranges from $2,500 to $3,500 depending on geography and amenity level (Genworth/CareScout). Average length of stay is approximately 36 months. Occupancy reached 90.2% in Q3 2025 — the first time independent living surpassed 90% since 2019 (NIC MAP Data Service). Staff-to-resident ratios are approximately 0.15–0.25:1.
Assisted Living (AL)
Licensed facilities providing 24-hour protective oversight and assistance with activities of daily living (ADLs): bathing, dressing, eating, medication management. Assisted living is the sector’s largest growth segment by both inventory and absorption. The primary market is adults ages 80–89. The national median annual cost rose to $74,400 in 2025 ($6,200/month), a 5% year-over-year increase following a 10% increase in 2024 (CareScout Cost of Care Survey, 2025). Average length of stay is approximately 22 months. Occupancy reached 87.2% in Q3 2025, with assisted living recovering faster than independent living from pandemic lows — likely reflecting the more needs-driven nature of demand (NIC MAP). Staff-to-resident ratios range from 0.35:1 to 0.50:1. Assisted living is licensed at the state level; regulatory requirements vary significantly across jurisdictions.
Memory Care
Specialized secured environments for residents with Alzheimer’s disease, dementia, or other cognitive impairments. Memory care is sometimes operated as a distinct wing within an assisted living community and sometimes as a standalone facility. The environment is physically secured to prevent elopement, and staff receive specialized training in dementia care techniques. The primary market is adults age 80 and older. Average monthly cost is approximately $9,000 — roughly 20–30% above standard assisted living rates — reflecting higher staffing ratios (approximately 0.50–0.70:1) and specialized design requirements (Genworth/NIC). Average length of stay is 18–24 months. NIC MAP does not report memory care occupancy separately from assisted living in its public releases. Demand for memory care tracks the 85+ population, which the Census Bureau projects to more than double from 7.0 million in 2025 to 16.0 million by 2045.
Skilled Nursing Facilities (SNFs)
Licensed facilities providing 24-hour nursing care, post-acute rehabilitation, and long-term custodial care under physician oversight. Skilled nursing is the most heavily regulated segment of senior housing, subject to federal oversight by the Centers for Medicare & Medicaid Services (CMS) as well as state licensing and survey requirements. The primary market is adults age 85 and older. The national median annual cost for a semi-private room reached $114,975 in 2025; a private room costs $129,575 (CareScout 2025). Staff-to-resident ratios are the highest in the sector at approximately 0.70–1.0:1. Revenue is heavily influenced by Medicaid and Medicare reimbursement rates, which creates a fundamentally different financial dynamic than the private-pay model of independent and assisted living. CMS staffing mandates add further operating cost constraints. SNFs serve a critical function in the care continuum but represent a distinct — and more operationally challenging — investment thesis from market-rate senior housing.
Life Plan Communities / CCRCs
Campuses offering the full continuum of care — independent living, assisted living, memory care, and skilled nursing — on a single site. Residents typically enter at the independent living level and transition to higher-acuity care as needs change, without relocating to a different community. Life plan communities (the industry’s preferred term, replacing “continuing care retirement community” or CCRC) generally require a substantial entrance fee ranging from approximately $100,000 to over $1 million, plus monthly service fees of $3,000–$6,000. The entrance fee model creates a different capital structure than rental senior housing: operators receive large upfront payments but assume long-term care obligations. Residents typically enter in their mid-to-late 70s with average stays exceeding 10 years. Life plan communities represent a relatively small share of total senior housing inventory but serve as the most comprehensive single-site aging solution available.
Summary Comparison
| Asset Type | Primary Age | Avg Cost | Avg Stay | Occupancy (Q3 2025) |
Operational Intensity |
Cap Rate Range |
|---|---|---|---|---|---|---|
| Active Adult | 65–75 | $1,800–$3,000/mo | 6–9 yrs | 92.1% | Low | 4.5%–5.5% |
| Independent Living | 75–84 | $2,500–$3,500/mo | ~36 mo | 90.2% | Low–Moderate | 5.0%–6.5% |
| Assisted Living | 80–89 | ~$6,200/mo | ~22 mo | 87.2% | Moderate–High | 5.5%–7.0% |
| Memory Care | 80+ | ~$9,000/mo | 18–24 mo | N/A¹ | High | 6.0%–7.5% |
| Skilled Nursing | 85+ | $9,600–$10,800/mo | Varies | N/A² | Very High | 8.0%–12.0% |
| Life Plan / CCRC | 75+ at entry | $100K–$1M+ entry + $3K–$6K/mo |
10+ yrs | ~90%+ | High | 5.5%–7.5% |
¹ NIC MAP reports memory care within the assisted living segment. ² NIC MAP tracks nursing care as a separate category from senior housing (IL + AL). Cap rate ranges are approximate market indicators from brokerage research and vary significantly by geography, vintage, and operator quality.
Sources: NIC MAP Data Service (Q3 2025 occupancy); CareScout Cost of Care Survey 2025 (costs); NIC Investment Guide (operating characteristics); ASHA (penetration rates).
Demographic Demand Drivers
Different age bands feed different asset types along the care continuum, creating sequential demand waves rather than a single uniform surge.
Target market: Active adult and early independent living
Population peaks at 38.0 million in 2030 and then slowly contracts as the youngest Boomers pass through this bracket.
Target market: Independent living and assisted living
Grows from 20.3 million in 2025 to a peak of 29.5 million in 2040.
Target market: Memory care and skilled nursing
More than doubles from 7.0 million in 2025 to 16.0 million by 2045 and shows no sign of peaking within the Census projection window (Census Bureau, 2023 National Population Projections, NP2023-D1).
Active adult and independent living face a demand plateau in the early 2030s as the 65–74 and 75–84 cohorts stabilize. Higher-acuity facilities — assisted living, memory care, and skilled nursing — face growing demand through at least 2045, but also growing operational challenges, particularly in labor markets. See the Senior Living Demographics page for more on this.
Market Snapshot
Total Occupied Units
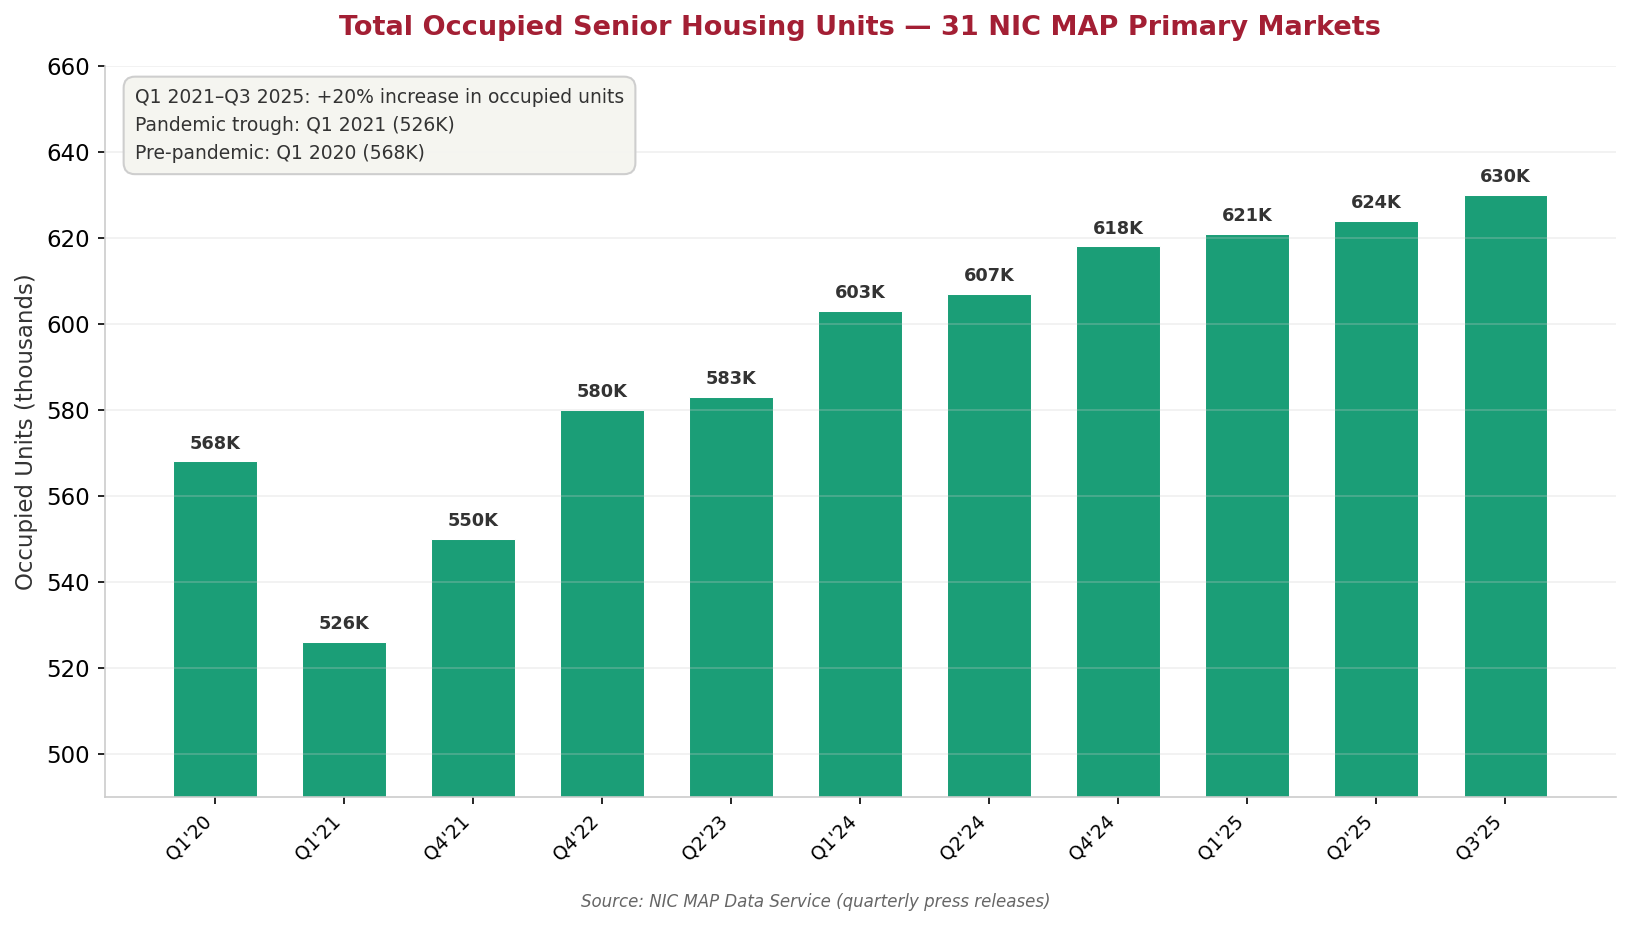
Total Occupied Senior Housing Units, 31 NIC MAP Primary Markets | Source: NIC MAP Data Service | Chart: CRE42
Total occupied senior housing units in NIC’s 31 Primary Markets reached approximately 630,000 in Q3 2025 — 62,000 units (11%) above the pre-pandemic baseline and 104,000 units (20%) above the pandemic trough. Demand has been positive for 17 consecutive quarters, with net absorption consistently outpacing new supply. The total number of occupied units has set new record highs in each of the last several quarters (NIC MAP Data Service).[2]
Demand Growth vs. Population Growth
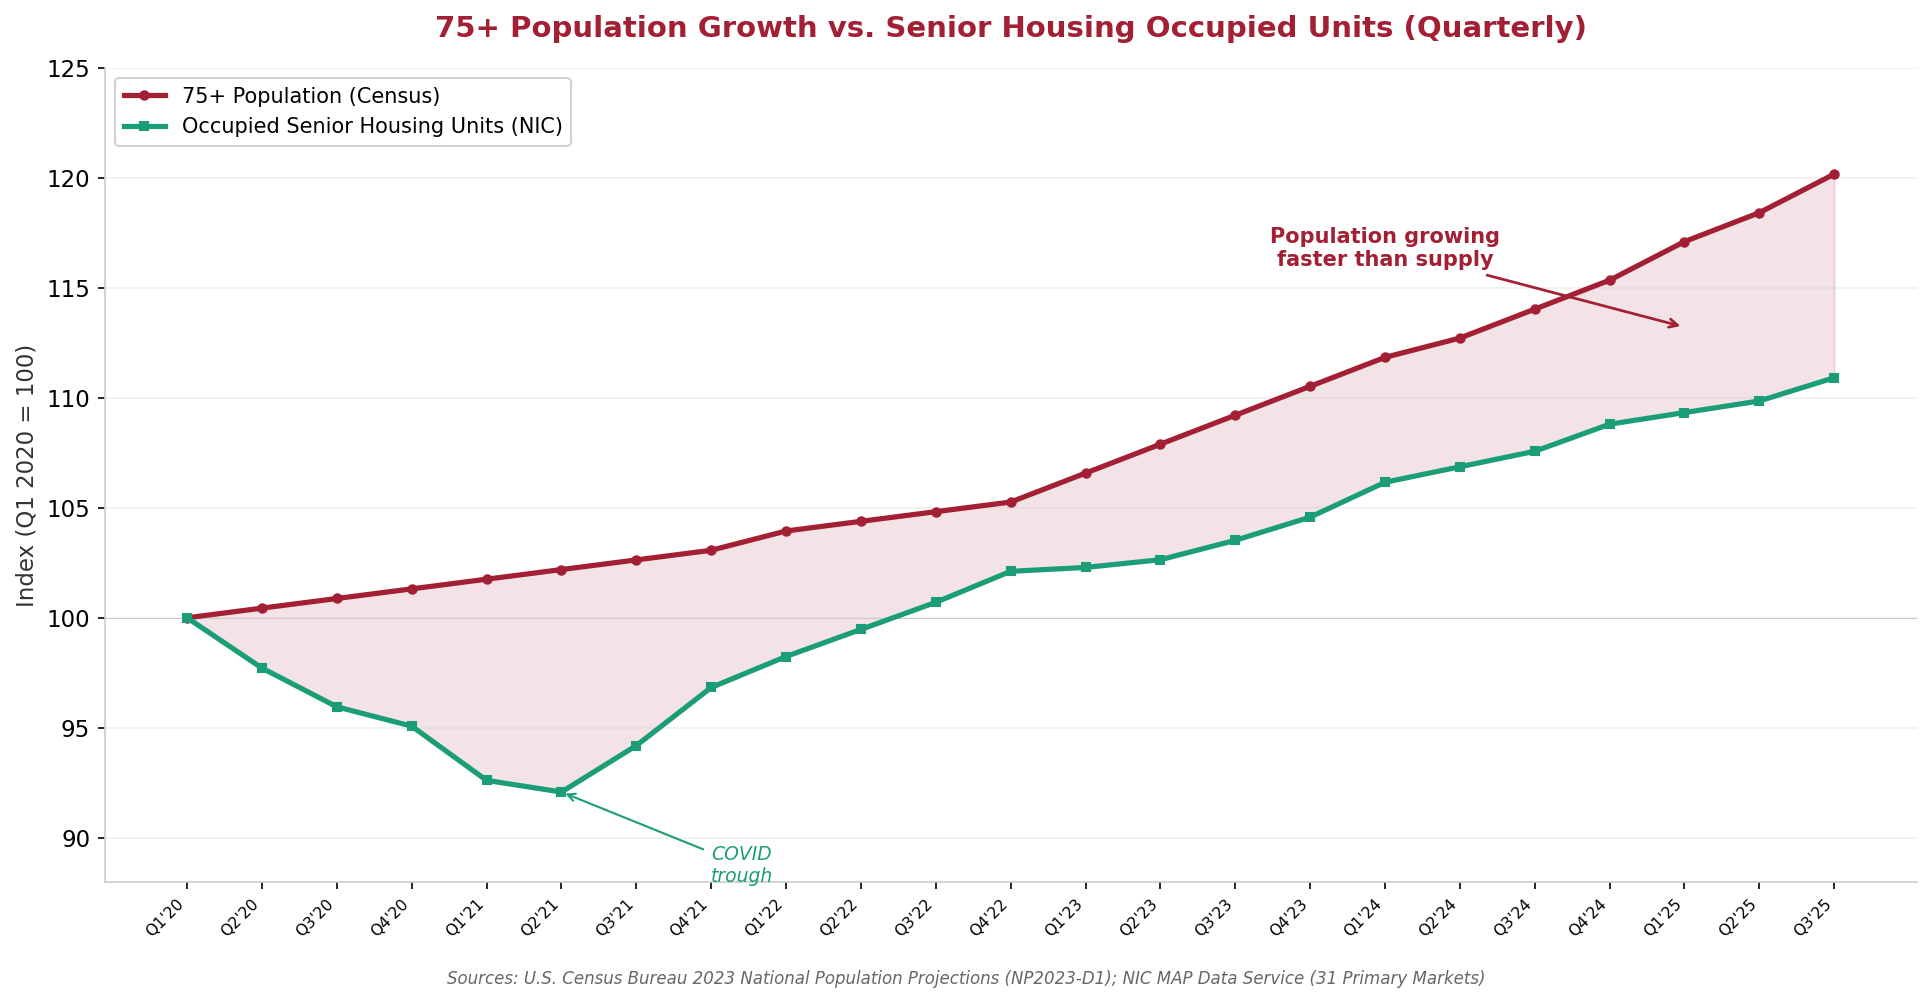
75+ Population Growth vs. Senior Housing Occupied Units (Indexed, Q1 2020 = 100) | Sources: U.S. Census Bureau NP2023-D1; NIC MAP Data Service | Chart: CRE42
The 75+ population has grown approximately 20% since 2020, while occupied senior housing units have grown approximately 11% over the same period. The widening gap between these two series illustrates the structural supply-demand imbalance alongside the under-projected age-in-place trend. Even with record absorption and 17 consecutive quarters of occupancy gains, housing supply has not kept pace with demographic growth. NIC estimates the industry would need to develop at nearly twice its historical maximum pace to maintain 90% occupancy through 2030 — and that 806,000 additional units are needed by 2030 (NIC MAP Senior Housing Market Outlook Report).[3]
Annual Cost of Care by Type
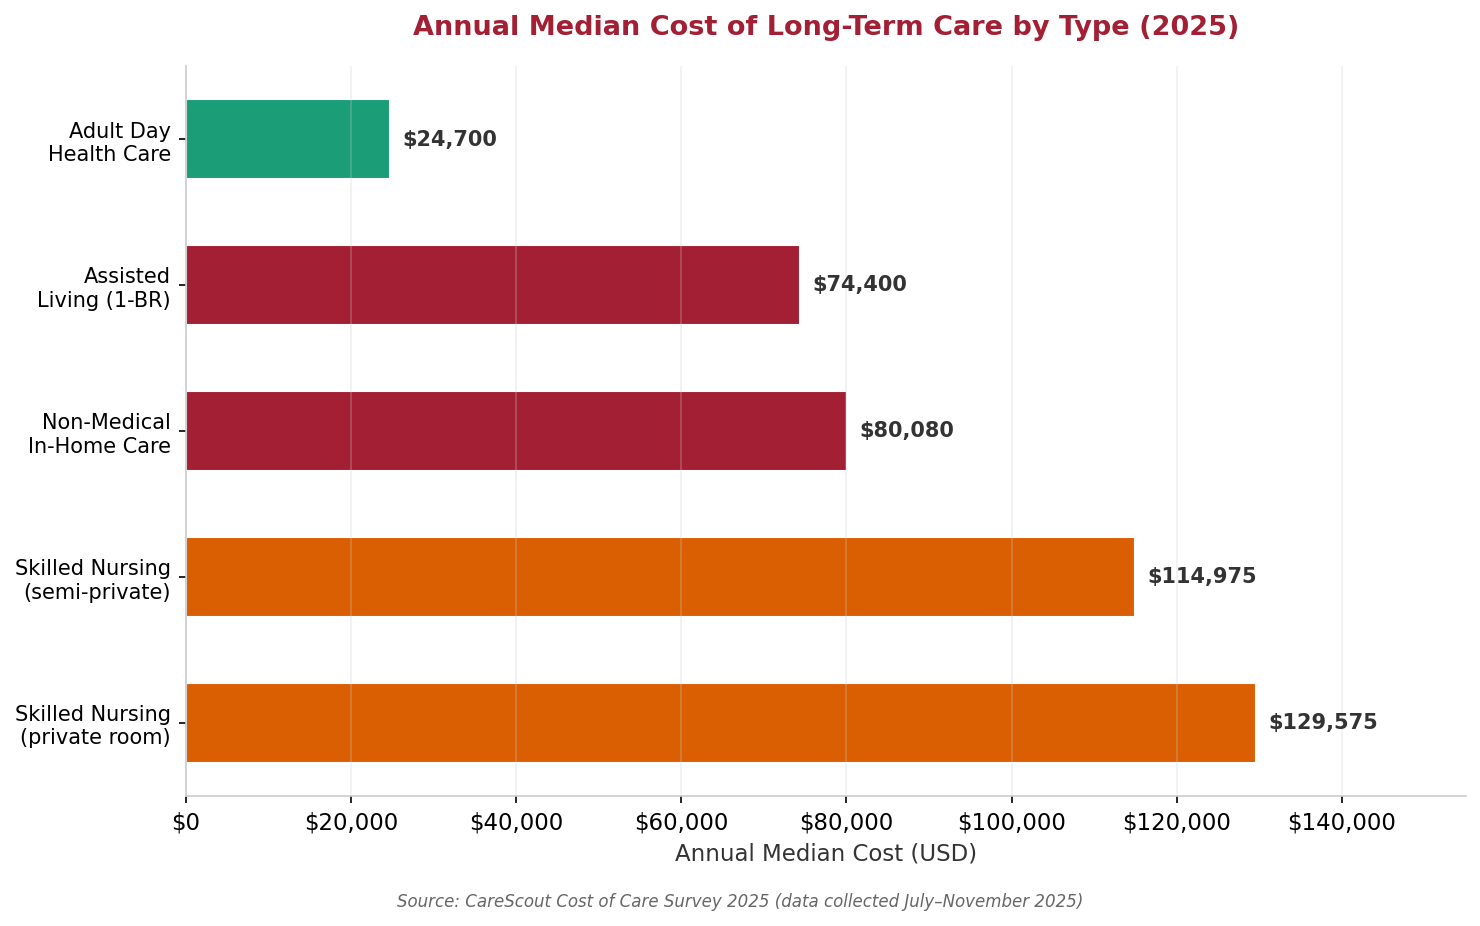
Annual Median Cost of Long-Term Care by Type (2025) | Source: CareScout Cost of Care Survey 2025 | Chart: CRE42
Annual costs range from $24,700 for adult day health care to $129,575 for a private room in a skilled nursing facility. Assisted living, the sector’s largest growth segment, carries a national median annual cost of $74,400. Cost growth slowed in 2025 relative to the sharp increases in 2023–2024, but remains above general inflation for most care types. Inflation and labor costs are the primary drivers, with labor costs the dominant factor for home-based care and inflation the dominant factor for facility-based care (CareScout Cost of Care Survey, 2025).[4]
Assisted Living Cost Trajectory
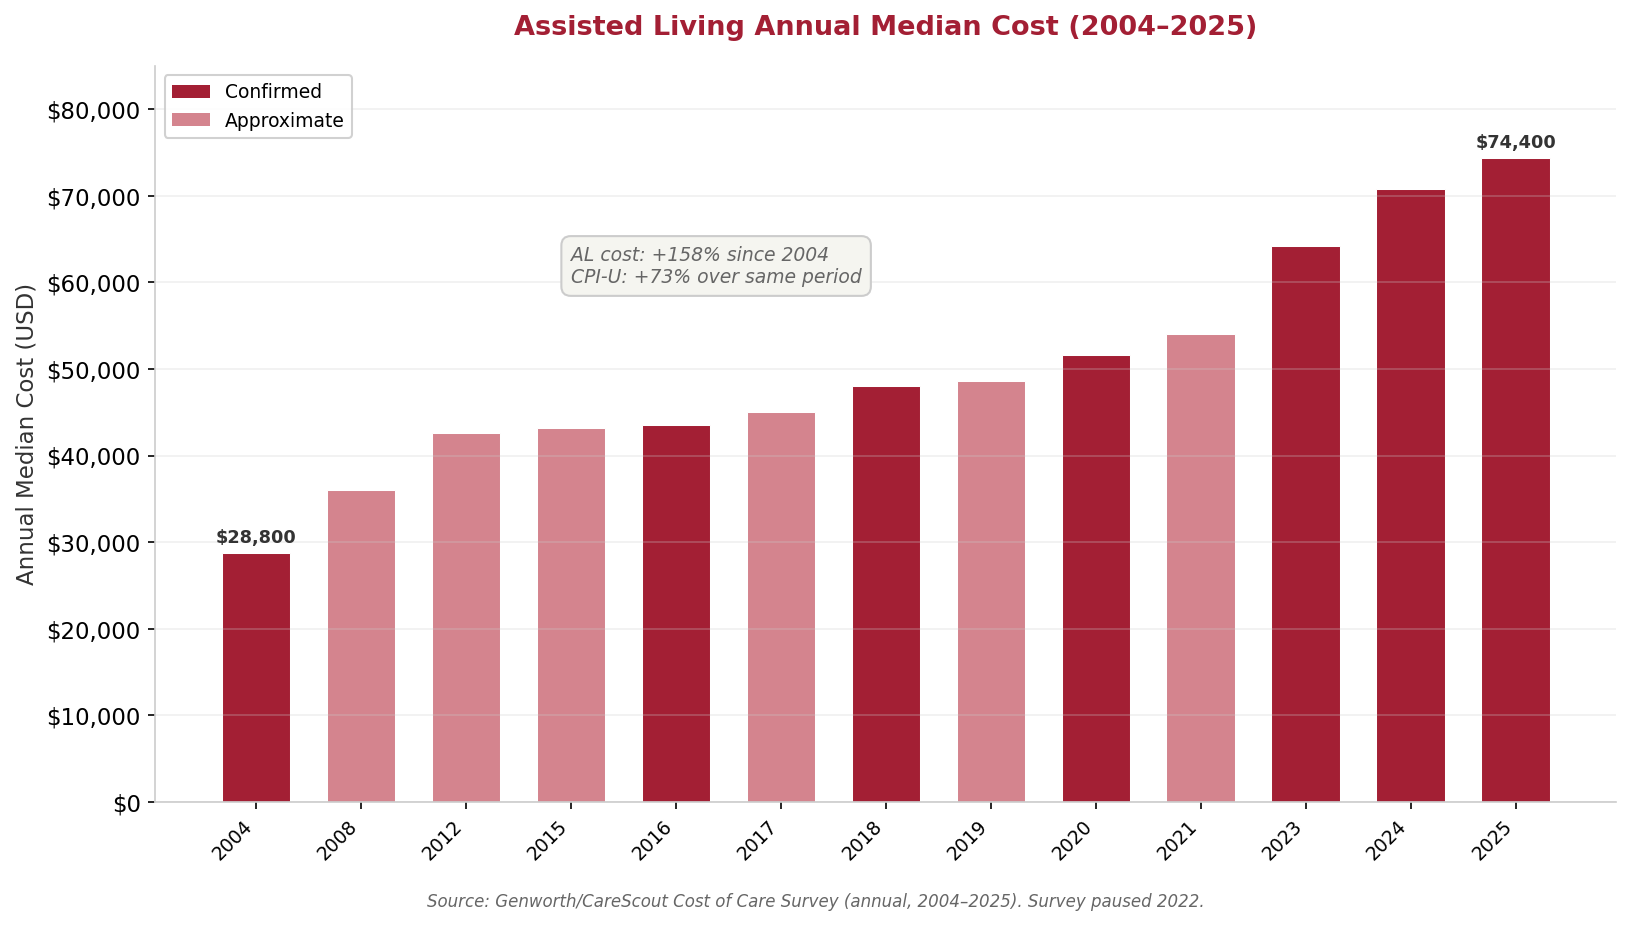
Assisted Living National Median Annual Cost, 2004–2025 | Source: Genworth/CareScout Cost of Care Survey (annual) | Chart: CRE42
The national median annual cost of assisted living has risen from $28,800 in 2004 to $74,400 in 2025 — a 158% increase over 21 years, compared to approximately 73% CPI-U growth over the same period. Cost growth was relatively steady at 3–4% annually through 2019, then accelerated sharply post-pandemic: the 2021–2024 period saw a 31% cumulative increase driven by labor shortages, wage inflation, and supply chain disruptions. The pace moderated to 5% in 2025 as cost pressures stabilized (Genworth/CareScout Cost of Care Survey, 2004–2025).[5]
Construction Costs vs. Development Pipeline
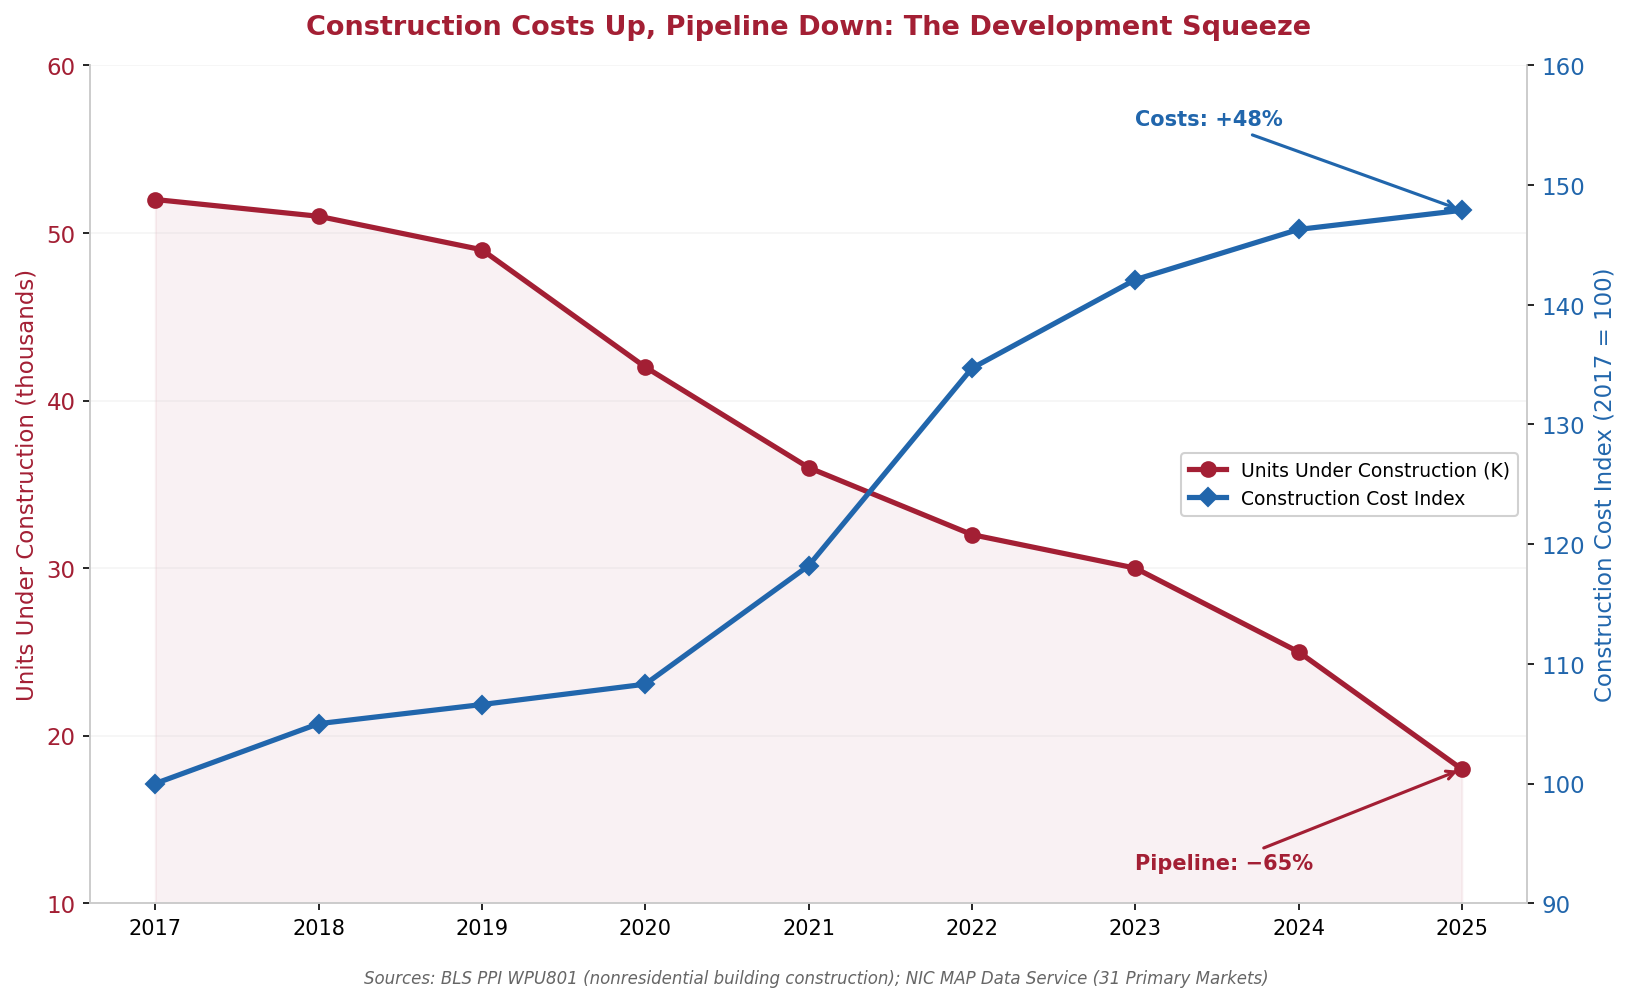
Construction Cost Index vs. Senior Housing Pipeline, 2017–2025 | Sources: BLS PPI WPU801; NIC MAP Data Service | Chart: CRE42
Nonresidential building construction costs rose approximately 48% from 2017 to 2025 (BLS PPI WPU801), while the senior housing development pipeline contracted by approximately 65% over the same period. Units under construction in NIC’s 31 Primary Markets declined from approximately 52,000 at the peak construction cycle (2017) to approximately 18,000 in mid-2025 — the lowest level since 2013. Construction starts in Q1 2025 were at their lowest since 2009, during the Global Financial Crisis. NIC MAP CEO Arick Morton has noted that new construction deals remain difficult to underwrite given the cost of capital, elevated development costs, and uncertainty about consumer willingness to pay (NIC MAP, Q4 2024).[6]
CRE Investment Considerations
The demographic demand case for senior housing is straightforward: the 75+ population is growing at a pace that current supply cannot match, occupancy is at multi-year highs, and the development pipeline is at historic lows. This combination has driven operating margins to their highest levels since 2018, with average margins for public REIT operating portfolios surpassing 25% in mid-2025 (NIC MAP). Transaction activity increased in 2025 as institutional and private investors sought exposure to the sector’s demand trajectory.
Several structural challenges temper this outlook and help explain why the supply response has been muted despite favorable demand fundamentals.
Operational Intensity
Senior housing is fundamentally an operating business, not a lease-collection business. Staff-to-resident ratios range from 0.35:1 for assisted living to 1.0:1 for skilled nursing — compared to effectively zero for conventional multifamily. Operating expenses are dominated by labor, which can account for more than half of total facility costs, making senior housing returns heavily dependent on management execution, staff retention, and the ability to control wage growth.
Labor Cost Pressure
The U.S. faces a shortage of geriatric care workers. Approximately 7,400 board-certified geriatricians were practicing in 2022, versus an estimated 30,000 needed by the end of the decade (Agency for Healthcare Administration). Caregiver wages rose sharply after 2020, and staffing shortages remain a primary constraint on both existing facility operations and new facility openings. According to the American Health Care Association, staffing challenges worsened for 60% of nursing homes between January 2022 and year-end 2024. CMS staffing mandates for skilled nursing facilities add further regulatory cost pressure. Technology — including remote monitoring, AI-assisted diagnostics, and robotic assistance — may eventually ease some of these constraints, but is unlikely to fundamentally change the labor intensity of hands-on care within the near-term projection window.
Financing and Development Economics
The construction cost and pipeline data above illustrate the core development challenge. Nonresidential building construction costs are approximately 48% above their 2017 levels, interest rates are elevated, and many lenders remain cautious toward senior housing after the sector’s pandemic-era occupancy losses. The cost of capital for senior housing is also challenged by development timelines for senior housing, which are typically longer than for conventional multifamily. The result is that even with record demand, the industry added fewer than 8,800 units of inventory across all 31 NIC MAP Primary Markets in 2024, only slightly above 2023 levels and well below the pace needed to match demographic growth (NIC MAP, Q4 2024).
Document Links
multifamily-senior-living-types.xlsx — Comparison matrix, occupancy recovery, cost of care data, AL cost trajectory, construction pipeline, demand vs. population analysis
demographics-senior-living-demand.xlsx — 75+ population projections 2022–2045, Boomer cohort detail, senior housing market overview