The gross federal debt stood at $39.5 trillion at mid-2026, after increasing 74% from $22.7 trillion at fiscal year-end 2019. $39.5T is clearly a large dollar amount, but so are the approximately $167T of US total wealth and the $7.2T in annual profits churned out by US business. Experts disagree on the probability that the U.S. can sustain its current debt trajectory without resorting to high inflation and/or financial repression. CRE42 summarizes total US wealth and business profits against the national debt below.
US Federal Debt vs. US Profit and Valuation Measures
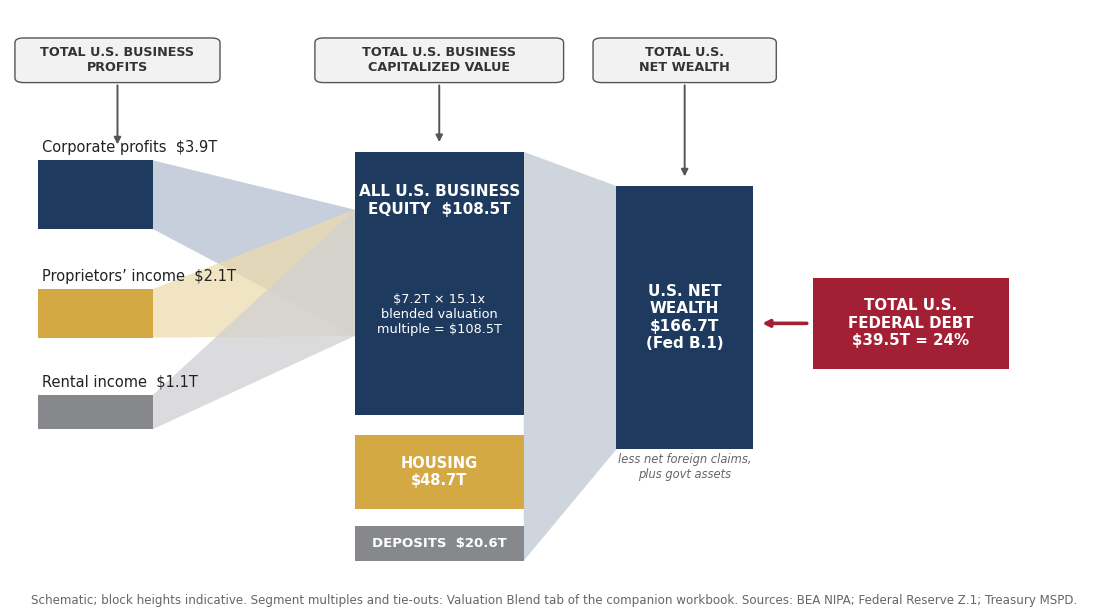
National wealth is built from income: $7.2 trillion of business income capitalized at market multiples, plus housing and financial assets. Schematic; block heights indicative. Sources: BEA NIPA; Federal Reserve Z.1; Treasury MSPD | Chart: CRE42.com
▶ US Profit and Valuation Component Details
| Segment |
Earnings ($B) |
Value ($B) |
Implied multiple |
| S&P 500 (as-reported TTM; market value 12/31/25, S&P DJI) |
1,996.3 |
58,437 |
29.3x |
| Other publicly traded (earnings est.; multiple = Russell 3000 P/E ex-neg) |
300.0 |
7,986 |
26.6x |
| Private C-corps and S-corps (value = Z.1 corporate total less public segments) |
1,620.9 |
25,434 |
15.7x |
| Noncorporate business (proprietors + rental income; value = Z.1 household equity in noncorporate business) |
3,265.7 |
16,600 |
5.1x |
| All U.S. business |
7,182.9 |
108,457 |
15.1x |
$ billions. Corporate-segment earnings (the first three rows) are after corporate tax and after interest expense, so the capitalization metric is an earnings multiple, not a cap rate. The noncorporate row is different in kind: proprietors’ income and rental income of persons are components of personal income, taxed at the owner’s individual level (so not after tax), and proprietors’ income embeds the owner’s own labor compensation — which is why its 5.1x “multiple” is not comparable to the corporate P/Es above it. The private C-corp and S-corp row is a residual (total corporate profits less the two public segments), so it absorbs the estimation error of the hatched “other public” figure as well as the GAAP-versus-NIPA definitional differences noted in the Methodology panel. Sources: BEA NIPA (corporate profits after tax without IVA and CCAdj, FRED series CP, Q1 2026 SAAR, May 28, 2026 vintage); S&P Dow Jones Indices (TTM Q3 2025, market value 12/31/25); FTSE Russell (Russell 3000 factsheet, 6/30/26); Federal Reserve Z.1 (Q1 2026). Full derivation on the Business Equity Components and Valuation Blend tabs of the companion workbook.
The Federal Debt in Context
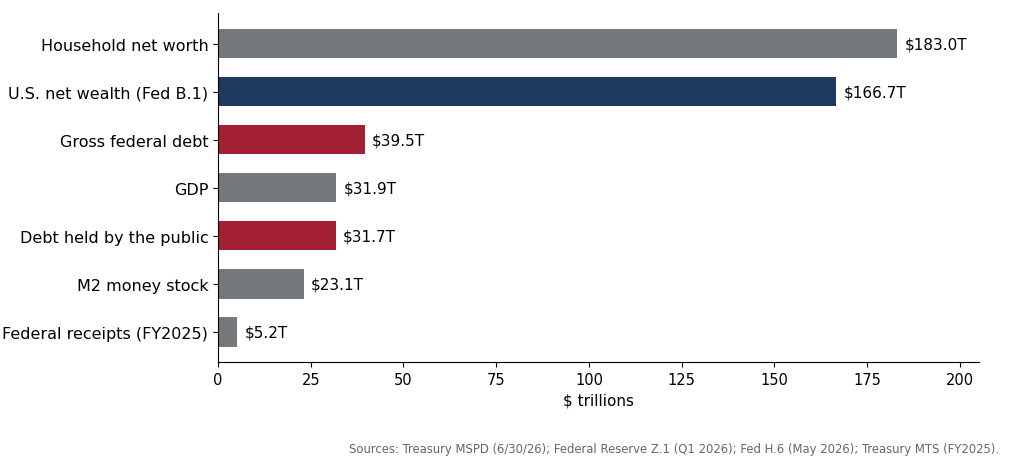
Latest available as of mid-2026; vintages vary by series. Sources: Treasury MSPD (6/30/26); Federal Reserve Z.1 (Q1 2026); Fed H.6 (May 2026); Treasury MTS (FY2025) | Chart: CRE42.com
U.S. federal debt is currently 24% of U.S. net wealth and roughly 20% of household net worth, both very reasonable and serviceable under the (questionable) assumption that the U.S. works as an integrated financial body. In reality, the U.S. Treasury can only tap into net household wealth and/or corporate wealth through taxation, which immediately reduces the values as calculated by reducing net cash flow.
Measured against cash flow metrics, the U.S. federal debt sits at 124% of GDP as of June 30, 2026, 1.7 times the M2 money stock, and 7.5 times annual federal receipts.
Debt held by the public ($31.7 trillion), the share that actually trades and bears interest, currently sits almost exactly at one year of GDP ($31.9 trillion); the gap between the 99% and 124% readings is the Treasury’s debt to its own trust funds.
U.S. Profit Breakdown
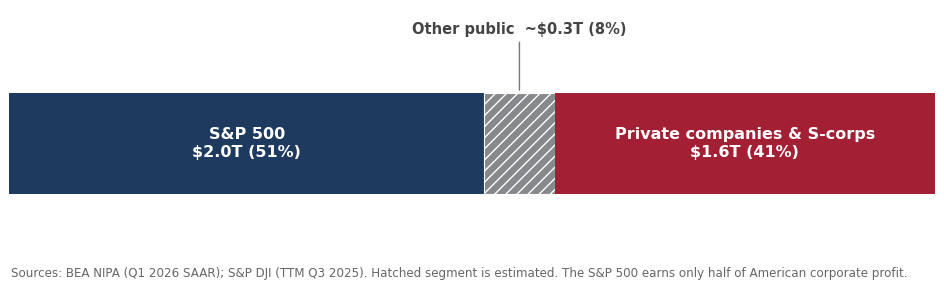
The S&P 500 earns roughly half of U.S. corporate profit; private companies and S-corps earn 41%. Hatched segment is estimated. Sources: BEA NIPA (Q1 2026 SAAR); S&P DJI (TTM Q3 2025) | Chart: CRE42.com
S&P index companies earned $2.0 trillion (51%) on a trailing twelve-month basis through Q3 2025; other listed companies earned approximately $0.3 trillion (8%), a figure that is estimated and flagged by hatching wherever it appears; and private companies and S-corporations earned $1.6 trillion (41%).
What to Watch For in 2026 and Beyond
Sources to Track the National Balance Sheet in 2026:
| Source | Report or Series | Frequency | Notes |
|---|
| Federal Reserve | Z.1 Financial Accounts, Table B.1 | Quarterly | U.S. net wealth and household net worth denominators |
| U.S. Treasury | Monthly Statement of the Public Debt (MSPD) | Monthly | Gross debt, held by the public, intragovernmental split |
| Federal Reserve | H.6 Money Stock Measures (M2) | Monthly | Full-series restatement scheduled July 28, 2026 |
| BEA | NIPA national income accounts | Quarterly | Corporate profits, proprietors’ income, rental income |
| U.S. Treasury | Monthly Treasury Statement (MTS) | Monthly; FY final in October | Federal receipts |
▶ Methodology & Data Notes
Three Measures of the Federal Debt
Gross federal debt of $39,462 billion at June 30, 2026 comprises $31,681 billion held by the public (80.3%) and $7,781 billion of intragovernmental holdings, principally Treasury securities owed to federal trust funds. Gross debt is the focal measure in this section; debt held by the public is the measure that trades in markets and on which net interest is paid, and it appears as its own bar above. The Debt Comparisons tab of the companion workbook reconciles the measures in one place.
Mixed Vintages by Design
Each bar in The Federal Debt in Context uses the latest available reading of its series rather than forcing all series to a common date: MSPD debt figures as of June 30, 2026; Z.1 wealth figures as of Q1 2026; H.6 M2 as of May 2026 (pre-restatement); MTS receipts for FY2025. Ratios quoted in the text pair each numerator with the vintage stated for it. The 124% debt-to-GDP figure is computed on the same June 30, 2026 MSPD debt used by the chart, against nominal GDP implied from the Z.1 Q1 2026 ratio ($31,850B), so it is consistent with the other mixed-date bars. The fiscal year-end 2025 stamp of 122% gross and 98% held by the public, used elsewhere in this section, pairs Treasury GFDEBTN at September 30, 2025 with calendar-year 2025 GDP and is not interchangeable with it.
The Valuation Blend
The 15.1x blended multiple that converts $7.2 trillion of business income into $108.5 trillion of business equity is built bottom-up from segment-level market data rather than assumed; the segment table sits in the US Profit and Valuation Component Details panel above, and the full derivation and tie-outs are on the Business Equity Components and Valuation Blend tabs of the companion workbook. The anchor chart is schematic and its block heights are indicative, not to scale.
The Hatched Segment
The “other public” profit segment (approximately $0.3 trillion, 8%) is an estimate and is expected to remain one; no comprehensive earnings aggregate exists for listed companies outside the S&P 500 on the same basis. It is hatched wherever it appears as a standing flag. Because the private C-corp and S-corp segment is derived as a residual (total less S&P 500 less other public), any error in the hatched estimate lands in the private segment even though that segment is displayed unhatched: a $100B move in the other-public estimate moves the private figure by the same $100B in the opposite direction.
Which Profit Series, and GAAP vs. NIPA
The $3.9 trillion total in the profit decomposition is BEA corporate profits after tax without IVA and CCAdj (FRED series CP), Q1 2026 SAAR, May 28, 2026 vintage ($3,917.2B). BEA publishes several “corporate profits after tax” variants; the headline with-IVA-and-CCAdj series (FRED CPATAX) read $3,623.7B for the same quarter, so naming the series matters. The without-adjustments variant is used here because it is the closer cousin to book profits when subtracting GAAP index earnings. The subtraction is still imperfect by construction: S&P 500 as-reported earnings include unrealized investment gains, goodwill impairments and foreign-source profits that NIPA treats differently, so part of the private residual reflects definitional differences rather than private-company profitability, and the S&P earnings run two quarters behind the BEA denominator (TTM Q3 2025 vs. Q1 2026 SAAR), which modestly understates the S&P share. The June 25, 2026 second estimate revised the series to $3,950.7B, which would move the private share from 41% to about 42%; the charts and table retain the May 28 vintage pending the next workbook refresh.
Sources
1. U.S. Treasury. “Monthly Statement of the Public Debt,” June 30, 2026, Tables I and III. fiscal.treasury.gov/reports-statements/mspd
2. U.S. Treasury. “Federal Debt: Total Public Debt.” FRED Series GFDEBTN (quarterly, end of period). FY2019 year-end: $22,719.4B. fred.stlouisfed.org/series/GFDEBTN
3. Federal Reserve. “Financial Accounts of the United States” (Z.1), Q1 2026, Table B.1 and corporate equities detail. federalreserve.gov/releases/z1
4. Federal Reserve. “H.6 Money Stock Measures,” May 2026 (M2SL, pre-restatement). federalreserve.gov/releases/h6
5. U.S. Treasury. Final Monthly Treasury Statement, FY2025, Table 9 (federal receipts). fiscal.treasury.gov/reports-statements/mts
6. Bureau of Economic Analysis. NIPA national income accounts: corporate profits after tax without IVA and CCAdj (FRED series CP, May 28, 2026 vintage), proprietors’ income, rental income of persons (Q1 2026, SAAR). fred.stlouisfed.org/series/CP; bea.gov/data/income-saving/corporate-profits
7. S&P Dow Jones Indices. S&P 500 earnings and estimates: as-reported (GAAP) earnings, trailing four quarters through Q3 2025; index market value 12/31/25. spglobal.com/spdji
8. FTSE Russell. Russell 3000 factsheet, June 30, 2026 (price-to-earnings ratio excluding negative earners). lseg.com/en/ftse-russell
9. CRE42.com Federal Debt Data Model. inflation-debt-in-context.xlsx: companion workbook for the Federal Debt Sustainability section. This page draws on the US Balance Sheet, Debt Comparisons, Valuation Blend, and Profit Decomposition tabs.
