
Total US nonfinancial debt grew from $16 trillion at fiscal year-end 1996 to $84 trillion in FY2025, a 5.2x increase versus 3.8x nominal economic growth (GDP) over the same period[1][3].
Debt by Sector in Dollars
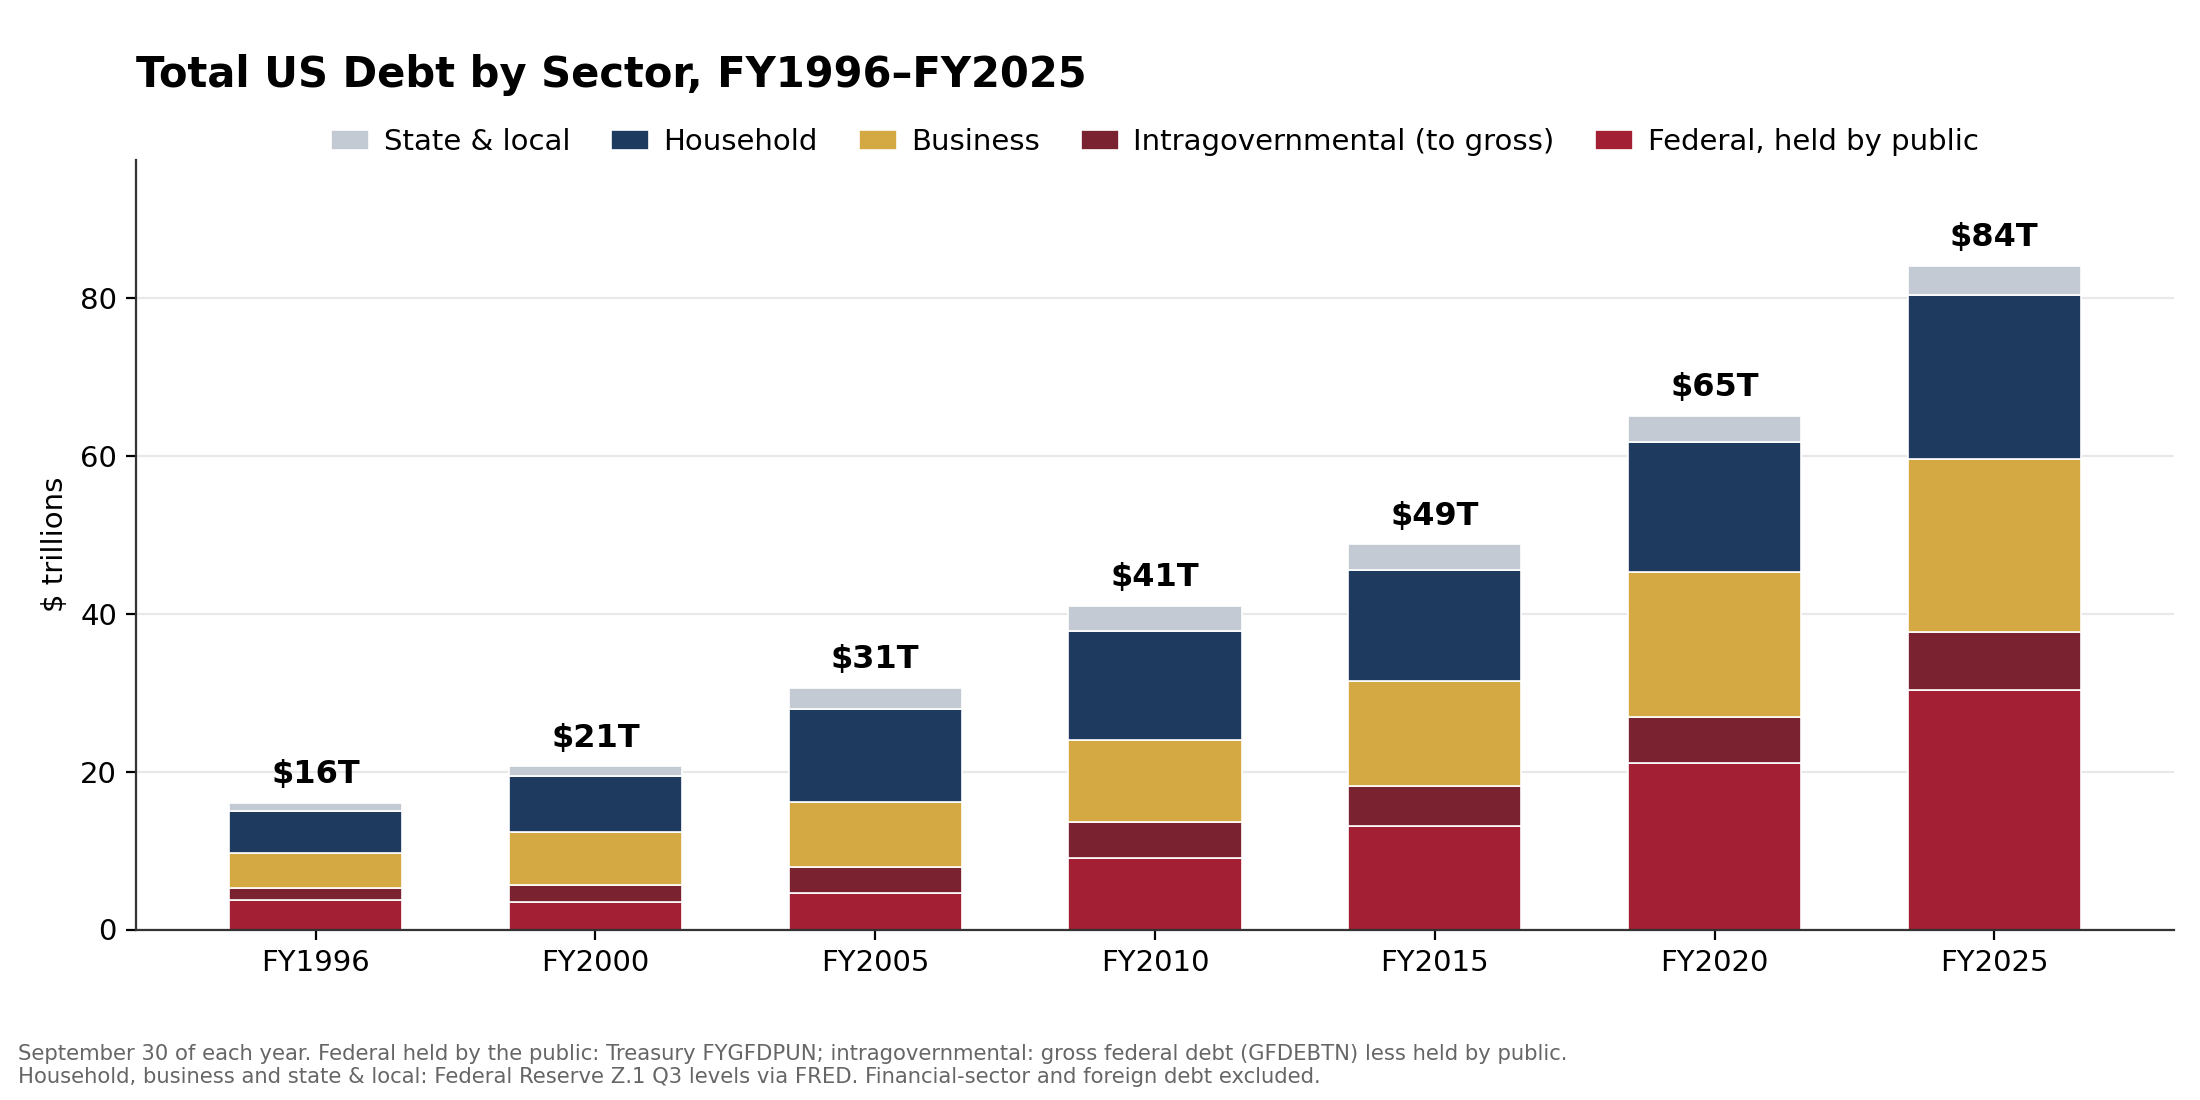
Fiscal year-end (September 30) snapshots at five-year intervals. Federal held by the public: U.S. Treasury FYGFDPUN; intragovernmental: gross federal debt (GFDEBTN) less debt held by the public. Sources: U.S. Treasury and Federal Reserve Z.1 via FRED | Chart: CRE42.com
Key Observations
Debt by Sector as a Share of GDP
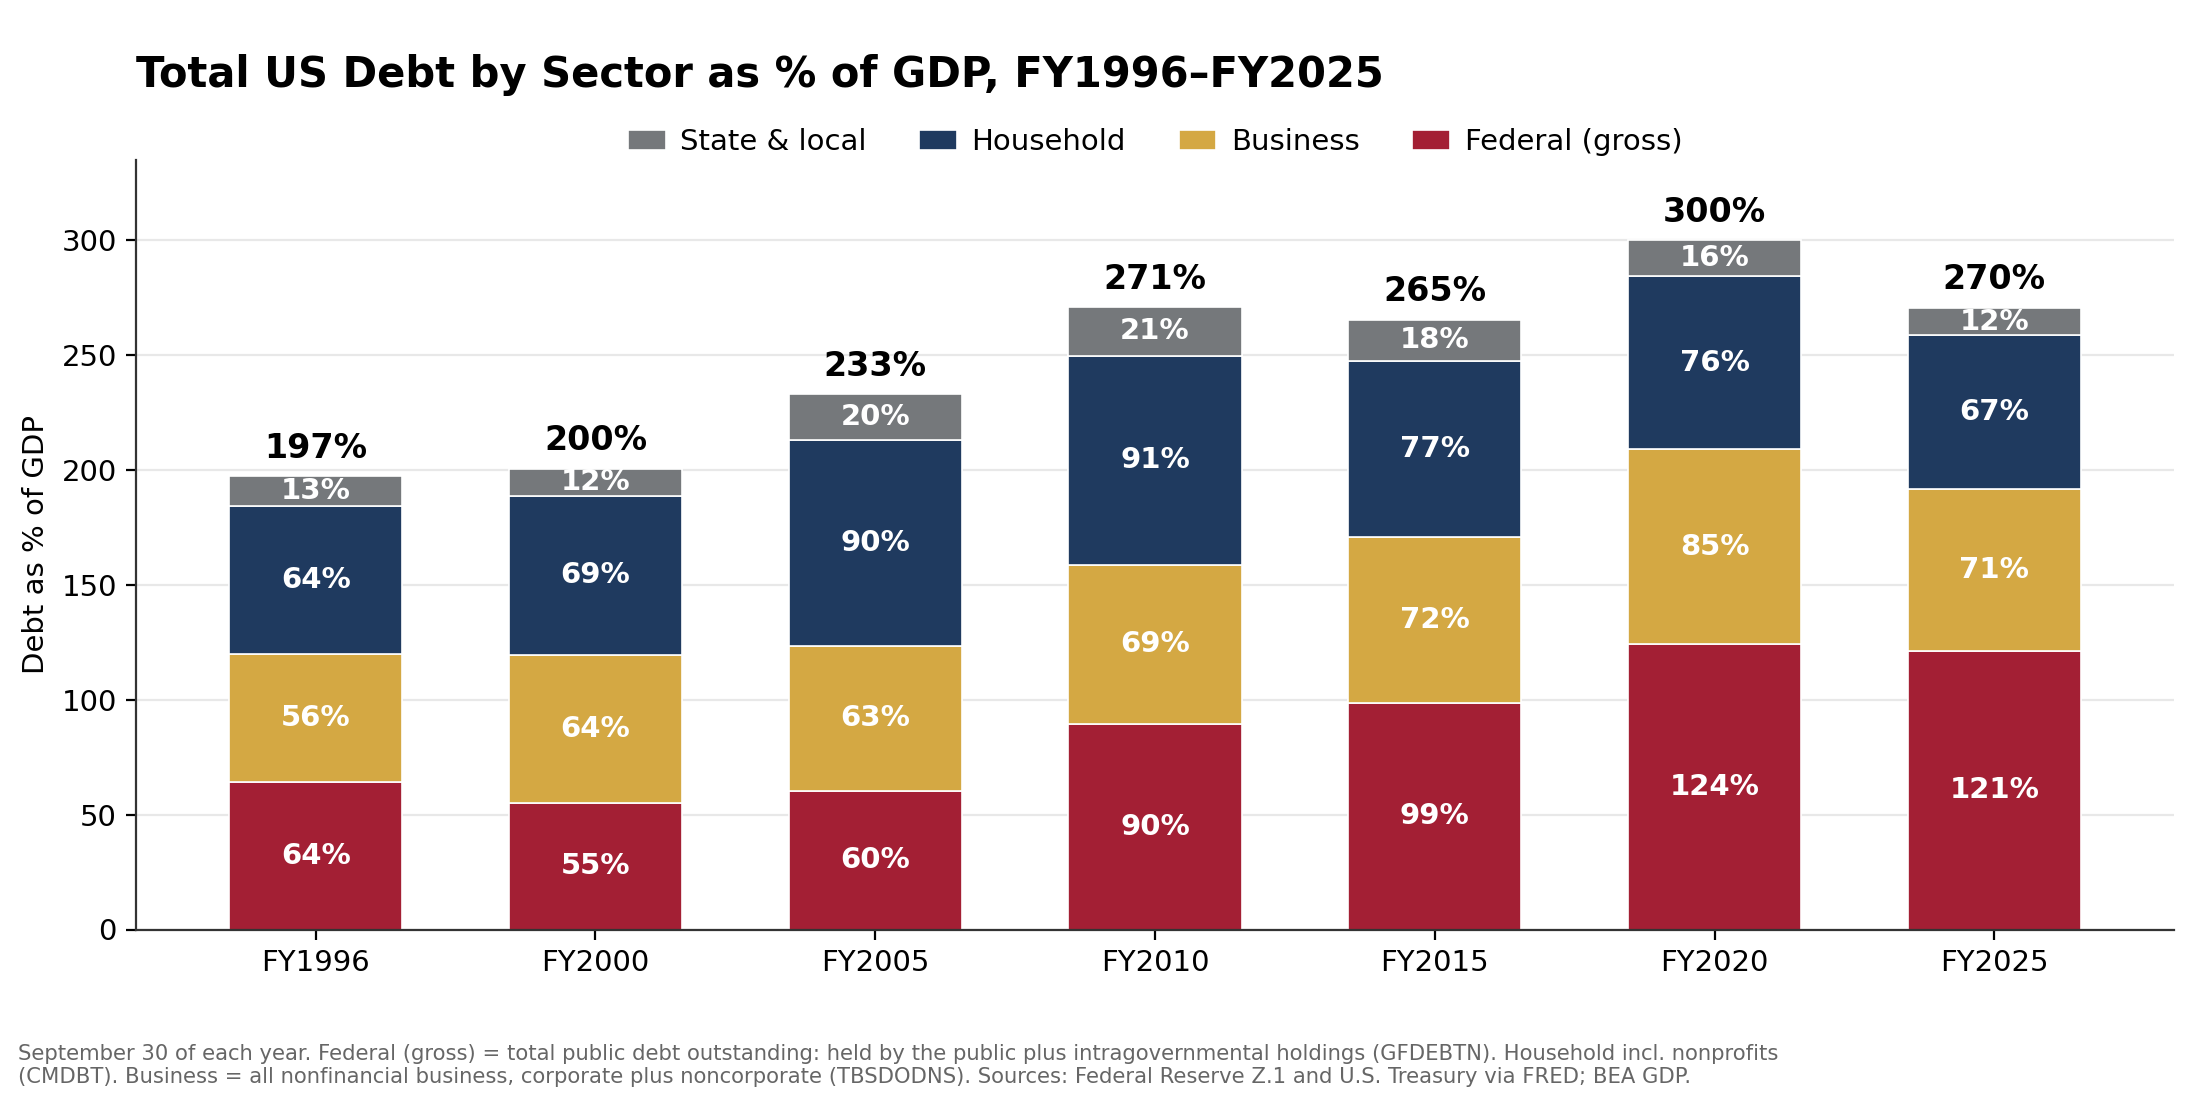
Total US Economy leverage has been essentially flat for fifteen years: 271% of GDP in FY2010, 270% in FY2025, with a pandemic peak of 300% in FY2020. In aggregate, the economy did not delever after 2008 and has not relevered since. Federal debt has grown much faster than other categories (see chart below).
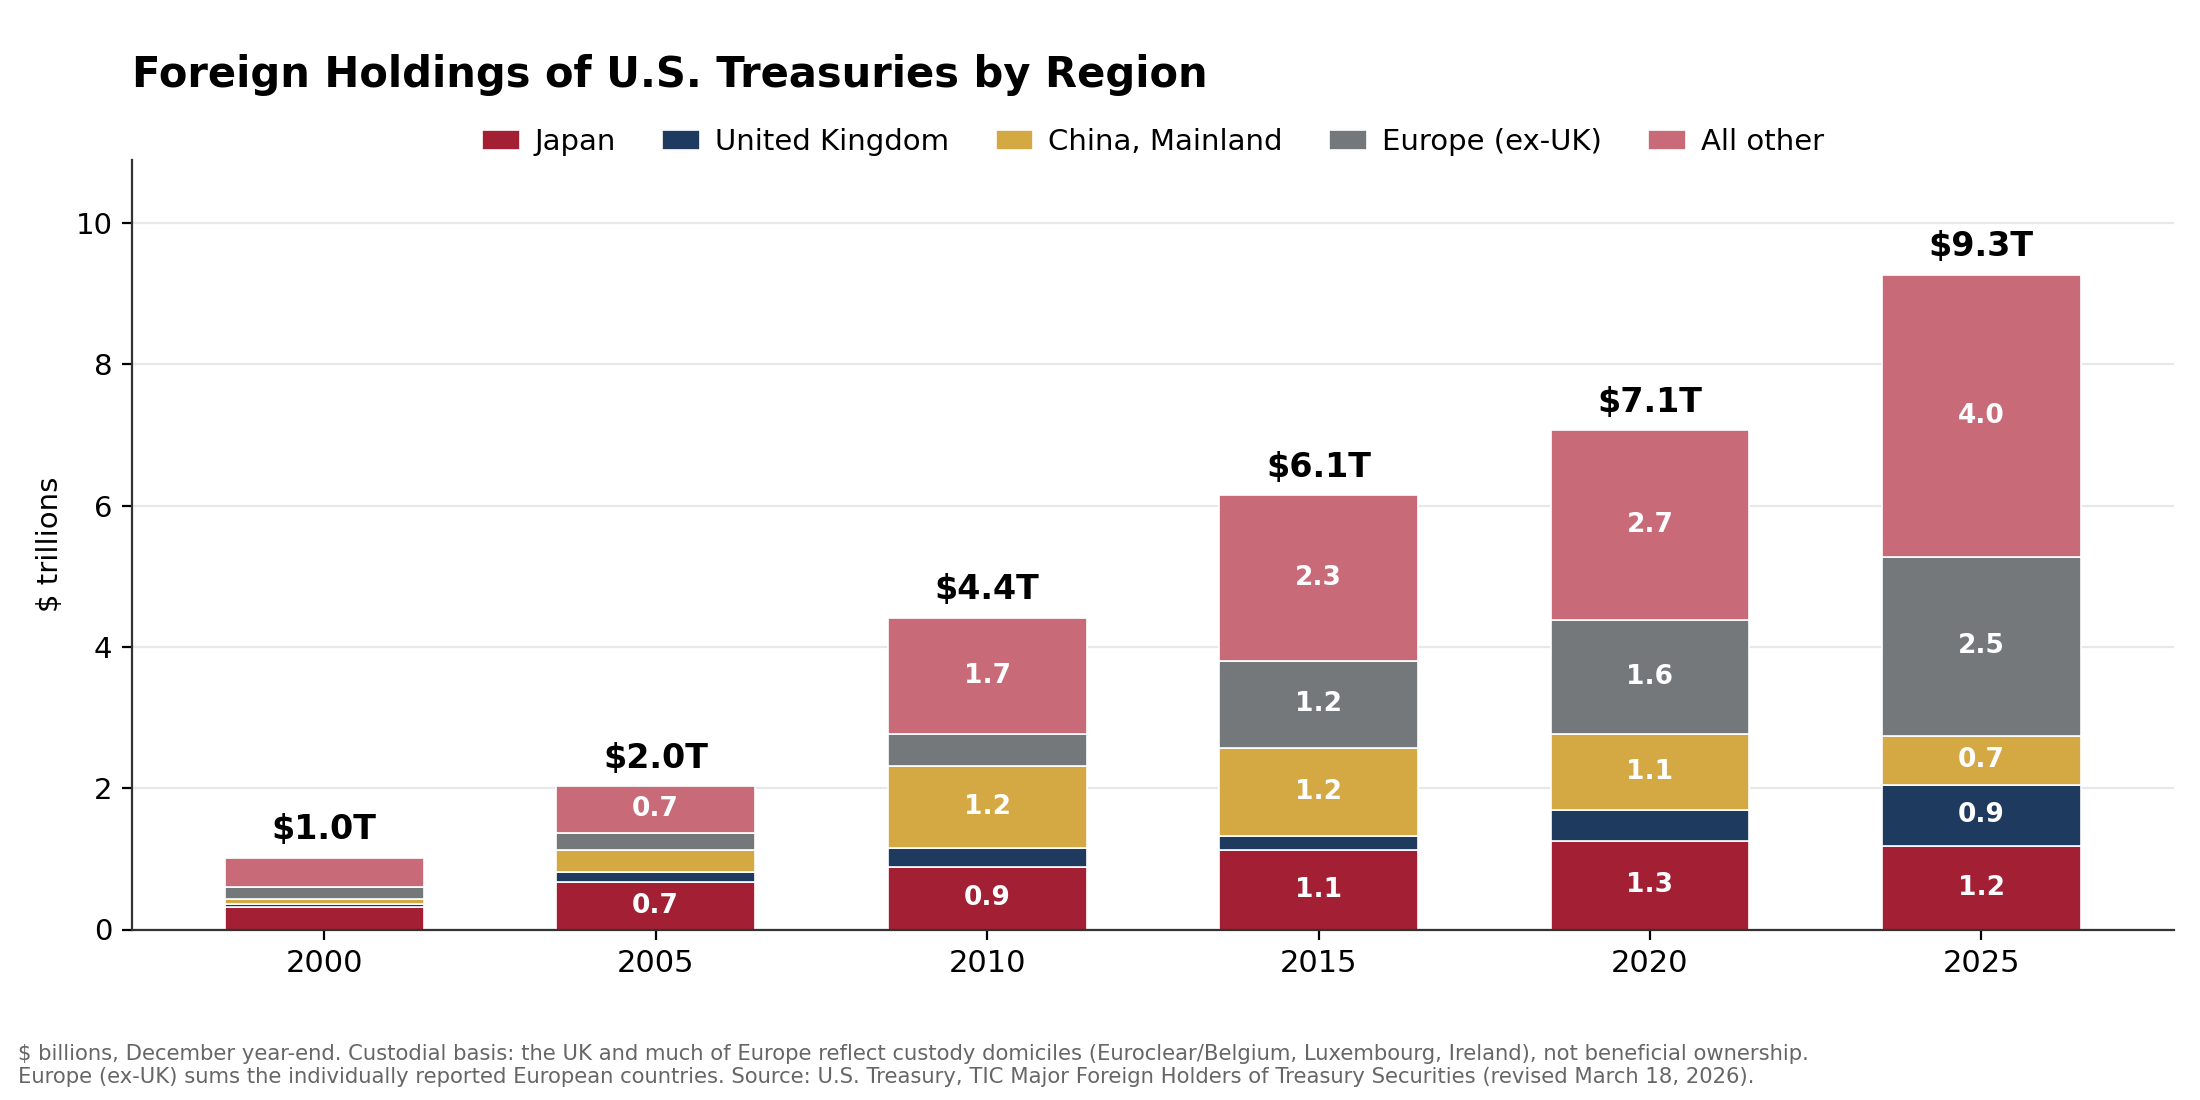
Foreign holdings of US Treasury securities by region, December year-end. Custodial basis: the UK and much of Europe reflect custody domiciles, not beneficial ownership. Source: U.S. Treasury, TIC Major Foreign Holders of Treasury Securities (revised March 2026) | Chart: CRE42.com
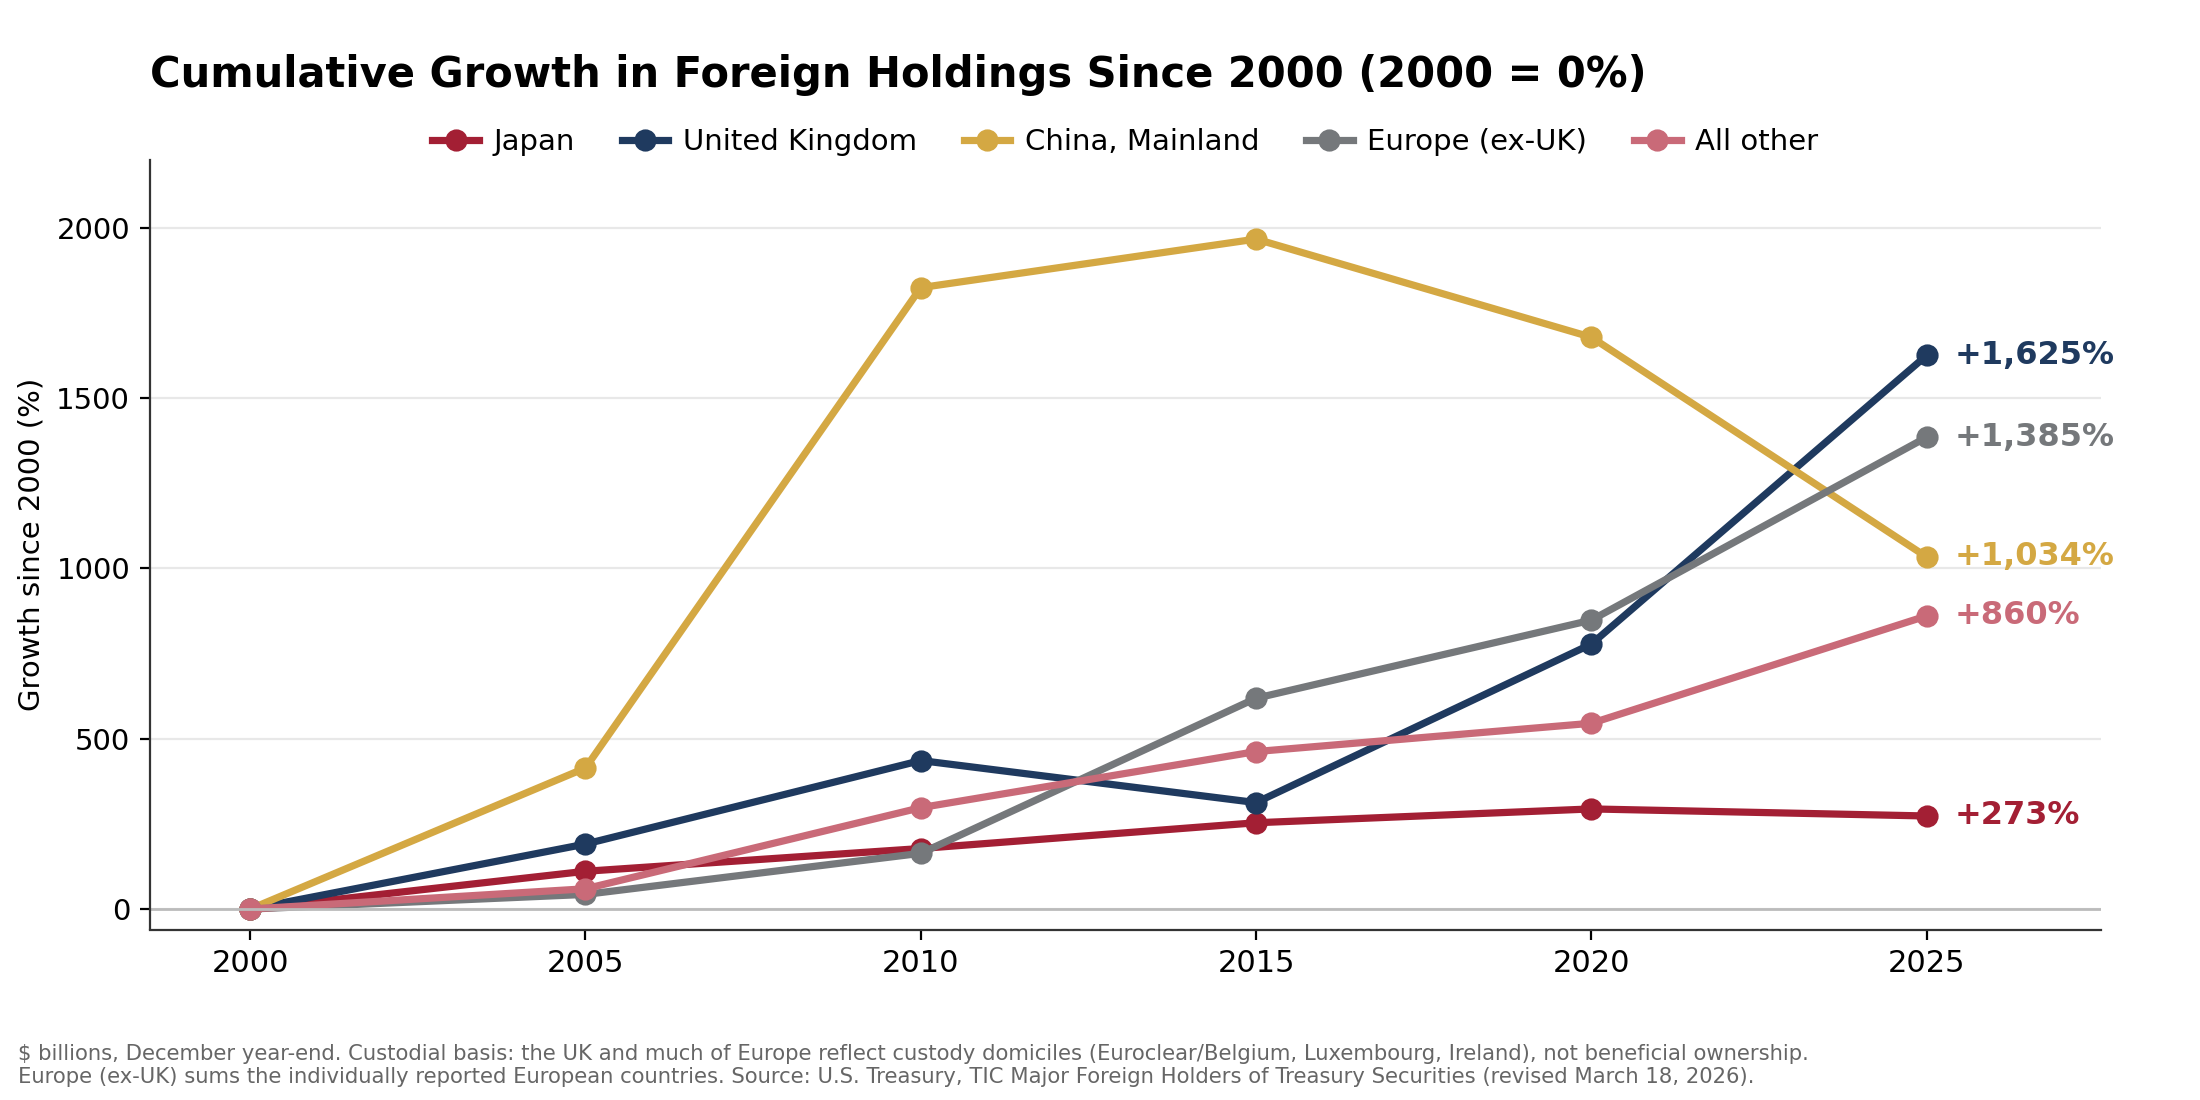
Cumulative growth in foreign holdings since 2000, by region, on the same custodial basis as the chart above. Source: U.S. Treasury, TIC Major Foreign Holders of Treasury Securities (revised March 2026) | Chart: CRE42.com
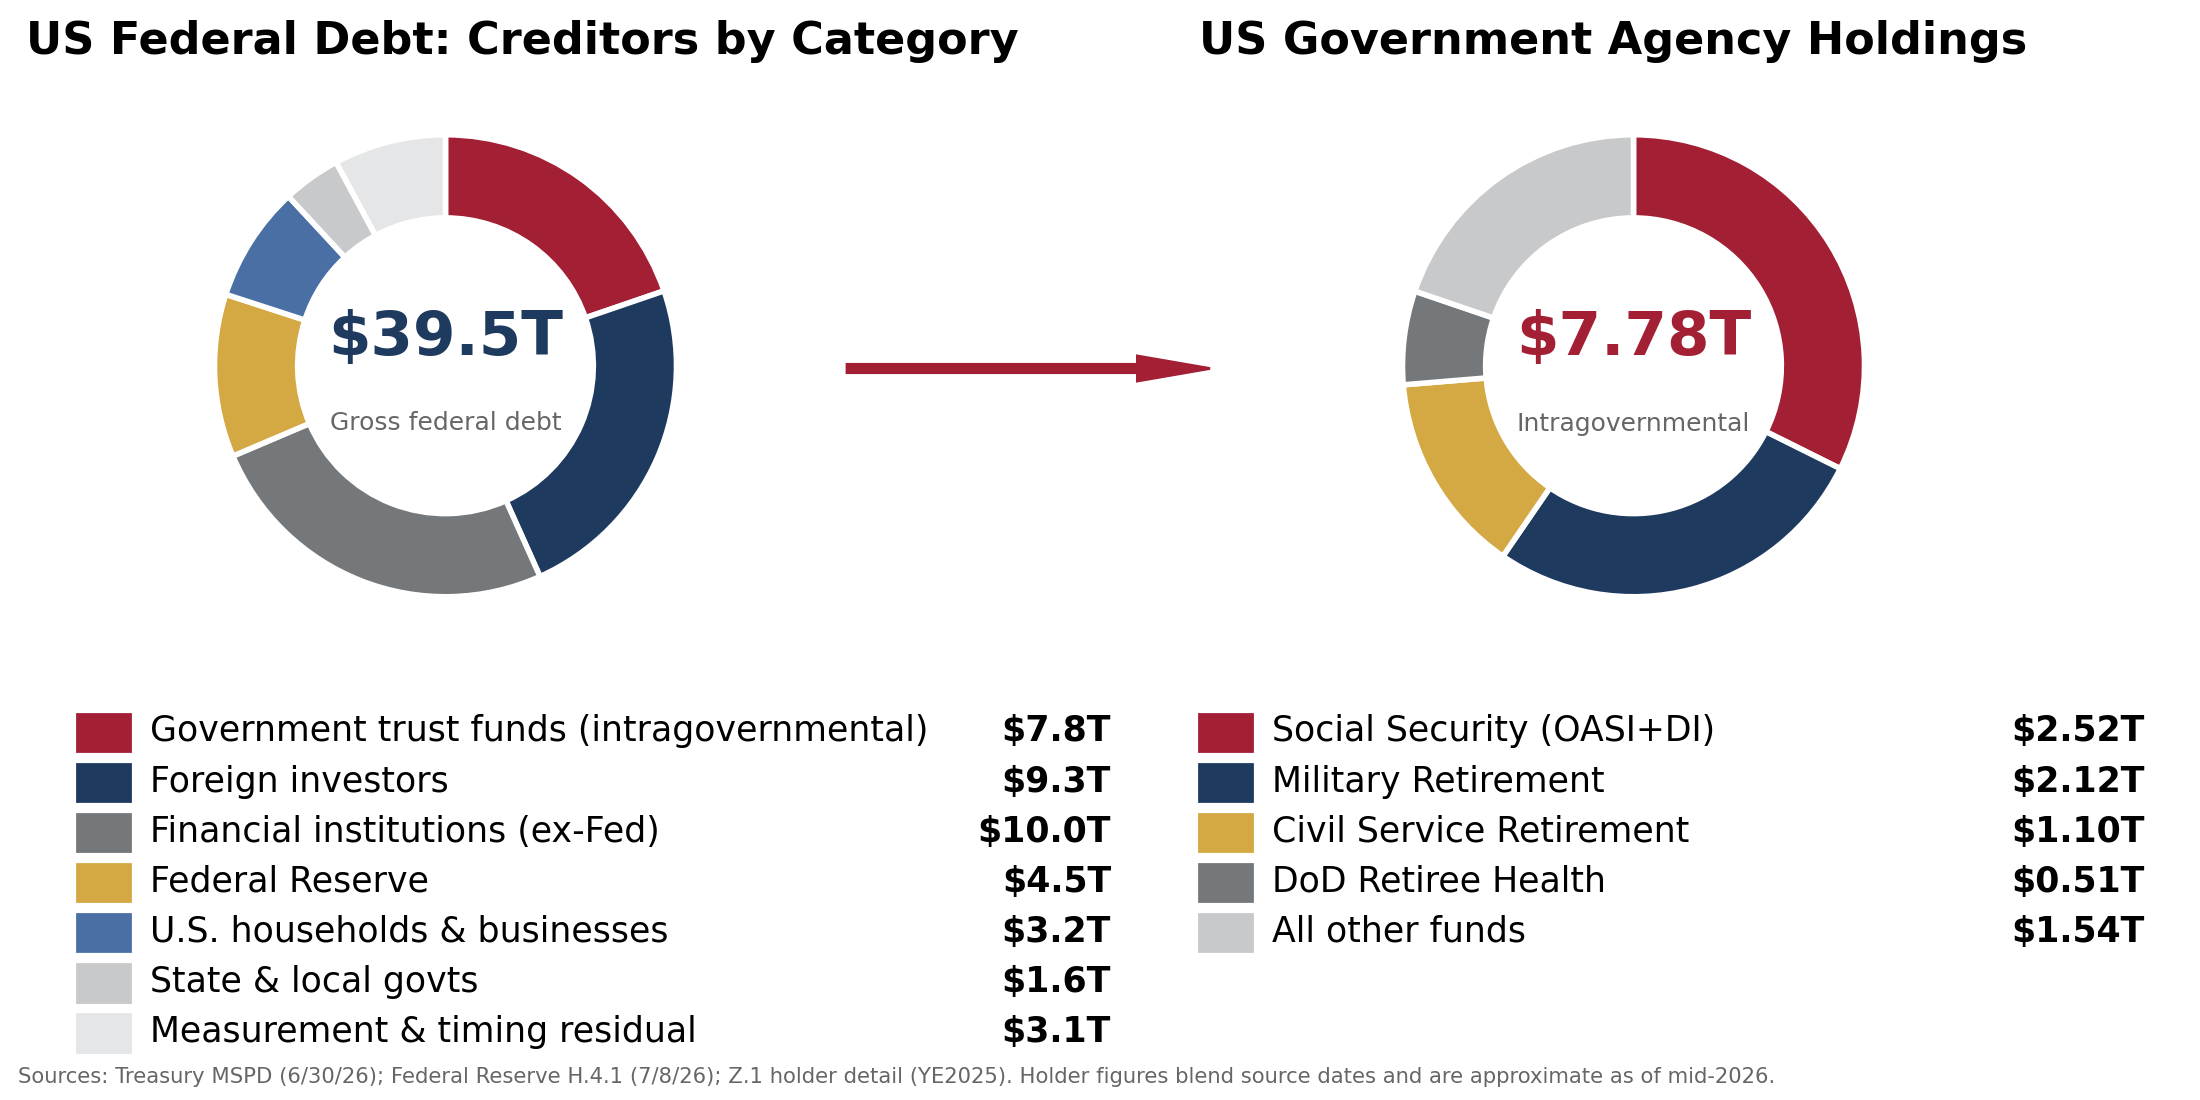
Who holds the $39.5T gross federal debt (left), and the $7.78T the government owes its own trust funds, broken out by fund (right). Sources: Treasury MSPD, Federal Reserve H.4.1 and Z.1 | Chart: CRE42.com
Holder figures blend source dates (Treasury MSPD June 30, 2026; Federal Reserve H.4.1 July 8, 2026; Z.1 year-end 2025) and are approximate as of mid-2026; the trust-fund breakdown (right) is exact per MSPD June 30, 2026. A single-date rederivation is scheduled with the next section update.
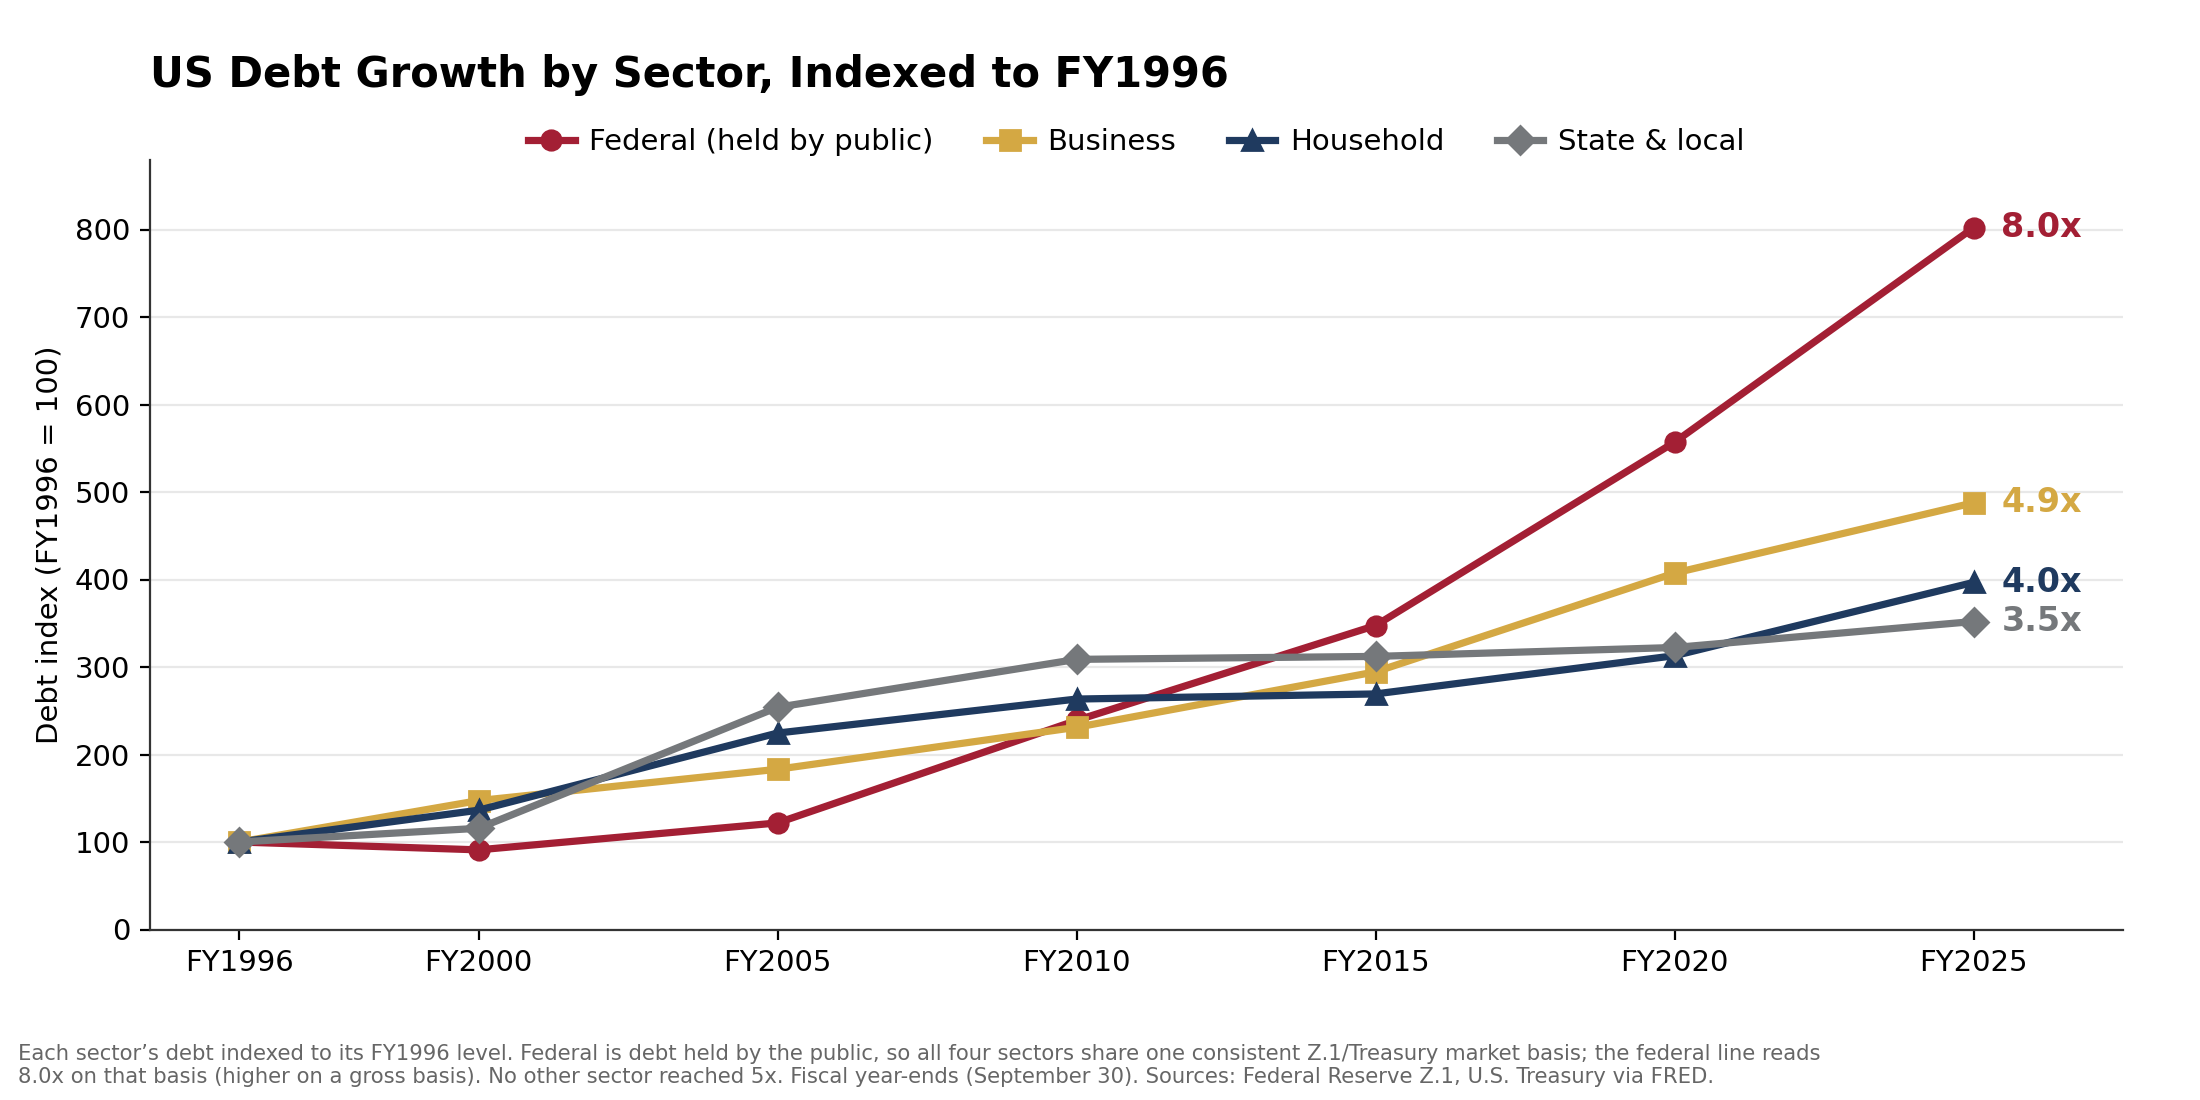
Each sector’s debt indexed to its FY1996 level. Federal is debt held by the public, so all four sectors share one consistent Z.1/Treasury market basis; the federal line reads 8.0x on that basis (higher on a gross basis). No other sector reached 5x. Sources: Federal Reserve Z.1, U.S. Treasury via FRED | Chart: CRE42.com
US Multi-Decade Shift from Credit Risk to Inflation Risk
As the relative total US debt burden moves from households and businesses to the federal government, overall economic risk shifts from default to inflation. Unlike businesses and individuals, the US government can essentially print money to pay debt, increasing the money supply and potentially sparking inflation (see the Money Supply page).
What to Watch For in 2026 and Beyond
Sources to Track the US Debt Stack:
| Source | Report or Series | Frequency | Notes |
|---|---|---|---|
| Federal Reserve | Z.1 Financial Accounts | Quarterly, ~10 weeks after quarter-end | The full sector detail; Q2 2026 release due September |
| FRED | CMDBT, TBSDODNS, GFDEBTN | Quarterly mirrors | Household, business, and federal series behind both charts |
| OMB | Historical Table 7.1 | Annual, with the Budget | Federal public vs. intragovernmental split |
| U.S. Treasury | Monthly Treasury Statement | Monthly | The deficit flow that feeds the federal bars |
| BEA | GDP (NIPA) | Quarterly | The denominator |
Footnotes
[1] Coverage and bases: snapshots are September 30 of each year, where the OMB fiscal year-end coincides with the Z.1 Q3 quarter-end. Federal gross debt = debt held by the public plus intragovernmental holdings. Household includes nonprofit organizations (Z.1 series CMDBT). Business is all nonfinancial business, corporate plus noncorporate (TBSDODNS). Financial-sector and foreign debt are excluded to avoid double counting: financial-sector borrowing largely re-lends the sectors shown. GDP: BEA. Full series and reconciliations are on the Sector Debt and Debt Comparisons tabs of the companion workbook.
[2] Household nominal figures are Z.1 Q3 levels via FRED, from the companion workbook’s Sector Debt tab.
[3] Growth multiples: total US nonfinancial debt $15.98T (FY1996) to $83.85T (FY2025) = 5.25x. Nominal GDP $8,073B (calendar 1996) to $30,762B (calendar 2025) = 3.81x. Sources: Federal Reserve Z.1 and U.S. Treasury for debt; BEA GDPA via FRED for GDP.
Methodology & Data Notes
Companion Workbook
inflation-debt-in-context.xlsx: companion workbook for the Federal Debt Sustainability section. This page draws on the Sector Debt tab: quarterly Z.1 series, fiscal year-end snapshots, and the reconciliations behind both charts.