U.S. Office Supply Cycle: 2000–2026
▸ THIS SECTION INCLUDES PROPRIETARY DATA AND IS NOT AVAILABLE FOR PUBLIC USE
▸ THE STATISTICS BELOW ARE BASED ON COSTAR AND MAY DIFFER SIGNIFICANTLY FROM THE METRICS CITED IN U.S. OFFICE MARKET: 2019–2025, WHICH ARE BASED ON BROKERAGE FIRM REPORTS
Overview
U.S. Office Net Delivered SF (2000–2026 YTD)
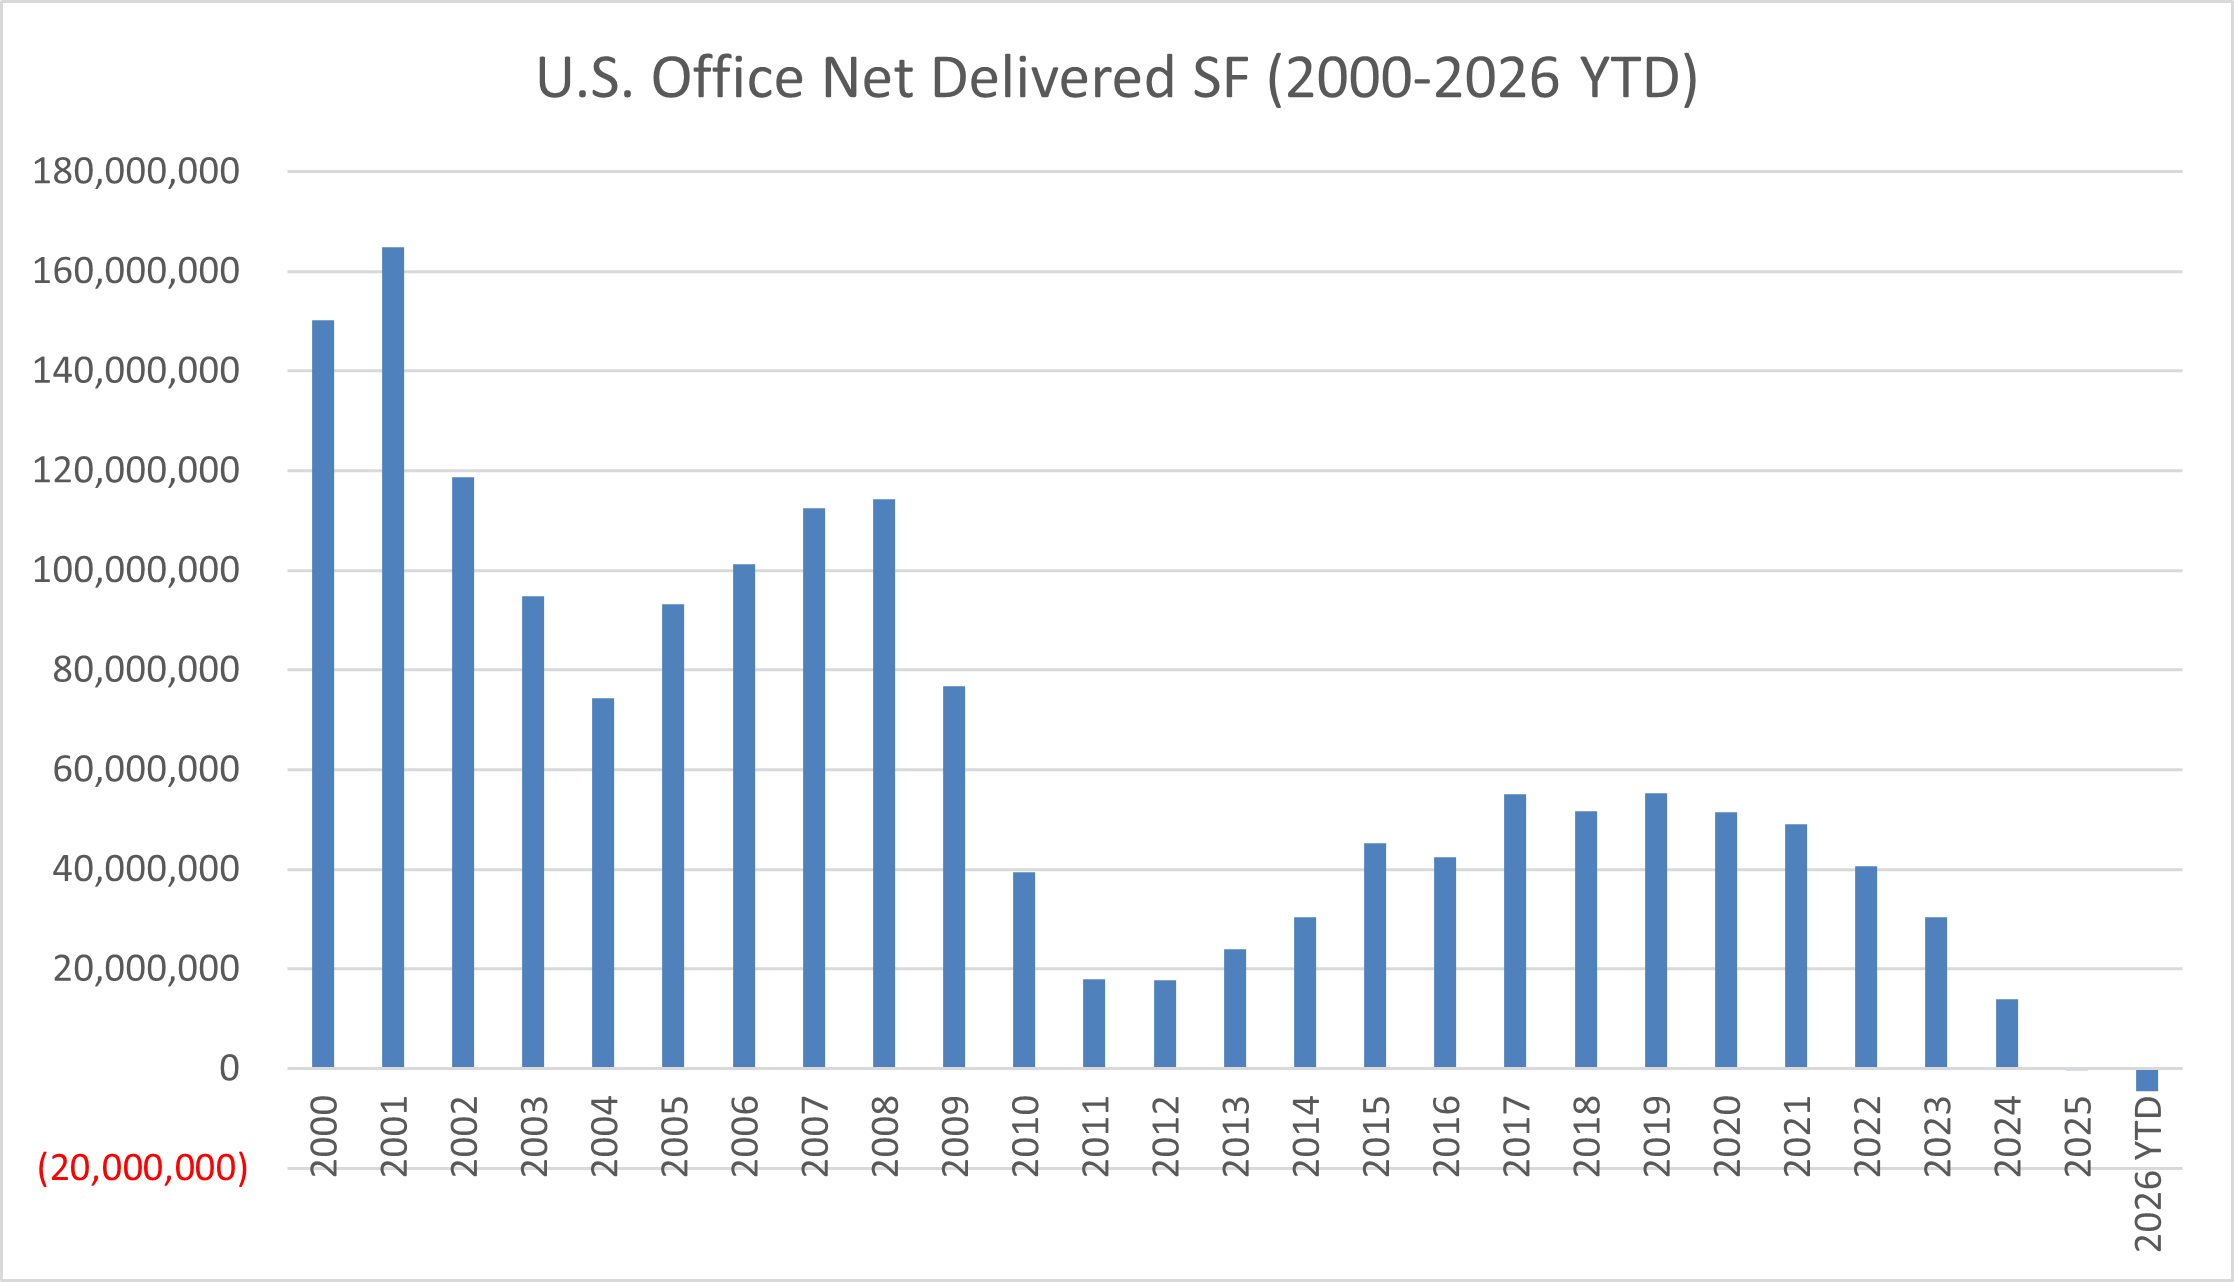
Source: CoStar, March 2026
U.S. Office Deliveries, Absorption & Vacancy (2000–2026 YTD)
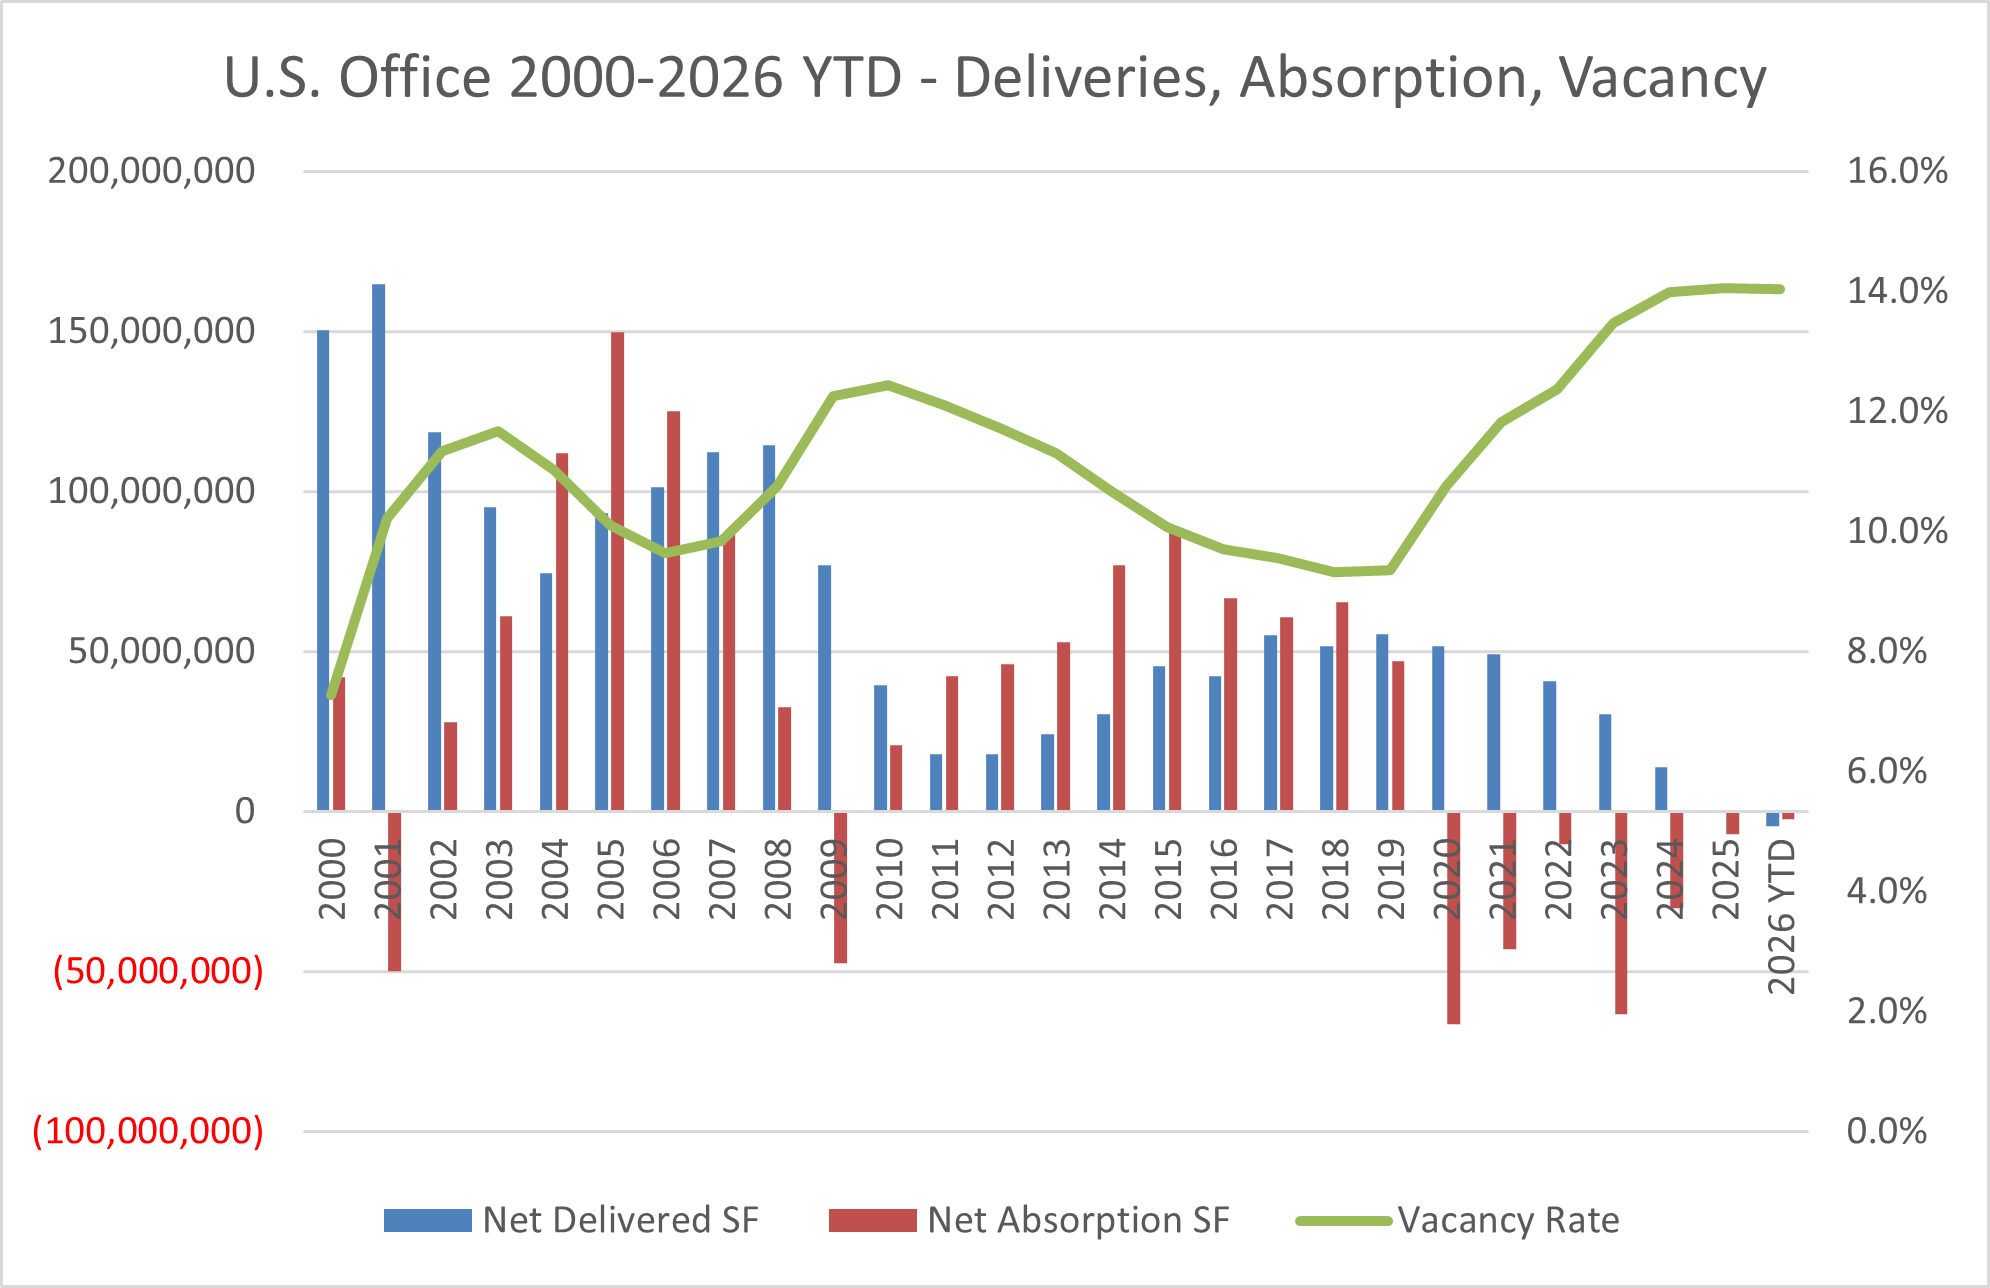
Source: CoStar, March 2026
U.S. Office Vacancy vs. Market Asking Rent (2000–2026 YTD)
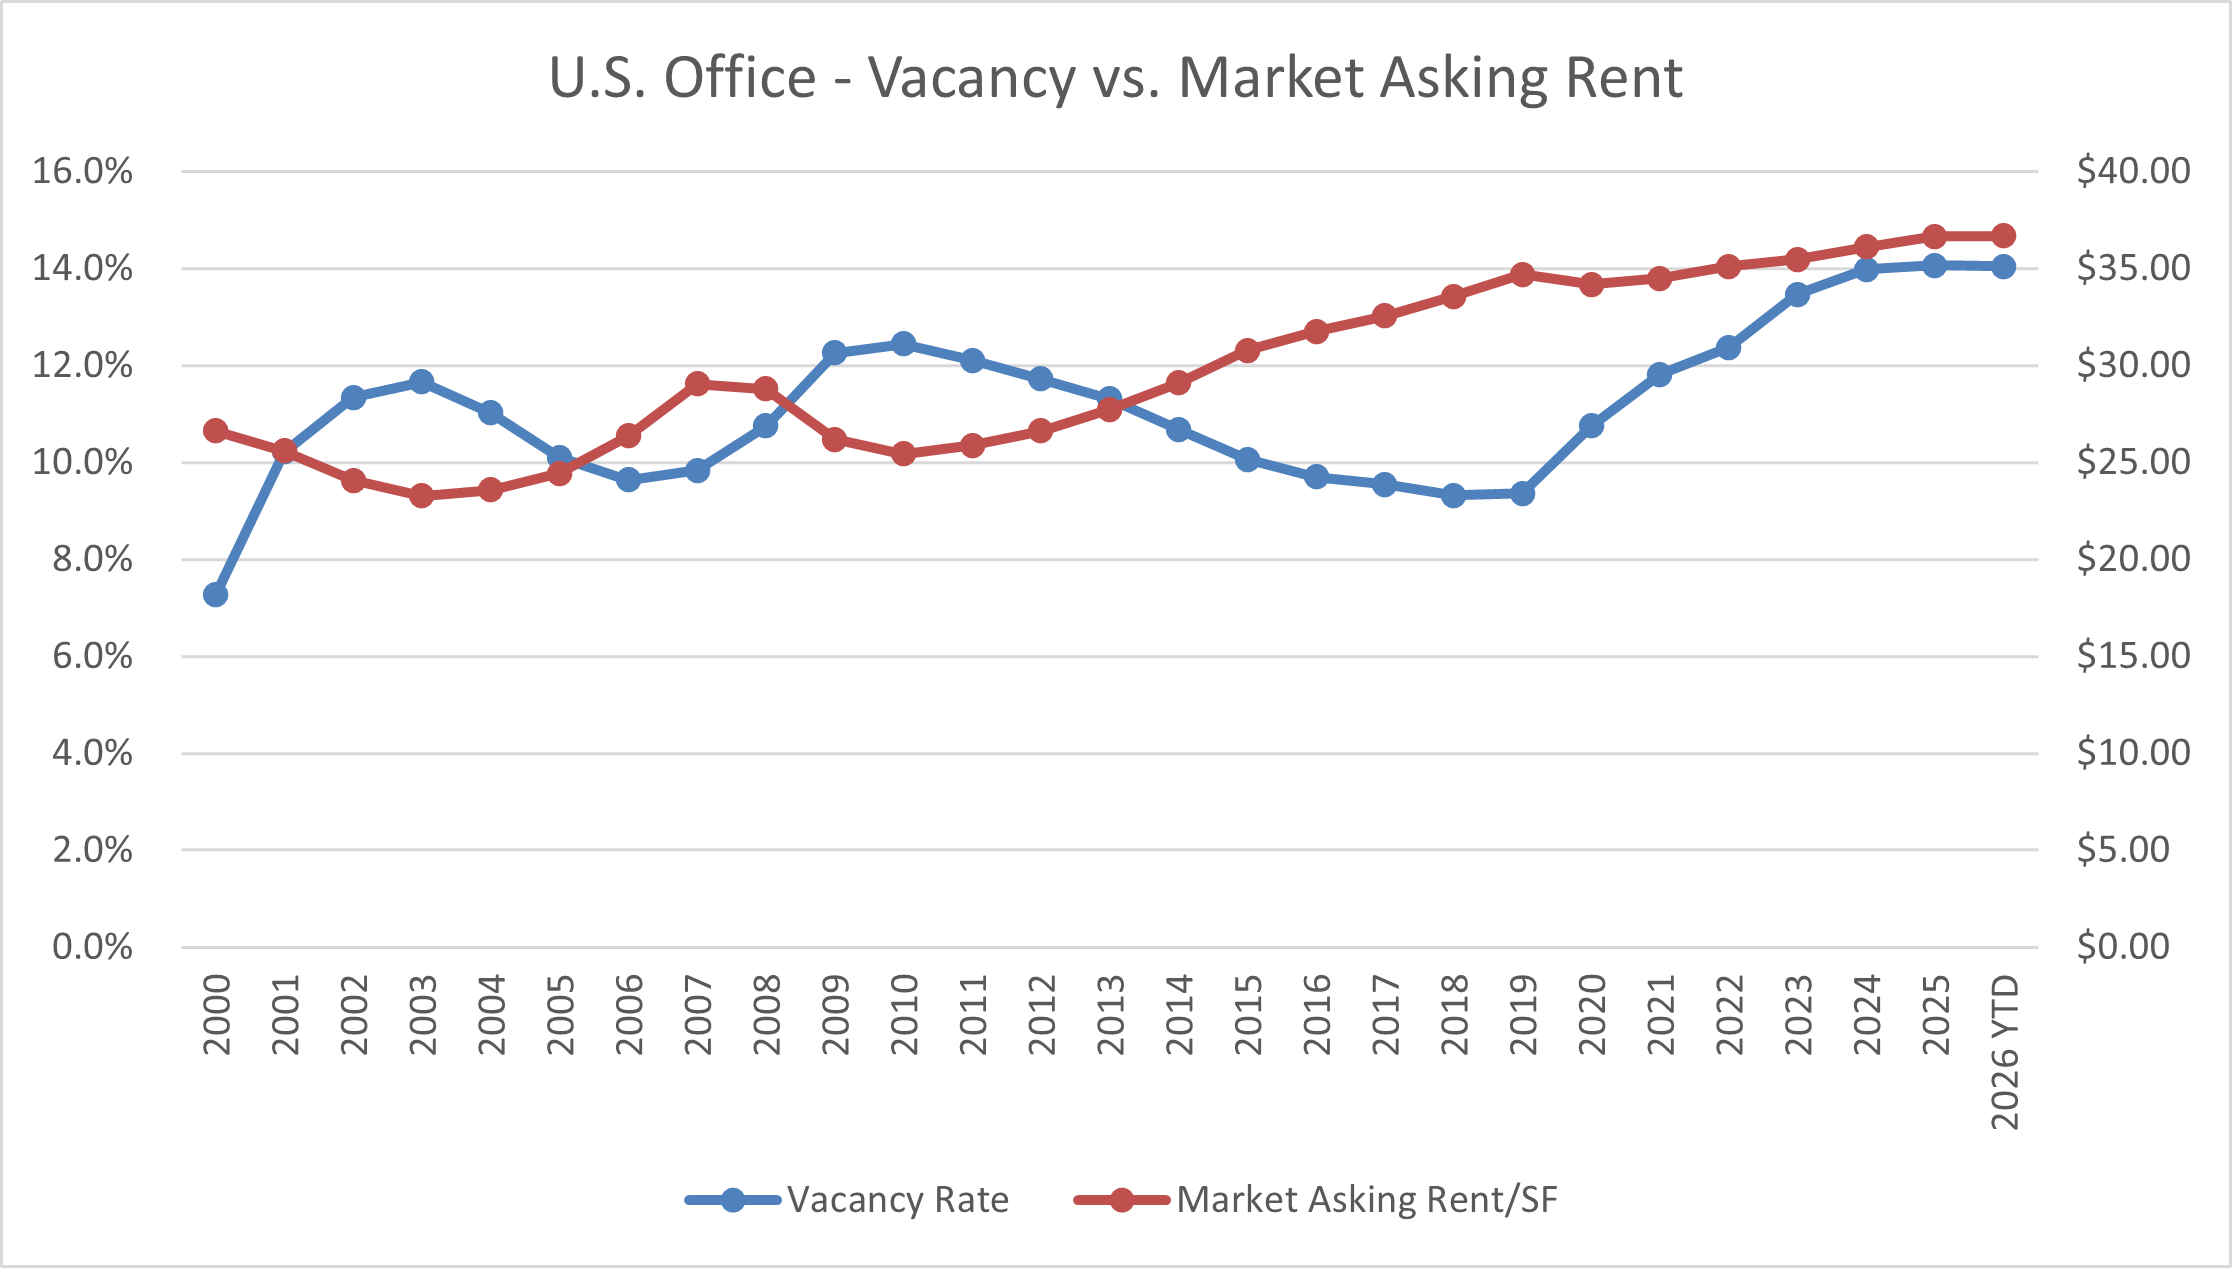
Source: CoStar, March 2026
Document Links
office-national-supply-cycle.xlsx — National office historical data (2000–2026 YTD) with native charts. CoStar, March 2026.
Key Observations
Context & Discussion
Quantifying the Demand Reduction from Covid-19, WFH and Hybrid Work
Net absorption turned sharply negative in 2020 (negative 66 million SF) and has not recovered in any subsequent year.[1] The cumulative loss of approximately 221 million SF of occupied office space since 2020 is without precedent in the modern dataset. For context, the dot-com bust produced only one year of negative absorption (2001: negative 50 million SF), and absorption recovered within two years. The availability rate—which includes both vacant and soon-to-be-vacant space—reached 15.4% in 2026, indicating further occupancy losses are in the pipeline as lease expirations roll through.[1]
Flight to Quality
Market asking rents have risen 38% from $26.61/SF in 2000 to $36.65/SF in 2025, despite vacancy nearly doubling over the same period.[1] This counterintuitive outcome reflects a structural shift in the composition of occupied office space. Tenants are consolidating footprints and migrating to Class A and trophy buildings with modern amenities, while older Class B and C buildings experience disproportionate vacancy. As lower-quality space empties and higher-quality space commands premium rents, the average asking rent across the remaining leased inventory rises even in a weakening demand environment.
Supply-Side Response: Near-Zero Starts and Inventory Contraction
The supply side has responded to the demand crisis with a near-complete shutdown of new office construction. Construction starts fell from 97 million SF in 2019 to 21 million SF in 2025, and just 2.2 million SF in year-to-date 2026 (annualized: roughly 9 million SF).[1] Space under construction has dropped from 159 million SF in 2019 (2.0% of inventory) to 49 million SF (0.6%) as of early 2026. Net deliveries turned negative in 2025 for the first time in the dataset, meaning the total U.S. office inventory is now shrinking as demolitions and office-to-residential conversions outpace the small volume of remaining completions.
What to Watch in 2026
Return-to-office mandates and their effect on absorption are the most consequential near-term variable. Several major employers (Amazon, JPMorgan Chase, Goldman Sachs) mandated five-day in-office return policies in late 2024 and early 2025, and additional firms may follow. The extent to which these mandates translate into net positive absorption—versus mere headline announcements with limited enforcement—will determine whether the six-year negative absorption streak can be broken in 2026.
Office-to-residential conversion activity continues to accelerate as municipalities expand incentive programs. Cities including New York, Chicago, Washington D.C., and Calgary have introduced tax abatements, zoning flexibility, and direct subsidies for office-to-residential conversion projects. While total conversion volumes remain small relative to the inventory of functionally obsolete office space, these programs provide a market-clearing mechanism that permanently removes surplus supply and supports long-term vacancy normalization.
Sources to Track U.S. Office Supply in 2026:
| Source | Report / Series | Frequency | Notes |
|---|---|---|---|
| CoStar | Quarterly national and MSA-level update | Quarterly | Most granular source for deliveries, starts, absorption, vacancy, and availability by submarket |
| CBRE | U.S. Office Figures | Quarterly | National summary with metro-level detail; tracks net absorption, vacancy, rent growth, and investment volume |
| JLL | U.S. Office Outlook | Quarterly | Tracks availability, leasing velocity, and sublease trends; good for flight-to-quality analysis |
| U.S. Census Bureau | Construction Spending: Office | Monthly | Dollar-denominated construction put in place; captures spending trajectory even when unit starts data is limited |
Notes
[1] CoStar. U.S. Office National Historical Data (March 2026). costar.com. Includes annual data for inventory, net delivered SF, construction starts, net absorption, vacancy rate, availability rate, asking rent/SF, rent growth, and under-construction SF for the U.S. office market, 2000–2026 YTD. ↩
Methodology & Data Notes
Data Source & Period
All national office data sourced from CoStar’s U.S. Office National Historical dataset, downloaded March 2026. The dataset covers annual observations from 2000 through 2025, plus year-to-date 2026 (through approximately March 2026). “Net Delivered SF” subtracts demolished and converted square footage from gross deliveries. “Construction Starts” represents the square footage of office projects that broke ground in each calendar year. “Net Absorption” represents the change in occupied square footage over the period.
Vacancy Rate vs. Availability Rate
Vacancy rate represents the percentage of total inventory that is physically vacant at period end. Availability rate is a broader measure that includes vacant space plus occupied space that has been listed for sublease or will become available at lease expiration. Availability rate data begins in 2005 in the CoStar dataset. The gap between availability and vacancy (approximately 150–200 bps in recent years) reflects the volume of “shadow” supply that will flow into direct vacancy as leases expire.
Rent Growth & Flight to Quality
Market asking rent represents the CoStar-weighted average asking rent per SF across the full office inventory. Because the metric is calculated across all tracked space, compositional shifts—specifically, the outperformance of Class A rents and the exit of lower-quality space from the leased inventory—can drive the average upward even in periods of aggregate demand decline. Rent growth data begins in 2001.