U.S. Office Regional Divergence: Elevated Vacancy, Minimal New Supply
▸ THIS SECTION INCLUDES PROPRIETARY DATA AND IS NOT AVAILABLE FOR PUBLIC USE
▸ THE STATISTICS BELOW ARE BASED ON COSTAR AND MAY DIFFER SIGNIFICANTLY FROM THE METRICS CITED IN U.S. OFFICE MARKET: 2019–2025, WHICH ARE BASED ON BROKERAGE FIRM REPORTS
Overview
This analysis covers all 37 U.S. metropolitan areas with office inventory exceeding 100 million SF each. MSAs located in the South region (see list of MSAs: office-regional-divergence.xlsx, Market Detail tab) accounted for 38% (13.2 million of 34.8 million SF) of total office space delivered in the trailing twelve months through March 2026.[1] The South’s inventory-weighted vacancy rate now stands at 15.9%, compared to 12.9% in the Northeast, 12.6% in the Midwest, and 16.0% in the West. Total vacancy among this data set is 14.0%, more than double the 6–7% level generally considered “equilibrium” for office product.[1]
Multifamily and industrial divergence stories (multifamily regional divergence, industrial regional divergence) have been driven by a supply wave in growth markets, primarily in the South. In office, vacancy remains elevated in every region, driven by remote and hybrid work adoption.
However, only 3 of 37 major markets experienced (small) negative rent growth in the last 12 months. With effectively zero new supply entering the market (under-construction SF represents just 0.6% of national inventory) and continued removal of older obsolete product from the supply base, the office market appears to be stabilizing in the current cycle.[1]
Office Deliveries by Census Region — Trailing 12 Months (March 2026)
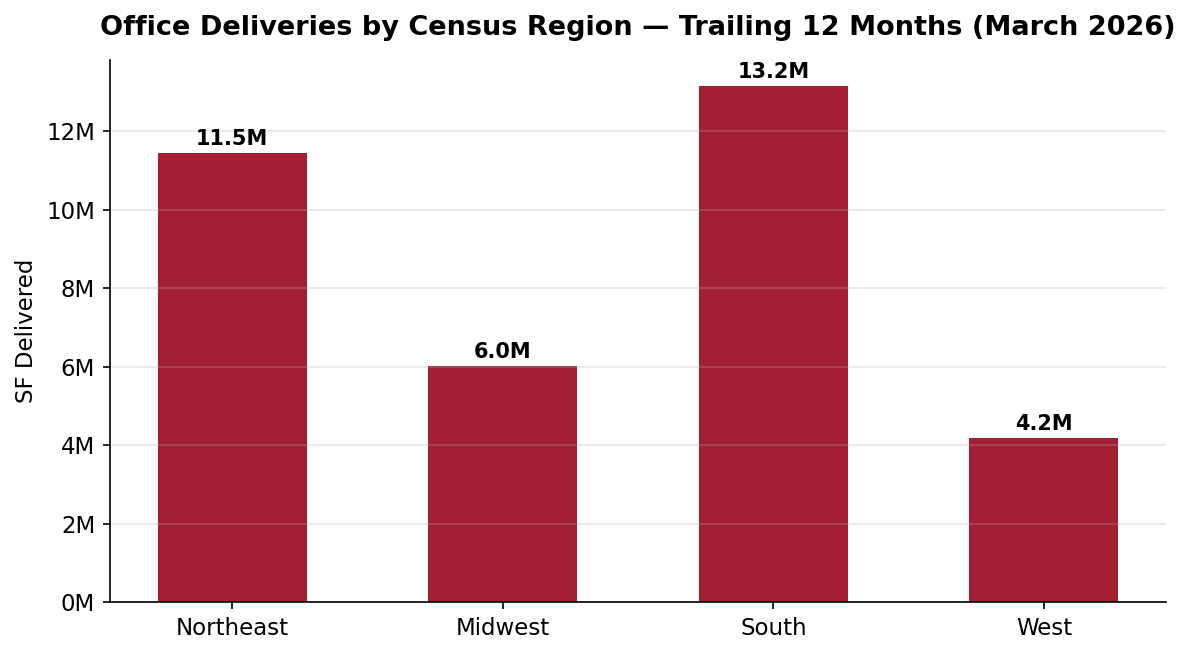
Source: CoStar, March 2026. 37 MSAs with 100M+ SF office inventory, grouped by Census region.
Office Vacancy Rate by Census Region — Inventory-Weighted (March 2026)
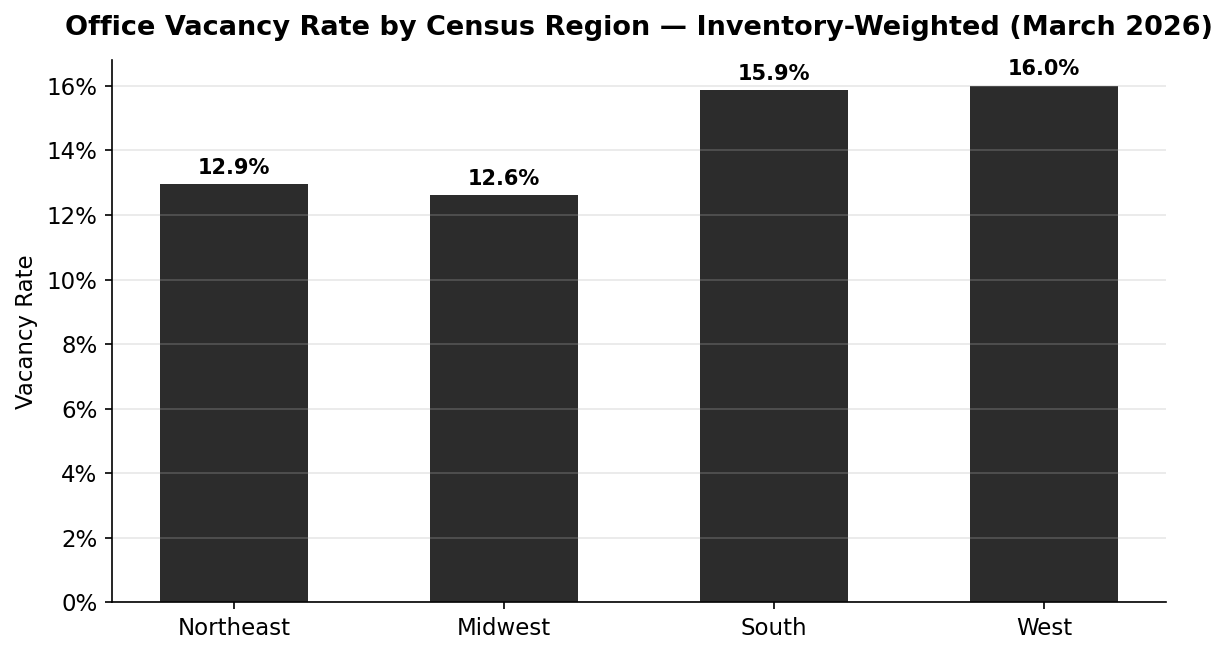
Source: CoStar, March 2026. Weighted by inventory SF across 37 MSAs with 100M+ SF office inventory.
Document Links
office-regional-divergence.xlsx — Regional summary and 37-market detail (100M+ SF markets only) with vacancy, availability, rents, deliveries, and sale prices. CoStar, March 2026.
Key Observations
Quarterly Office Availability Change — Q1 2025 vs. Q1 2026
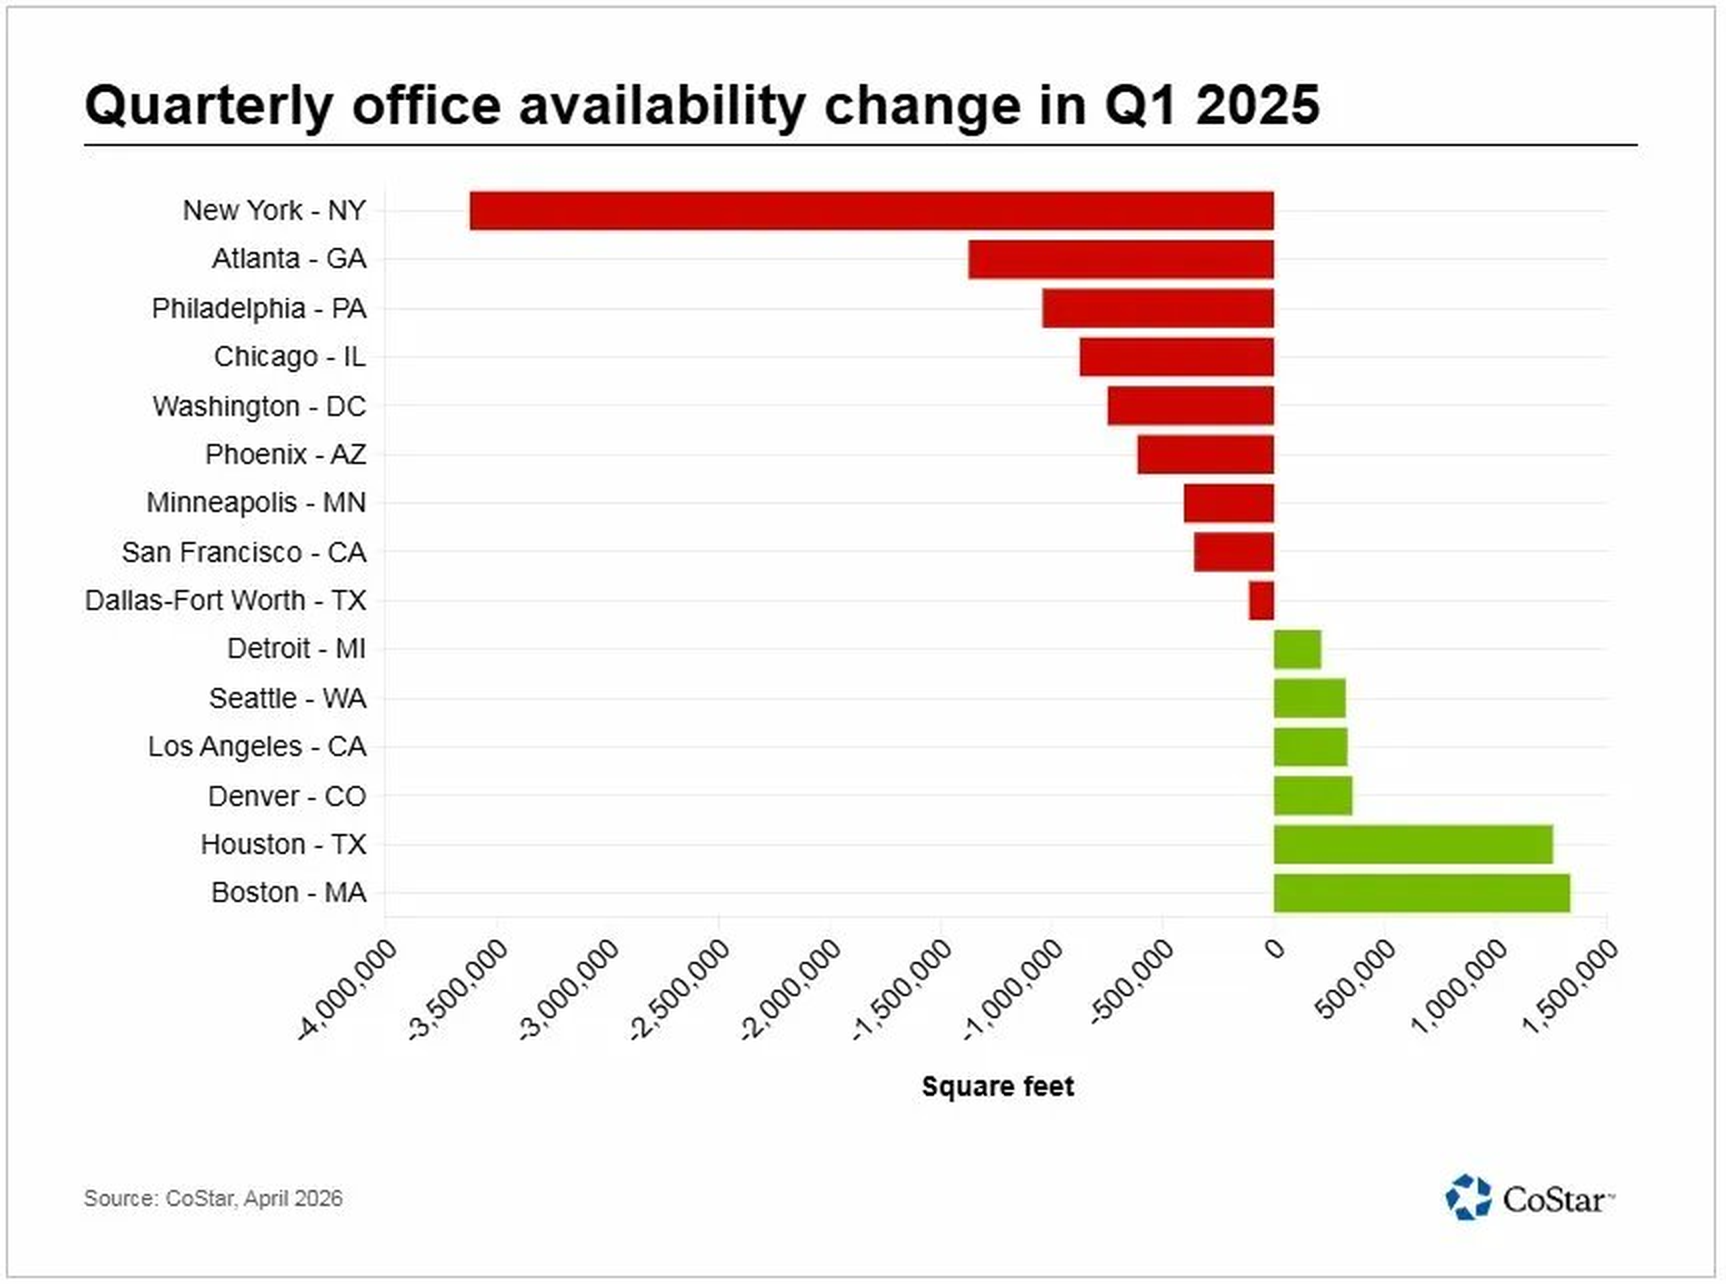
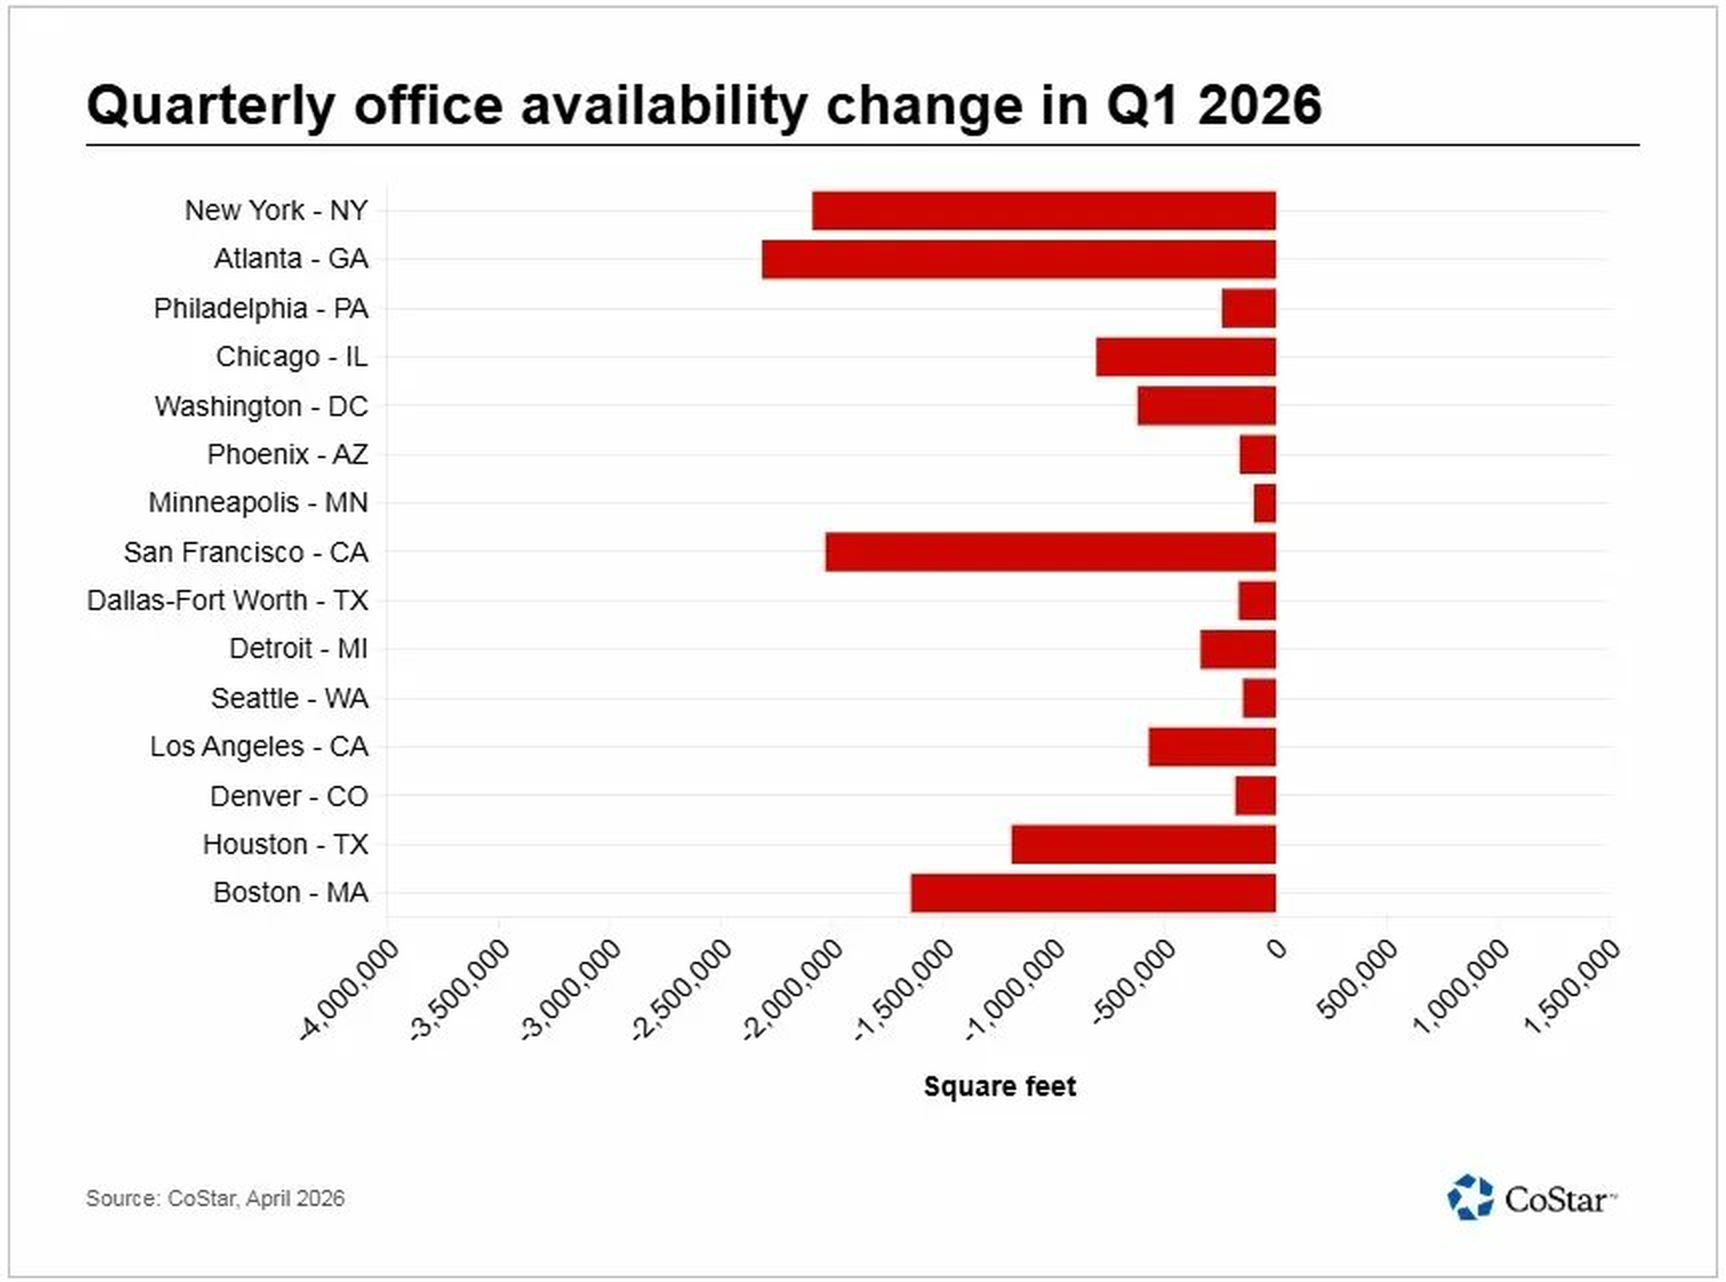
Source: CoStar, April 2026.
Office rents and vacancy statistics move more slowly than other asset types due to longer lease periods driven by high transaction costs (tenant improvement allowance, leasing commissions, logistical moving challenges). But after six years of contraction, the national office market finally appears to be finding its footing, as shown in the charts above. In Q1 2025, six major markets still posted positive quarterly availability change (green bars)—meaning available space was growing. By Q1 2026, every major market shows negative availability change, indicating that available space is shrinking across the board. Office demand is surging across markets, especially in coastal “gateway” markets like New York and San Francisco, both of which endured among the most severe demand shocks following the COVID-19 pandemic. San Francisco is notable because it shares the unusual dual distinction of leading the major markets in both current vacancy and availability as well as annual rent growth (see office-regional-divergence.xlsx, Market Detail tab).[1]
U.S. Office Occupancy Recovery — Kastle 10-City Weekly Average
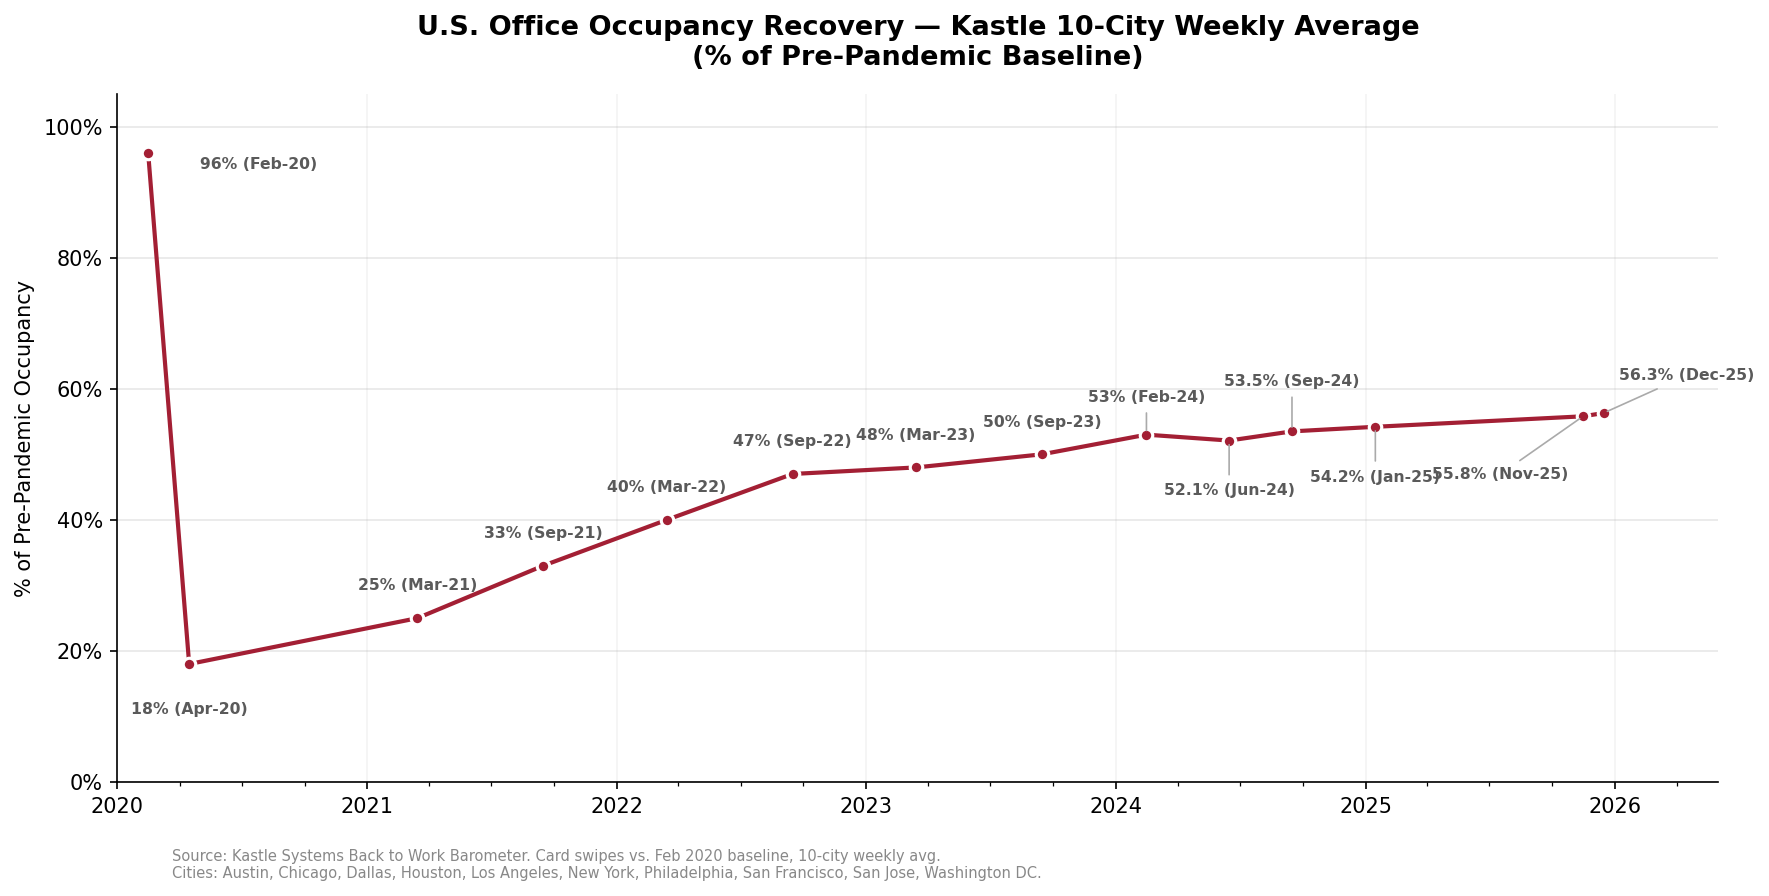
Source: Kastle Systems Back to Work Barometer. Card swipes vs. Feb 2020 baseline, 10-city weekly average.
Kastle Occupancy Data
The Kastle Back to Work Barometer tracks daily access card swipes across approximately 2,600 office buildings in 10 major U.S. metros. The resulting percentages represent daily office attendance as a percentage of a pre-pandemic February 2020 baseline (not the percentage of current employees).[2] It is important to note that this measure uses a five day baseline and likely understates the effective occupancy in a three-day hybrid environment. The 10-city weekly average often hovers around 55%, but mid-week peaks (Tuesday through Thursday) are typically running closer to 65% and Mondays and (especially) Fridays have become low-attendance days for the majority of companies and markets.
Kastle occupancy has climbed from a trough of 18% in April 2020 to a post-pandemic high of 56.3% in December 2025, and the upward trajectory has continued into 2026, though gains are increasingly gradual—the barometer has added roughly 6 percentage points over the past two years compared to 30+ points in the first two years of recovery. Texas cities consistently lead: Austin averaged 70.8% and Houston 61.7% in recent weeks, reflecting lower remote-work adoption and employer-friendly regulatory environments. San Francisco and San Jose lag the 10-city average, consistent with their elevated CoStar vacancy rates and concentration of tech-sector tenants who have been the most aggressive adopters of permanent remote work. Among the most striking findings: Class A+ buildings (CoStar 4–5 star, built after 2010) averaged 78.8% weekly occupancy in December 2025 with peak-day readings above 95%, underscoring the widening quality bifurcation between premium and commodity office space.[2]
What to Watch in 2026
The office market recovery trajectory will depend on the pace of obsolete supply removal, the evolution of return-to-office mandates, and the widening quality bifurcation between Class A trophy product and everything else. Several large employers—including Amazon, JPMorgan Chase, and Goldman Sachs—have announced full five-day return-to-office requirements, and others may follow. If this trend broadens, it could accelerate absorption in gateway markets. At the same time, the conversion pipeline (office-to-residential, office-to-lab, office-to-data center) remains a potential accelerant for supply removal, though regulatory and structural hurdles limit the pace. We will continue to track national supply cycle data, Kastle Systems utilization metrics, conversion activity, and Class A vs. Class B/C rent spreads to monitor recovery signals.
Sources to Track U.S. Office Regional Dynamics in 2026:
| Source | Next Release | Date | Notes |
|---|---|---|---|
| CoStar | Quarterly MSA-level office update | Ongoing (subscription) | Vacancy, rents, deliveries, starts, and absorption for 395 MSAs |
| Kastle Systems | Weekly Back to Work Barometer | Weekly | Office building access card swipe data for 10 major U.S. metros |
| CBRE Research | U.S. Office Figures | Quarterly | National and metro-level office fundamentals, cap rates, and investment activity |
Notes
[1] CoStar. U.S. Office Market Data — All Cities, 100M+ SF (March 18, 2026). costar.com. Includes trailing-twelve-month data for 37 MSAs with 100 million+ SF office inventory. Regional aggregations by CRE42 using Census region definitions (Northeast, Midwest, South, West). Vacancy and availability rates are inventory-weighted. Washington, D.C. and Baltimore are classified as South per Census convention. ↩
[2] Kastle Systems. Back to Work Barometer (weekly, ongoing). kastle.com. Tracks aggregate office building access card swipe data across 10 major U.S. metropolitan areas. The 50% plateau figure reflects a consistent range reported from mid-2023 through early 2026. ↩
Methodology & Data Notes
Data Source & Regional Classification
Market-level data sourced from CoStar’s U.S. Office dataset, “100M+ SF” tab, downloaded March 18, 2026. This tab includes 37 MSAs with office inventory of 100 million+ SF each, representing approximately 8.1 billion SF of the national total. Markets below this threshold are excluded. Markets were assigned to Census regions (Northeast, Midwest, South, West) by CRE42 based on the primary state of each MSA. Washington, D.C. and Baltimore are classified as South per Census convention.
Weighted Averages
Regional vacancy and availability rates are calculated as inventory-weighted averages: the sum of (rate × inventory SF) for all markets in the region, divided by total regional inventory SF. Regional rents and sale prices are calculated using the same inventory-weighted approach. This methodology ensures that larger markets exert proportionally greater influence on regional averages.
Office vs. Multifamily Comparison
Comparisons to multifamily regional divergence throughout this page reference data from U.S. Multifamily Regional Divergence, which covers 75 MSAs with 50,000+ multifamily units using the same CoStar dataset date (March 18, 2026) and the same Census region classification methodology.